HAL Id: hal-03183149
https://hal.archives-ouvertes.fr/hal-03183149
Submitted on 26 Mar 2021HAL is a multi-disciplinary open access archive for the deposit and dissemination of sci-entific research documents, whether they are pub-lished or not. The documents may come from teaching and research institutions in France or abroad, or from public or private research centers.
L’archive ouverte pluridisciplinaire HAL, est destinée au dépôt et à la diffusion de documents scientifiques de niveau recherche, publiés ou non, émanant des établissements d’enseignement et de recherche français ou étrangers, des laboratoires publics ou privés.
The molecular structure of phenetole studied by
microwave spectroscopy and quantum chemical
calculations
Lynn Ferres, Wolfgang Stahl, Ha Vinh Lam Nguyen
To cite this version:
Lynn Ferres, Wolfgang Stahl, Ha Vinh Lam Nguyen. The molecular structure of phenetole studied by microwave spectroscopy and quantum chemical calculations. Molecular Physics, Taylor & Francis, 2016, 114 (19), pp.2788-2793. �10.1080/00268976.2016.1177217�. �hal-03183149�
The molecular structure of phenetole studied by microwave
spectroscopy and quantum chemical calculations
Lynn Ferres*
a, Wolfgang Stahl
aand Ha Vinh Lam Nguyen
ba Institute of Physical Chemistry, RWTH Aachen University, Landoltweg 2, D-52074
Aachen, Germany
b Laboratoire Interuniversitaire des Systèmes Atmosphériques (LISA), CNRS UMR
7583, Université Paris-Est Créteil, Université Paris Diderot, 61 avenue du Général de Gaulle, F-94010 Créteil cedex, France
* Corresponding author: Lynn Ferres
The molecular structure of phenetole studied by microwave
spectroscopy and quantum chemical calculations
A pulsed molecular beam Fourier transform microwave spectrometer operating in the frequency range 2 26.5 GHz was used to measure the spectrum of phenetole (ethyl phenyl ether or ethoxybenzene, C6H5OC2H5). The conformational
landscape is completely determined by the orientations of the phenyl ring and the ethyl group. A two-dimensional potential energy surface was calculated at the MP2/6-311++G(d,p) level of theory. Two conformers were found: The trans conformer has a Cs symmetry, and the gauche conformer has the ethyl group tilted out of the phenyl plane by about 70°. Totally 186 rotational transitions were assigned to the more stable planar trans conformer, and fitted using a semi-rigid rotor model to measurement accuracy. Highly accurate rotational and centrifugal distortion constants were determined. Several method and basis set combinations were applied to check for convergence and to compare with the experimentally deduced molecular parameters.
Keywords: structure determination; rotational spectroscopy; phenyl ring
1. Introduction
Phenetole (C6H5OC2H5), also called ethyl phenyl ether or ethoxybenzene, is a colorless
liquid with typical aromatic smell, which is mainly used as a solvent or as a volatile liquid compound in heating rate counter of radiators.
The conformational landscape of phenetole is completely determined by the orientations of the phenyl ring and the ethyl group, because the phenyl ring structure is known to be planar [1]. In the literature, phenyl rings are sometimes reported to tilt out of the plane spanned by its neighboring heavy atoms due to sterical hindering, e.g. in the cases of N-phenylformamide [2] and phenylalanine [3]. On the other hand, they are located in the molecular plane in many molecules such as benzaldehyde [4],
acetophenone [5], and anisole [6]. In acetanilide, both structures with in-plane and out-of-plane phenyl ring can be observed in the experimental spectrum [7].
The most favorable orientation of the ethyl group is also not obvious. Whenever it is possible, we often assume for a molecule with unknown structure that the most stable conformer has a plane of symmetry, i.e. the ethyl group is located in the
molecular plane. This assumption is true in many molecules we studied before such as methyl propionate [8], ethyl methyl ketone [9], diethyl ketone [10], and diethyl amine [11]. On the other hand, we surprisingly observed for the most stable conformer of N-ethylacetamide [12], and N,N-diN-ethylacetamide [13] that the ethyl group(s) is tilted out of plane by an angle of about 70°.
It is an interesting question, whether the structure of phenetole shows a plane of symmetry or the phenyl group and/or the ethyl group are twisted out of the C-O-C plane. For structural determination, microwave spectroscopy is ideally suited. However, with nine heavy atoms and ten protons in phenetole, the traditional method using
isotopic substitutions turns out to be difficult. Another possibility is comparing the experimentally deduced molecular parameters with results from quantum chemical calculations. The combination of microwave spectroscopy and quantum chemistry was applied successfully in many of our previous studies [9,14,15].
The remainder of this paper is divided into sections dealing with: (2) the conformational landscape of phenetole obtained by quantum chemistry, (3) microwave spectroscopy with experimental details and spectral assignments, and (4) a brief discussion of our theoretical and experimental results.
2. Conformational landscape
By rotating the phenyl ring and the ethyl group, different starting geometries can be created. For a conformational analysis, a two-dimensional potential energy surface (PES) was calculated as a function of the dihedral angles = (C2,C3,O12,C13) and =
(C3,O12,C13,C16), which correspond to the rotation of the phenyl ring around the C3
-O12 bond and the ethyl group around the O12-C13 bond, respectively (for atom
numbering see Figure 1). These angles were varied in a grid of 10°, while all other geometry parameters were optimized at the MP2/6-311++G(d,p) level of theory using the GAUSSIAN program package [16]. This level of theory was chosen, since from our experience it is a sufficiently robust method for the purposes of this work [17,18].
To define the dihedral angle or = (A,B,C,D) we look from C along the CB bond onto B. If BCD spans the same plane as ABC, or is 180°. If the BCD plane is rotated counterclockwise against the ABC plane, or is positive, for a clockwise rotation of the BCD plane against the ABC plane, or is negative. With this definition, the geometries represented by (,), (,), (180+,), and (180,) have the same potential energy due to the C2v symmetry of the phenyl ring. Therefore,
only a quarter of the full PES calculations are needed. The calculated energies were parameterized using a two-dimensional Fourier expansion based on terms with the correct symmetry of the angles and . The corresponding coefficients are given in Table S-1 in the supplementary material. Using these Fourier coefficients, the PES was drawn as a contour plot depicted in Figure 2.
Two equivalent broad energy minima exist in the region centered at (,)= (0°,180°) and (180°,180°),correspond to a completely planar conformation. To study
this in detail, a one-dimensional energy plot along = 180° from = 0° to 360° was calculated and parameterized (Figure 3). The Fourier coefficients are available in Table S-2. Correspondingly, two minima can be found at = 0° and 180°, however, they are surprisingly narrow. On the other hand, the two equivalent maxima at about = 90° and 270° are extremely broad. The potential energy of about 626 cm1 of these two maxima represents the V2 torsional barrier of the phenyl ring.
Four other energy minima can be observed at (,) = (16.7°,70.9°),
(16.7°,70.9°), (196.7°,70.9°), and (163.3°,70.9°), which are all equivalent. From the Fourier coefficients of the PES given in Table S-1, we calculated a potential energy cut from = 0° to 360°, which connect the three minima at (163.3°,70.9°),
(180.0°,180.0°), and (196.7°,70.9°) as illustrated in Figure 4. The two equivalent minima at = ±70.92° correspond to an enantiomeric pair, where the ethyl group is tilted by 70° out of the frame plane. This is the same tilt angle as those found in N-ethylacetamide [12] and N,N-diN-ethylacetamide [13] mentioned in the introduction. The barrier between the trans and gauche conformations is approximately 883 cm1 (10.56 kJmol1), in the same order of magnitude to the barrier to internal rotation of the methyl group in anisole calculated at the same level of theory (735 cm1) [19].
The energy minima found on the PES were re-optimized under full geometry relaxation to two stable conformers (called trans and gauche) visualized in Figure 1. The trans conformer is completely planar. For the gauche conformer, we observed a combination (,) = (16.0°,70.0°), which is similar to the results from the PES given in Figure 2. It is surprising that the phenyl ring is twisted with a small angle against the ethyl group, probably due to its relatively low V2 torsional barrier of 626 cm1. The
conformer, which is in reasonable agreement with the results observed in Figure 4 (4.63 kJmol1). Therefore, we do not expect to observe the gauche conformer in our
microwave spectrum, where the rotational temperature is very low (about 2 K), and we only focus on the trans conformer for the experimental part. The calculated rotational constants of the trans conformer are A = 4837.4 MHz, B = 922.4 MHz, and C = 782.4 MHz. Noticeable is the high dipole moment component of 1.27 D in b-direction, which suggests a microwave spectrum with intense b-type transitions. The dipole moment component in a-direction is 0.69 D, i.e. a-type transitions are also present in the
spectrum. The dipole moment component in c-direction is zero, and therefore no c-type transitions are expected. We noticed that harmonic frequency calculations at the MP2/6-311++G(d,p) level yielded one imaginary vibrational mode, which is a bending
vibration of the phenyl ring. Stating stable planar ring systems as unstable is a well-known behavior found at this level of theory, which has been reported for benzene and arenes [20]. For the gauche conformer, the rotational constants are A = 3717.3 MHz, B = 1089.2 MHz, and C = 930.8 MHz; the dipole moment components μa = 0.83 D, μb =
1.32 D, and μc = 0.24 D. The atomic coordinates in the principal axis system for both
conformers are available in Table S-3 in the supplementary material.
Afterwards, several methods such as Møller-Plesset perturbation theory of second order (MP2), Hartree-Fock (HF), and density functional theory (DFT) in
combination with different basis sets were used to re-optimize the geometry of the trans conformer given in Figure 1 in order to check for convergence and to compare with the experimental rotational constants. The calculated rotational constants are summarized in Table S-4.
Finally, we calculated a potential energy curve for the, also at the MP2/6-311++G(d,p) level of theory, by varying the dihedral angle = methyl internal rotation (O12,C13,C16,H18) of the trans conformer, whereas all other parameters were allowed
to relax. Only a range of 0°-120° has to be considered due to the C3v symmetry of the
methyl group. Calculations were carried out at different angles within a grid of 10° and the data were parameterized with an expansion V = V0 + (V3/2)(cos 3) +
(V6/2)(cos 6). The offset V0 was determined to be –385.041897 Hartree, V3 is
1168 cm1, V6 is 42.5 cm1. The V6 contribution to the three-fold V3 potential is about
4%. The V3 barrier of 1168 cm1 is quite high. From our experience, no splittings or
only very small splittings due to methyl internal rotation can be observed for a barrier that high with the resolution of our spectrometer [19].
3. Microwave spectroscopy
3.1. Measurements
A broadband scan from 1014 GHz was measured using a molecular beam Fourier-transform microwave spectrometer operating in the range from 2 to 26.5 GHz [21]. Phenetole purchased from Sigma Aldrich, Eschborn, Germany with a stated purity of 99 % was used without any further purification. The substance was put on a pipe cleaner inserted in the helium inlet line. Under helium stream, the phenetole-helium mixture was expanded into the cavity. The scan indicated line positions, which were subsequently remeasured with higher resolution. All signals appeared as doublets due to the Doppler effect. The average value of the line widths is about 20 kHz, corresponding to a measurement accuracy of 2 kHz.
Helium is chosen as carrier gas because the rotational cooling might not be as effective as with neon or argon. Therefore, relatively high J values can still be observed with sufficient intensity, which is helpful to determine the centrifugal distortion constants. On the other hand, the relaxation of the gauche conformer into the trans conformer might not be as easy as by cooling with neon or argon.
3.2. Spectrum assignments
Using the calculated rotational constants of the trans conformer given in section 2, a theoretical spectrum of phenetole was predicted using the program XIAM [22] and compared to the experimental broadband scan mentioned in section 3.1. Although the dipole moment component in a-direction is calculated to be smaller than that in b-direction, the R-branch J = 6 ← 5 and 7 ← 6 a-type transitions are the most intense lines in the scan, which could be readily assigned on the basis of their characteristic pattern. Afterwards, b-type transitions in the scan could also be identified to complete the assignment. We used the rotational constants from this preliminary fit to predict the spectrum in the frequency range from 2 26.5 GHz, and measured the predicted transitions directly in the high resolution mode.
In total, 186 lines were fitted with only three rotational constants A, B, C and five quartic centrifugal distortion constants to a standard deviation of 2.3 kHz, close to the measurement accuracy of 2 kHz. The molecular parameters are summarized in Table 1. A list of all fitted transitions is given in Table S-5 in the supplementary
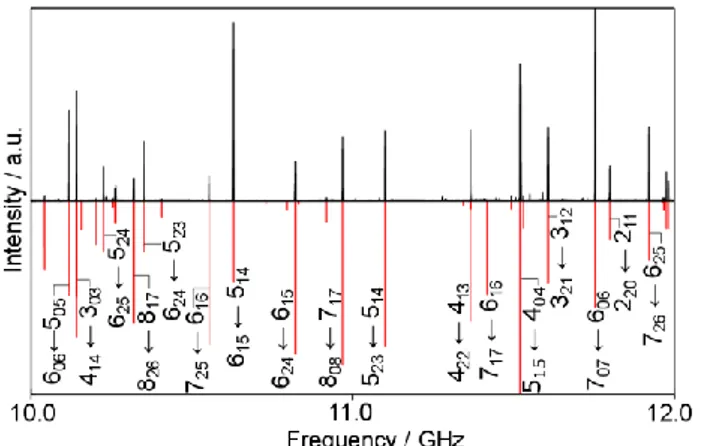
material. A comparison of the experimental and fitted spectra can be found in Figure 5, where the most intense transitions are marked by their respective quantum numbers.
4. Discussion
We measured and assigned the microwave spectrum of phenetole in a supersonic jet. From the experimental data, we determined the rotational and centrifugal distortion constants. The experimental parameters were compared to those obtained by quantum chemistry. Using the MP2/6-311++G(d,p) level of theory, the calculated B and C rotational constants of the trans conformer are almost in exact agreement with the experimental values. The A rotational constant shows a somewhat larger deviation of 18 MHz (0.4 %). However, it should be mentioned that the calculated rotational constants refer to the equilibrium internuclear distances, whereas the experimental constants are effective constants averaged by the zero point vibration. Therefore, an agreement of better than 1 % is not expected. The inertial defect of the observed conformer
c = (Ic Ia Ib) = 6.718 uÅ2 confirms that the heavy atom skeleton is planar with two
pairs of hydrogen atoms out of plane. This inertial defect is almost the same as those found in other trans conformers of planar molecules containing an ethyl group, e.g.
trans ethyl formate (c = 6.514 uÅ2) [23] and trans ethyl nitrate (c = 6.503 uÅ2)
[24].
All lines in the broadband scan could be assigned to the trans conformer, which confirms that the gauche conformer cannot be observed under our measurement
conditions. In agreement with the rather high torsional barrier of the methyl group (V3 =
1168 cm1) calculated by quantum chemical methods, all assigned lines appeared sharp and no signs of splittings were observed for the methyl internal rotation.
Harmonic frequency calculations show that the MP2 method in combination with the 6-311+G(d,p), 6-311++G(d,p), and 6-311++G(df,pd) basis sets yields one imaginary vibrational mode, which is a bending vibration of the phenyl ring (see section
2). This behavior does not occur in all other combinations listed in Table S-4. The rotational constants calculated at the MP2/6-31G(d,p) level of theory match the
experimental values best, following by calculations at the MP2/6-311G++(3d,3p) level. Other basis sets combined with the MP2 and B3LYP method overestimate the A
rotational constants. The A rotational constants calculated with the HF method are even worse with deviations of more than 100 MHz larger than the experimental value. However, since the calculated constants refer to the equilibrium structure, whereas the experimental constants are effective constants, the accurately calculated values at the MP2/6-31G(d,p) level are probably due to error compensations. This level of theory yields also reasonable agreement between the calculated and the experimental results in the case of anisole. No statement is available for the question whether these error compensations appear in general for other molecular systems similar to phenetole. Acknowledgements
We thank the Land Nordrhein-Westfalen and the Université Paris-Est Créteil for funds as well as the IT Center of the RWTH Aachen University for free computer time.
References
[1] J. March, Advanced Organic Chemistry, 4th Ed., J. Wiley and Sons (New York, 1992).
[2] J.-R.A. Moreno, D. Petitprez and T.R. Huet, Chem. Phys. Lett. 419, 411 (2006). [3] C. Pérez, S. Mata, S. Blanco, J.C. López and J.L. Alonso, J. Phys. Chem. A 115, 9653 (2011).
[4] R.K. Kakar, E.A. Rinehart, C.R. Quade and T. Kojima, J. Chem. Phys. 52, 3803 (1970).
[5] M. Onda, Y. Kohama, K. Suga and I. Yamaguchi, J. Mol. Struct. 442, 19 (1998). [6] M. Onda, A. Toda, S. Mori and I. Yamaguchi, J. Mol. Struct. 144, 47 (1986).
[7] C. Cabezas, M. Varela, W. Caminati, S. Mata, J.C. López and J.L. Alonso, J. Mol. Spectrosc. 268, 42 (2011).
[8] H.V.L. Nguyen, W. Stahl and I. Kleiner, Mol. Phys. 110, 2035 (2012).
[9] H.V.L. Nguyen, V. Van, W. Stahl and I. Kleiner, J. Chem. Phys. 140, 214303 (2014).
[10] H.V.L. Nguyen and W. Stahl, ChemPhysChem. 12, 1900-1905 (2011). [11] H.V.L. Nguyen and W. Stahl, J. Chem. Phys. 135, 024310 (2011).
[12] R. Kannengießer, M.J. Lach, W. Stahl and H.V.L. Nguyen, ChemPhysChem. 16, 1906 (2015).
[13] R. Kannengießer, S. Klahm, H.V.L. Nguyen, A. Lüchow and W. Stahl, J. Chem. Phys. 141, 204308 (2014).
[14] V. Van, W. Stahl and H.V.L. Nguyen, Phys. Chem. Chem. Phys. 17, 32111 (2015). [15] H.V.L. Nguyen, H. Mouhib, S. Klahm, W. Stahl and I. Kleiner, Phys. Chem. Chem. Phys. 15, 10012 (2013).
[16] M.J. Frisch, G.W. Trucks, H.B. Schlegel, G.E. Scuseria, M.A. Robb, J.R. Cheeseman, G. Scalmani, V. Barone, B. Mennucci, G.A. Petersson, H. Nakatsuji, M. Caricato, X. Li, H.P. Hratchian, A.F. Izmaylov, J. Bloino, G. Zheng, J.L. Sonnenberg, M. Hada, M. Ehara, K. Toyota, R. Fukuda, J. Hasegawa, M. Ishida, T. Nakajima, Y. Honda, O. Kitao, H. Nakai, T. Vreven, J.A. Montgomery, Jr., J.E. Peralta, F. Ogliaro, M. Bearpark, J.J. Heyd, E. Brothers, K.N. Kudin, V.N. Staroverov, R. Kobayashi, J. Normand, K. Raghavachari, A. Rendell, J.C. Burant, S.S. Iyengar, J. Tomasi, M. Cossi, N. Rega, J.M. Millam, M. Klene, J.E. Knox, J.B. Cross, V. Bakken, C. Adamo, J. Jaramillo, R. Gomperts, R.E. Stratmann, O. Yazyev, A.J. Austin, R. Cammi, C. Pomelli, J.W. Ochterski, R.L. Martin, K. Morokuma, V.G. Zakrzewski, G.A. Voth, P. Salvador, J.J. Dannenberg, S. Dapprich, A.D. Daniels, O. Farkas, J.B. Foresman, J.V. Ortiz, J. Cioslowski and D.J. Fox, Gaussian 09, Revision A.02, Gaussian, Inc.,
Wallingford CT, 2009.
[17] V. Van, C. Dindic, H.V.L. Nguyen and W. Stahl, ChemPhysChem. 16, 291 (2015). [18] Y. Zhao, W. Stahl and H.V.L. Nguyen, Chem. Phys. Lett. 545, 9 (2012).
[19] S. Tsuzuki, H. Houjou, Y. Nagawa and K. Hiratani,J. Phys. Chem. A 104, 1332 (2000).
[20] D. Moran, A.C. Simmonett, F.E. Leach, W.D. Allen, P.v.R. Schleyer and H.F. Schaefer, J. Am. Chem. Soc. 128, 9342 (2006).
[21] J.-U. Grabow, W. Stahl and H. Dreizler, Rev. Sci. Instrum. 67, 4072 (1996). [22] H. Hartwig and H. Dreizler, Z. Naturforsch 51a, 923 (1996).
[23] J.M. Riveros and E.B. Wilson, J. Chem. Phys. 46, 4605 (1967).
Tables
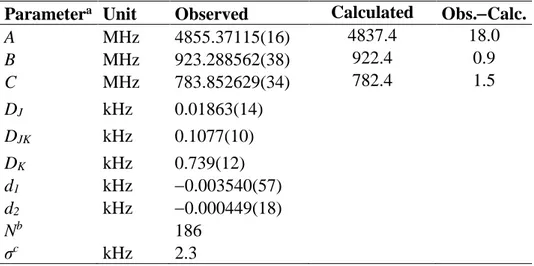
Table 1. Molecular parameters of phenetole obtained by the program XIAM.
Parametera Unit Observed Calculated Obs.Calc.
A MHz 4855.37115(16) 4837.4 18.0 B MHz 923.288562(38) 922.4 0.9 C MHz 783.852629(34) 782.4 1.5 DJ kHz 0.01863(14) DJK kHz 0.1077(10) DK kHz 0.739(12) d1 kHz 0.003540(57) d2 kHz 0.000449(18) Nb 186 σc kHz 2.3
a All parameters refer to the principal axis system.Watson’s S reduction and Ir
representation were used. b Number of lines. c Standard deviation of the fit.
Figures
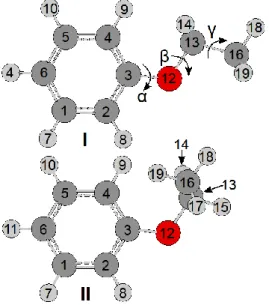
Figure 1. Molecular geometries of the trans (I) and gauche (II) conformers of phenetole optimized at the MP2/6-311++G(d,p) level of theory. The trans conformer has a Cs
symmetry; the gauche conformer has the ethyl group tilted out of the frame plane by 70.0°, and is about 4.11 kJmol1 higher in energy than the trans conformer. The dihedral angles = ( C2,C3,O12,C13), = (C3,O12,C13,C16), and =
(O12,C13,C16,H18) correspond to a rotation of the phenyl ring around the C3-O12 bond,
the ethyl group around the O12-C13 bond, and the internal rotation of the methyl group,
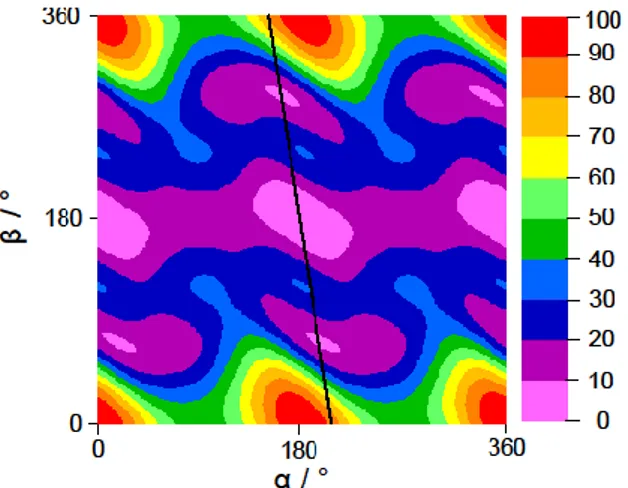
Figure 2. The potential energy surface of phenetole calculated at the
MP2/6-311++G(d,p) level of theory obtained by rotating the phenyl ring and the ethyl group. The dihedral angles and are defined as in Figure 1. The numbers in the colour code indicate the energy (in percent) relative to the energetic minimum Emin = 385.0444525
Hartree (0 %) and the energetic maximum Emax = 385.02509670 Hartree (100 %). The
black line indicates a potential energy cut, which will be illustrated later in Figure 4.
Figure 3. The potential energy curve corresponding to a rotation of the phenyl ring around the C3-O12 bond at a start value of 180° for . The dihedral angle α is varied in a
grid of 10°. Energy values relative to the energetically lowest conformation with Emin =
Figure 4. A potential energy cut from = 0° to 360° calculated using the Fourier coefficients of the PES in Figure 2, which connect the three minima at (163.3°,70.9°), (180.0°,180.0°), and (196.7°,70.9°). The energy path is shown as a line on the PES in Figure 2. The β-dependence of α is given asα = 0.153β + 207.541.The equivalent
gauche conformers at β = ±70.9° are about 387 cm1 (4.63 kJmol1) higher in energy than the trans conformer at β = 180°. The barrier between the trans and gauche conformer is approximately 883 cm1 (10.56 kJmol1).
Figure 5. A section from 10 12 GHz of the broadband scan (upper trace) of phenetole compared to the theoretical spectrum reproduced with the program XIAM (lower trace) using the molecular parameters given in Table 1. The most intense transitions are marked by their respective quantum numbers J Ka Kc J Ka Kc.