HAL Id: hal-02565435
https://hal.archives-ouvertes.fr/hal-02565435
Submitted on 6 May 2020HAL is a multi-disciplinary open access archive for the deposit and dissemination of sci-entific research documents, whether they are pub-lished or not. The documents may come from teaching and research institutions in France or abroad, or from public or private research centers.
L’archive ouverte pluridisciplinaire HAL, est destinée au dépôt et à la diffusion de documents scientifiques de niveau recherche, publiés ou non, émanant des établissements d’enseignement et de recherche français ou étrangers, des laboratoires publics ou privés.
Effect of natural organic matter on thallium and silver
speciation
Loïc Martin, Caroline Simonucci, Sétareh Rad, Marc F. Benedetti
To cite this version:
Loïc Martin, Caroline Simonucci, Sétareh Rad, Marc F. Benedetti. Effect of natural organic matter on thallium and silver speciation. Journal of Environmental Sciences, Elsevier, 2020, 93, pp.185-192. �10.1016/j.jes.2020.04.001�. �hal-02565435�
Effect of natural organic matter on thallium and silver speciation
Loïc A. Martin1,2, Caroline Simonucci2, Sétareh Rad3, and Marc F. Benedetti1*
1Université de Paris, Institut de physique du globe de Paris, CNRS, F-75005 Paris, France.
2IRSN, PSE-ENV/SIRSE/LER-Nord, BP 17, 92262 Fontenay-aux-Roses Cedex, France
3BRGM, Unité de Géomicrobiologie et Monitoring environnemental 45060 Orléans Cedex 2, France.
*Corresponding authors. Email address: benedetti@ipgp.fr Ti le Page ( i h A hor De ails)
Effect of natural organic matter on thallium and silver speciation 23
24
Loïc A. Martin1,2,3, Caroline Simonucci2, Sétareh Rad4, and Marc F. Benedetti1*
25 26 1. U i e i e de Pa i I i de h i e d gl be de Pa i CNRS UMR 7154, F-75238 27 Paris, France 28
2. IRSN, PSE-ENV/SIRSE/LER-Nord, BP 17, 92262 Fontenay-aux-Roses Cedex, France 29
3. Catchment and Eco-Hydrology Research Group, Luxembourg Institute of Science and
30
Technology, L-4422, Belvaux, Luxembourg
31
4. BRGM, Unité de Géomicrobiologie et Monitoring environnemental 45060 Orléans Cedex 2, 32
France 33
34
Abstract: Natural organic matter (NOM) is known to play an important role in the transport and 35
binding of trace metal elements in aquatic and soil systems. Thallium is a pollutant for which the 36
extent of the role played by NOM is poorly known. Consequently, this study investigates thallium(I) 37
and its complexation to a purified humic substance as proxy for NOM. Experiments were performed 38
with the Donnan Membrane Technique to separate, for the first time, the free Tl+ ion from its
39
complexed form in the bulk solution. Various pH and concentrations were investigated at constant 40
ionic strength and constant NOM proxy concentrations in solution. Experimental results were 41
described with NICA-Donnan model. Thallium complexation was compared to silver complexation 42
using literature data and using the same NICA-Donnan formalism. Parameters for these two cations
43
(Tl+ and Ag+) are reported in this article, for the first time. Results display low thallium complexation
44
to the NOM proxy while silver competes with divalent cations for the NOM binding sites. Calculated 45
speciation for dissolved thallium highlights the dominance of free thallium (Tl+) in solution whereas
46
Tl-NOM complexes contribute roughly 15 % to total Tl(I) species in river and lake type waters. 47
Similar results are obtained for soil solutions, Tl-bound to NOM < 30 % of total, from UK soils with 48
different land use and geochemistry. 49 Keywords: 50 Thallium 51 Organic matter 52 Speciation 53 NICA-Donnan model 54 Soil 55
Water 56
57
--- 58
*Corresponding authors. Email address: benedetti@ipgp.fr 59
60
Introduction 61
Thallium (Tl) is a trace element and a contaminant, mainly byproducts of extractives industries 62
and comes from ferrous and non-ferrous metal and coal mining (Cheam, 2001; Lis et al., 2003; 63
Peter and Viraraghavan, 2005; Casiot, et al., 2011; Campanella et al., 2017). Thallium occurs 64
in two oxidation states, Tl(I) and Tl(III) (Jacobson et al., 2005a; Peter and Viraraghavan, 2005). 65
Tl(I) exhibits either lithophile or chalcophile behavior that is determined by the geological 66
context (Prytulak et al., 2017). In the critical zone, Tl(I) is relatively soluble, mobile and 67
bioavailable (Jacobson et al., 2005a; Coup and Swedlund, 2015; Voegelin et al., 2015). Studies 68
demonstrated that Tl(I) is the most dominant and thermodynamically stable form in aquatic 69
systems and soils (Vink, 1993; Xiong, 2009; Casiot, et al., 2011). However, in some 70
environments Tl(III) is also found in variable amounts (Lin and Nriagu, 1999; Peacock and 71
Moon, 2012; Voegelin et al., 2015; Campanella et al., 2017). Tl(III) should be found mostly in 72
highly oxidative environments (Vink, 1993; Watanabe and Takahashi, 2015) but photochemical 73
reactions in surface waters (Karlsson et al., 2006) or microbiological processes(Twining et al., 74
2003) could oxidize Tl(I) into Tl(III) under moderately oxidizing conditions. Stabilization by 75
humic substances was also witnessed at low pH and high redox potential values (i.e. pH< 4 Eh > 76
0.82 V in Watanabe and Takahashi, (2015)). Recent studies also highlighted the possible role 77
of Fe(III) or As(V) in the formation of Tl(III) compounds in acid mining drainage (Karlsson et 78
al., 2006; Campanella et al., 2018). 79
Processes driving Tl chemical speciation and mobility are well documented but some questions 80
remain open (Twining et al., 2003; Karlsson et al.,2006; Coup and Swedlund, 2015; Voegelin 81
et al., 2015; Casiot et al., 2017; Campanella et al., 2017; Campanella et al., 2018). Its interaction 82
with natural organic matter (NOM) is one of them (Jacobson et al., 2005a; Liu et al., 2011). It 83
is known that NOM plays an important part in the fate of metal ions and can control ion mobility, 84
concentration in soils and natural waters (Benedetti et al., 1995; Benedetti et al., 1996a). NOM 85
is a complex mixture of compounds but the most studied and the most reactive fractions are the 86
humic substances (HS) consisting of humic (HA) and fulvic (FA) acids (Benedetti et al., 1996a; 87
Koopal et al., 2005). Kaplan and Mattigod (1998) defined two stability constants for Tl(I) 88
binding onto FA with logKTl-Ful1 = 4.83 and logKTl-Ful2 = 3.32 (no units specified) to predict the
impact of NOM on thallium speciation. According to these calculations up to 67% of Tl(I) is 90
bound to organic compounds in bog water despite its very low pH that should not favor Tl(I) 91
binding to NOM (Kaplan and Mattigod, 1998).Thus, NOM could play a non-negligible part in 92
Tl(I) speciation. However, Jacobson et al., (2005a) reported poor Tl(I) complexation within a 93
peat soil. Liu et al. (2011) also studied Tl(I) binding using two purified humic acids and their 94
results also suggested weak Tl(I) interactions with these NOM proxies. However, these studies 95
used very high Tl(I) concentrations, which are mostly relevant for highly polluted sites (i.e. 96
issued from mining activities (Campanella et al., 2017; Casiot et al., 2017)). Investigations made 97
at lower concentration of Tl(I) will allow a better understanding of NOM role on Tl(I) speciation 98
in the critical zone. It is also assumed that Tl(I) chalcophile behavior accounts for Tl(I) 99
complexation to NOM through interactions with the S-rich functional groups of the NOM, such 100
as thiols (Jacobson et al., 2005a, 2005b). However, Tl(I) affinity to sulfur-containing organic 101
compounds, such as cysteine for instance, is still under investigation while no data were found 102
regarding thiol (Garcia Bugarin et al., 1989; Gharib and Shamel, 2009; Rodrigez Mercado et 103
al., 2013) 104
The role of S-rich compounds, such as thiol groups, is often raised when metal complexation 105
to humic substances (HS) is studied (Skylberg et al., 2006; Aiken et al., 2011) and there are 106
evidences of S-binding for Hg(II) or As(III) (Haitzer et al., 2002; Skylberg et al., 2006; Aiken 107
et al., 2011; Catrouillet et al., 2015). These divalent or trivalent cations cannot really be
108
compared to Tl(I). Whereas silver, as Ag(I), can (Jacobson et al., 2005a , 2005b), both Ag(I)
109
and Tl(I) are soft, non-essential monovalent cations, (Smith et al., 2002; Pearson, 1968) with
110
both chalcophilic and lithophilic behaviors (Pearson, 1968; Jacobson et al., 2005a, 2005b;
111
Aiken et al., 2011). Moreover, Ag(I) has high affinity for thiolate (Smith et al., 2002; Kleja et
112
al., 2016) and Ag-S binding in NOM compounds was already mentioned in a previous study 113
(Kleja et al., 2016). Another remaining question is the abundance of S-rich functional group, 114
especially thiol group, and how to quantify it in NOM (Valravamurthyet al., 1997; Aiken et al., 115
2011; Manceau and Nagy, 2012; Rao et al., 2014). 116
In this study, the main objective is to evaluate the importance and strength of Tl complexation 117
by a NOM proxy. In order to do that, complexation of Tl(I) with a purified humic acid (HA) is 118
investigated at multiple pH and concentrations. Experimentations are conducted with Donnan 119
Membrane Technique (Temminghoff et al., 2000) to determine the amount of ion bound to the 120
NOM proxy. These observations are used to calibrate the NICADonnan model to predict Tl(I) 121
behavior during complexation. In addition, Tl(I) results are compared to Ag(I) literature data 122
(Sikora and Stevenson, 1988) and the potential role of S-rich functional groups is discussed. 123
Ag(I) specific parameters for NICA-Donnan model are not yet available, thus data of Ag(I) 124
sorption to various HA is described with NICA-Donnan model for the first time in this study 125
(Sikora and Stevenson, 1988; Chen et al., 2012; Kleja et al. 2016). Finally, the role of NOM 126
Tl(I) cycle is also investigated by revisiting existing data from natural waters (Kaplan and 127
Mattigod, 1998) and simulating Tl(I) speciation in soil solutions under different geochemical 128
contexts. 129
130
1 Materials and methods 131
1.1 Experimental approach 132
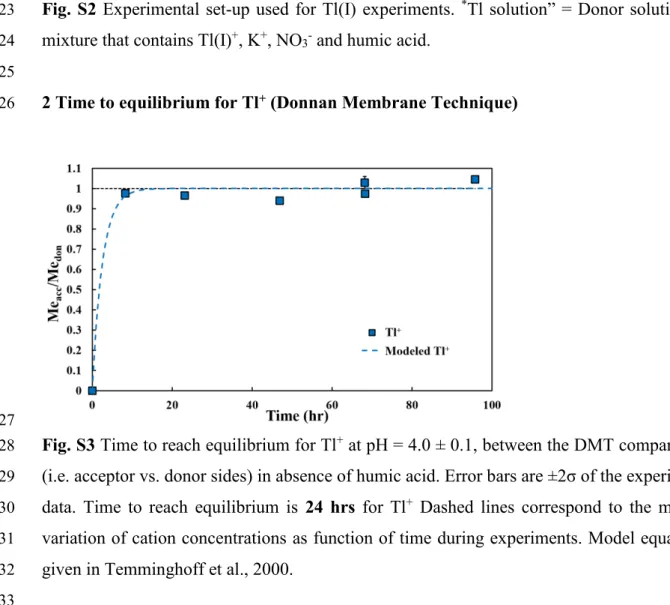
Donnan Membrane Technique (DMT) was first described by Temminghoff et al. (2000). 133
Additional developments were performed to fully constrain the kinetics aspect of the technique 134
(Weng et al., 2005) and to adapt the geometry of the cells (Kalis et al., 2006; Kalis et al., 2007). 135
In this study, the DMT device, used for the experiments, is similar to the one used in Kalis et 136
al. (2006, 2007) and its design shown in Appendix A (Fig. S1). Prior to experiments with humic 137
acids, the time to reach Donnan equilibrium for Tl(I) was evaluated. Experiments with only free 138
Tl(I) ions in a 50 mmol/L KNO3 background electrolyte were performed and showed that
139
equilibrium was reached after 24 hr (Appendix A, Fig. S3). 140
141
1.2 Reagents and chemicals 142
In order to have Tl(I) at the beginning of all experiments, the source of thallium is a Tl(I)NO3
143
salt (99.9%, Sigma Aldrich). Tl(I) should be the only stable thallium species under our 144
experimental conditions (Vink, 1993; Xiong, 2009; Campanella et al., 2017; Casiot et al., 2017). 145
Tl(I) oxidation to Tl(III) happens in highly acidic conditions or on mineral surfaces which 146
stabilize Tl(III), either on vacant sites or as oxides like Tl2O3 (Watanabe and Takahashi, 2015;
147
Campanella et al., 2017; Prytulack et al., 2017). Consequently, free Tl(III) should not be present 148
in our solutions because of the chosen conditions i.e. pH > 4 and moderate Eh. Background 149
electrolyte solutions were prepared with KNO3 (VWR Chemical) and Ca(NO3)2 (VWR
150
Chemical) dissolved in ultrapure water (milli Q, Millipore). pH was adjusted with distilled 0.1 151
mol/L HNO3 and 0.5 mol/L NaOH (VWR Chemical). A peat purified humic acid from the Mogi
152
river region of Ribeirão Preto, São Paulo State, Brazil was used in all experiments. Detailed of 153
purification procedures and chemical compositions are described in Botero et al. (2017). 154
Thalium calibration standards were diluted from a thallium ICP standard solution (TraceCERT®,
155
Sigma Aldrich). Chemical blanks were analyzed with HR-ICP-MS Element 2 (Thermo 156
Scientific) and no thallium was detected. 157
158
1.3 Tl isotherms. 159
Experiments were performed at room temperature (23 ± 1°C) open to atmosphere with a unique 160
concentration of soluble HA. Previous studies reported low Tl(I) complexation to humic acid
161
(Jacobson et al., 2005; Liu et al., 2011). Then, 150 mg/L was used during experiments (pH and
162
concentration isotherms) to maximize Tl complexation to humic acid and to derive
NICA-163
Donnan parameters for Tl+. The effects of Tl(I) concentration and pH were tested. For sorption
164
edge experiments pH ranged from 3.98 to 7.89 ± 0.05 and the total Tl(I) initial concentration 165
was 200 pmol/L. In the case of concentration isotherms, the pH was fixed at 7.35 ± 0.05 and 166
initial concentrations ranged from 20 pmol/L to 2.0 µmol/L. The use of this range of
167
concentrations was reported for Tl in the literature for freshwater (pristine and polluted). 20
168
pmol/L correspond to Tl concentration in most of the world big rivers (Kaplan and Mattigod,
169
1998; Nielsen et al., 2005) and 2.0 µmol/L is close to the highest Tl values measured in polluted
170
rivers in mining areas (Casiot et al., 2011; Campanella et al., 2017). The background electrolyte
171
in the donor and acceptor sides was KNO3 50 mmol/L. DMT were run in duplicates for each
172
experimental data point. 173
Prior to isotherm experiments, all cells, bottles and beakers used for the donor solution were 174
washed with Suprapur HNO3 (Merck) 2% and ultrapure water (milliQ). The cation exchange
175
membrane (551652U, VWR Chemicals) was prepared by successive washing as in previous 176
studies (Temminghoff et al., 2000; Weng et al., 2005; Kalis et al., 2006; Chen et al., 2012). At 177
each pH or concentration steps, two new DMT cells were added in the donor solution whereas 178
the two at equilibrium with the solution conditions were removed from the later and both 179
acceptor and donor solutions were sampled. The donor solution corresponded to the sample 180
with Tl(I) ions, HA and the background electrolyte while the acceptor solution was the one 181
inside the DMT device and contained the electrolyte and also the free Tl(I) ions after the Donnan 182
equilibrium was reached in 24 hr (Appendix A, Fig. S3). Preliminary modeling suggested that 183
only free Tl(I) ions were stable in the acceptor solution (Appendix A, Table S1). Every 184
dissolved species in solution were sum up in Appendix A (Table S2). For more details on the 185
experimental design readers are invited to refer to supporting information (Appendix A, Fig. S1 186
and S2). Finally, collected samples were acidified to pH~1 with distilled HNO3 2%, diluted
187
when necessary and stored for further analysis. 188
189
1.4 Measurements of cations in solution. 190
Thallium was measured with an HR-ICP-MS Element 2 (Thermo scientific, USA) installed in 191
a clean room with a solution of 115In (5 ppb) as internal standard. For each sample, 9
192
measurements were done (3 x 3 runs, Appendix A, Table S3). Then, the average was used as 193
concentration value and the standard deviation was used as measurement error. Concentrations 194
were corrected from signal drift with the internal standard. Certified materials TM23.4 and 195
TM24.4 (Environment Canada) validated Tl(I) analysis (Appendix A, Table S4). Limits of 196
quantification (LOQ) ranged from 2.5 pmol/L to 7.5 pmol/L for Tl(I). Major cations (K+ and
197
Na+) were analyzed with an ICP-AES (ICAP 6200, Thermo scientific, USA). More details of
198
HR-ICP-MS measurement for thallium can be found in Appendix A (Table S3). 199
200
1.5 Modeling. 201
This experimental approach was combined with NICA-Donnan modeling within ECOSAT 202
software (Keiser and Van Riemsdijk, 1994). Here, metal ions binding to humic substances (HS, 203
mix of humic and fulvic acids) was assumed to occur through specific interactions between 204
cations and reactive organic moieties of the NOM and by nonspecific Coulombic binding to 205
any residual negative charge (Benedetti et al., 1995; Benedetti et al., 1996a) The model merges 206
the Non-ideal Competitive Adsorption (NICA) isotherm model with the Donnan model. The 207
first (NICA isotherm) describes competitive binding of protons and cations to NOM including 208
binding site heterogeneity and the second (Donnan model) details the electrostatic interactions 209
within the structure of humic substances considered as a water-permeable gel (Benedetti et al., 210
1996a; Benedetti et al., 1996b) The model accounts for binding site heterogeneity by including 211
two different groups of binding sites each with a continuous affinity distribution: type 1 and 2, 212
corresponding to low affinity and high affinity sites, respectively (Benedetti et al., 1995). The 213
model equation is (Eq. 1): 214 Q = , , Q , 𝐾, , ∑ 𝐾, , ∑ 𝐾, , + ∑ 𝐾, , + , , Q , 𝐾, , ∑ 𝐾, , ∑ 𝐾, , + ∑ 𝐾, , 215 (1) 216
where the amount of bound ion i, Qi (mol/kg) at solution concentration ci (mol/L) is given by 217
the sum of two identical binding expressions, the first one for low affinity type of site (subscript 218
1) and the second one for high affinity type of site (subscript 2) distributions. Four parameters 219
describe intrinsic heterogeneity of HS (Qmax1,H, Qmax2,H, p1 and p2) and four ion specific
220
parameters (𝐾, , 𝐾, , ni,1 and ni,2) portray ion binding. p1 and p2 define the width of the affinity
221
distributions and condense the intrinsic heterogeneity of HS. Qmax1,H and Qmax2,H (mol/kg) are
the maximum proton binding capacity of HS. 𝐾, and 𝐾, , are the median values of the affinity 223
distributions for ion i, and ni,1 and ni,2 express the non-idealities of the ion-binding for each 224
distribution. For further NICA-Donnan theory, the reader has to refer to the following studies 225
(Benedetti et al., 1995; Benedetti et al., 1996a and b; Kinniburgh et al., 1996; Milne et al., 2001; 226
Koopal et al., 2005; Milne et al., 2003). 227
Input data were total concentrations of K and Tl, or Ag in solution, pH and ionic strength. 228
Tl and K (𝐾, , 𝐾, , ni,1 and ni,2) were adjust together by fitting Tl experimental data from
229
concentration isotherms only. Parameters specific to the used purified humic acid and proton 230
binding were from Botero et al. (2017) and summarized in Appendix A (Table S5). 231
Experimental errors were calculated according to the propagation of uncertainties theory 232
(details in Appendix A, Eq. 1) while Root Mean Square Error (RMSE, Appendix A, S-Eq. 2) was 233
used to estimate the gap between experimental and modelled data. In multiple studies 234
assumptions were made of similar behaviour between K and Tl(I) (Jacobson et al., 2005; Peter 235
and Viraraghavann 2005; Voegelin et al., 2015). While no specific parameters existed for K and 236
no isotherm for K were made, two modelling hypothesis were tested: (i) equal ion specific 237
parameters for both Tl(I) and K (i.e. 𝐾, , 𝐾, , ni,1 and ni,2) are chosen; (ii) two different sets of 238
parameters specific to each element are considered. K parameters will be discussed in paragraph 239
2.1. and values for K parameters for which the fit was the closest to the experimental data were 240
kept to model Ag and Tl final data (reader has to refer to Appendix A, Fig. S4 for more details). 241
242
1.6 Ag NICA-Donnan parameter derivation. 243
No experimental data were newly acquired for Ag in this study, previously published data from 244
Sikora and Stevenson (1988) were used and only Ag(I) NICA-Donnan parameters were 245
optimized. Sikora and Stevenson (1988) used three purified humic acids in their experiments, 246
HA1 from a A horizon taken from sandy silt loam, HA3 from Rifle peat, Ohio and HA8 from a 247
A horizon sample from the Hapster silt loam (Sikora and Stevenson, 1988). Binding isotherms 248
constructed at pH 6.5 with 0.1 mol/L KNO3 and 0.5 g/L of humic acid (Sikora and Stevenson,
249
1988). Ag specific parameters were adjust to fit experimental data. Qmax1, H for HA1, HA3 and
250
HA8 were directly taken from Sikora and Stevenson (1988) while the remaining specific 251
parameters for protons (Qmax2,H, p1, p2, log𝐾 , , log𝐾 , ,) were optimized during modeling and
252
kept within the range of parameters defined for humic acids in Milne et al., (2001). Details are 253
summarized in Appendix A (Table S6). 254
2 Results and discussion 256
2.1 Tl(I) and Ag(I) complexation with humic acids. 257
Specific parameters fitted for K, Ag and Tl are given in Table 1. The hypothesis where K(I) 258
parameters are different from Tl(I) parameters gave the best description of the complexation of 259
Tl(I) by the HA. 260
Thallium complexation to HA increases with increasing concentrations (Fig. 1a). However, the 261
amount of complexed Tl(I) is low and always below 50% of the total thallium in solution. Ion 262
specific NICA-Donnan parameters were adjusted to fit Tl(I) concentration isotherm values (Fig. 263
1a). Then, the robustness of the model parameters was tested by comparing measured free Tl(I) 264
to predicted free Tl(I) obtained from sorption edge and fixed pH isotherm experiments (Fig. 1b) 265
not used during the calibration procedure. Fig. 1b also shows that the predictions were 266
satisfactory for the pH sorption edge data (i.e. within a 5% confidence area) notwithstanding 267
the parameter s optimization made with data corresponding to one pH value (7.35 ± 0.05). 268
Similar conclusions are reached when comparing measured Tl(I) to simulated bound-269
Tl(I) (Fig. 1c). The slope of the concentration isotherm (Fig. 1a), close to one (i.e. 0.86), 270
suggests that Langmuirian behaviour dominates the process and that monodentate binding 271
controls Tl(I) sorption onto HA (Koopal et al., 1994). This is confirmed by model parameters 272
since non-ideality parameters partly related to the type of binding (mono vs polydentate) (ni,1
273
and ni,2,Benedetti et al., 1995; Benedetti et al., 1996a) optimized for Tl(I) are close to 1 (Table
274
1). Additional data for Tl(I) are presented in Appendix A (Table S7). 275
Fig. 2 displays Ag(I) modelling results whereas optimized Ag(I) specific parameters are given 276
in Table 1. For Ag(I), non-ideality parameters were substantially different from 1, suggesting 277
more chemical ion specific binding heterogeneity as defined in NICA-Donnan papers (see
278
above for references) during the complexation of Ag(I) when compared to Tl(I). Indeed at pH
279
below 5, the small amount of bound-Tl(I) is controlled by low affinity type of sites. At pH > 5 280
and independently of thallium concentrations, high affinity sites dominate the binding, 281
accounting for more than 65 % of total bound-Tl(I). These results derive from the high values 282
found for the median affinity constant associated to the high affinity sites (Table 1). At low pH, 283
15% of total bound-Tl(I) is located in the Donnan gel via Coulombic interactions. In Sikora s 284
study (Sikora and Stevenson, 1988) with pH = 6.5, Ag(I) is almost exclusively bound to high 285
affinity sites and only a small amount is bound to low affinity sites or are in the Donnan gel (i.e. 286
less than 5% of total bound silver). Ag(I) binding to humic acid is strongly controlled by high 287
affinity sites conversely to Tl(I) and the amount of Ag(I) bound is also much higher (Fig. 3). 288
Ag has a higher affinity for organic matter than Tl(I) and its mobility is strongly influenced by 289
this type of ligand (Sikora and Stevenson, 1988; Jacobson et al., 2005a). Fig. 3 also suggests 290
that Ag(I) could compete with divalent cations for binding to NOM reactive sites. The pH-291
dependency of Ag complexation is smaller than the one of divalent ions. At neutral pH, Ag may 292
compete with cobalt for instance (Fig. 3) and at acidic pH, Ag(I) has more affinity for NOM 293
proxies than Co2+, Mn2+ and Cd2+ (Fig. 3).
294 295
2.2 The S-rich functional groups. 296
Two recent studies evaluated the thiol group concentration in natural organic matter (NOM;
297
Rao et al., 2014) calculated a concentration of 0.7 µmol/g for Suwanee River NOM and 3.6
298
µmol/g for a soil HA. Joe-Wong et al., (2012) estimated thiol group concentration at 535 µmol/g 299
of dissolved organic matter (DOM). Regardless of the huge discrepancy between these three 300
numbers, in our experiments, the amount of bound Tl(I) at pH 7.35 varied from 68.4 pmol/g of 301
HA to 2.57 µmol/g of HA for the lowest and highest total Tl concentration, respectively. In 302
Sikora s data, (Sikora and Stevenson, 1988) bound silver ranges between 87 µmol/g and 920 303
µmol/g of HA. The amounts of bound Tl(I) and Ag(I) are lower than the range of thiol group 304
concentration. Ag(I) has a high affinity for thiolate (Smith et al., 2002; Kleja et al. 2016) and 305
since Ag-S binding was evidenced (Kleja et al., 2016) thiol groups could definitely play a role 306
in its speciation but other uncharacterized S-rich functional groups cannot be excluded. A 307
similar assumption could be relevant for Tl(I) despite limited access to data investigating the 308
role of thiol groups for Tl(I) biogeochemistry (Garcia Bugarin et al., 1989; Jacobson et al., 309
2005b; Rodrigez-Mercado et al., 2013). 310
However, due to the low abundance of thiol groups and their expected pKa value around 8
311
(Smith et al., 2002; Rao et al., 2014), they are probably accounted non-specifically within the 312
high affinity sites continuous distribution of the NICA-Donnan model (Benedetti et al., 1995; 313
Benedetti et al., 1996a, 1996b). The log𝐾, values 4.88 and 2.40, obtained for Ag(I) and Tl(I),
314
respectively (Table 1), are higher than the values reported in Milne et al. s study (2003) and 315
should be used now to simulate Ag or Tl interaction with NOM regardless of the assumptions 316
on the role of S-rich functional groups. 317
318
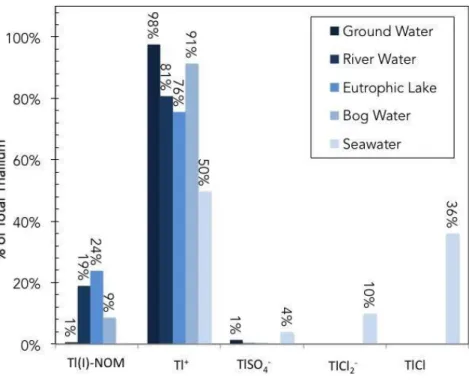
2.3. Consequences for Tl(I) geochemical cycle in waters and soils. 319
In this study, Tl(I) aqueous speciation (dissolved phase), in various natural water systems from 320
Kaplan and Mattigod (1998) is revisited. Data on groundwater, river water, eutrophic lake water, 321
bog water and seawater are gathered together with constants used in Tl(I) speciation modeling 322
in Appendix A (Table S8). The following assumptions are made to simulate the Tl(I) speciation 323
in the above natural water systems. For groundwater, river water, eutrophic lake and sweater it 324
is assumed that DOM was mainly FA and that it is HA for the bog water. 80% in mass of the 325
DOM was assumed to be reactive according to Tipping (2002). In order to get HA or FA 326
concentrations in natural waters, DOM was calculated from DOC values considering a ratio 327
DOM to DOC of 2:1 (by mass of C) (Ren et al., 2015).Constants for other complexes than Tl(I) 328
aqueous species are summarized in Appendix A (Table S9). The parameter values for FA were 329
estimated by making the following hypothesis. The heterogeneity parameters ni,1 and ni,2 in 330
NICA-Donnan are very similar for HA and FA (Milne et al., 2003). The values obtained here 331
for a HA can thus be used for FA in combination with the other generic binding parameters. 332
Conversely, in Milne et al., (2003) empirical relationship linking ni,1, 𝐾, and KOH for FA and
333
HA are similar. Therefore, combining those two observations, we assumed that the derived Tl(I) 334
HA parameters can be used in combination with the generic FA parameters from Milne et al. s 335
study (2003) to simulate the Tl(I) interaction to the low affinity site of the DOM. A similar 336
reasoning is made for the high affinity sites to derive𝐾, . The generic parameters used to
337
describe the FA and HA interaction with Tl(I) are given in Appendix A (Table S10). With the 338
following assumptions, we are now able to simulate the different aquatic ecosystems and the 339
results are given in Appendix A (Table S11) and presented in Fig. 4. This figure shows that 340
only two dissolved aqueous species of Tl(I) would exist in natural waters, Tl(I) represents 341
between 76 and 98% of total dissolved Tl while Tl bound to NOM analogues represents the 342
remaining thallium, except for the seawater system where TlCl and TlCl2- account for 46% of
343
the total thallium. However, unlike Kaplan and Mattigod s results(1998) it seems that there is 344
not a major contribution of Tl-NOM species in bog water (i.e. TlHA is < 10%). This is the result 345
of the competition between protons and Tl(I) to the same type of sites. Under the low pH 346
conditions of the peat bog the protons compete very efficiently and prevent Tl(I) binding to the 347
bog NOM. In this study, Tl(I)-NOM complex is however slightly more important for all other 348
conditions if compared to Kaplan and Mattigod s results (1998) (Table S11). Discrepancies 349
with Kaplan and Mattigod s study(1998) are probably due to the different type of modelling 350
performed in both studies as well as the available binding data. Indeed, NICA-Donnan or 351
WHAM 7 models were proven to give much more robust prediction of metal ion speciation 352
even outside of the range of metal ion concentrations used for their calibration (Benedetti et al., 353
1996b; Tipping, 2002). These findings support that our modelling predictions could be more 354
robust than previous ones as far as concentration is concerned. In addition, the range of 355
concentration used in this study, to derive parameters, is always difficult to simulate for models 356
(Benedetti et al., 1996b; Tipping, 2002). Most models always performed well at high 357
concentration but their extrapolations to much lower concentration ranges are always much 358
more problematic (Benedetti et al., 1996b; Tipping, 2002). As expected, no Tl(I)-NOM 359
complexes are found in seawater and half of thallium is free Tl(I) ions and half is chloride 360
complex species (TlCl and TlCl2, Table 1).
361
Thallium speciation in soil solution was modelled. Compositions of soil solutions are taken 362
from Kinniburgh et al., (1983). Various concentrations relevant to pristine or polluted systems 363
are taken into consideration. Many organic molecules are regrouped as NOM in soil solutions. 364
According to Ren et al.(2015), approximately 29% are humic substances, 66% are hydrophilic 365
acids and 5% are non-reactive organic components. During modelling, hydrophilic acids are 366
equally divided in acetic acid, citric acid and oxalic acid, three low molecular weight organic 367
acids (LMWOAs). Humic substances are modelled as FA since Ren et al., (2015) and van 368
Zomeren and Comans, (2007) revealed that they are FA and not HA as previously imagined. 369
Details of used binding parameters, compositions and results are presented in Appendix A 370
(Tables S10 and S12). Results are gathered in Fig. 5. Thallium does not strongly complex with 371
such LMWOA as shown in Vanek et al., (2012). Therefore, like for natural water systems, only 372
two species control Tl(I) speciation: Tl(I) ions and Tl-FA. At low Tl(I) concentrations (≤ 1 373
nmol.L-1), up to 35% of the thallium is bound to NOM (Fig. 5). Conversely, at higher Tl(I)
374
concentrations (≥ 1 nmol.L-1), less than 10% of Tl(I) is bound to NOM (Fig. 5).
375
Wick et al., (2018)gathered data on Tl binding to a number of phases from clay minerals, to 376
manganese oxides. When compared to these results, our data suggest that similar amounts of 377
Tl(I) are complexed by humic substance as ferrihydrite, illite and smectite (Wick et al., 2018; 378
Martin et al., 2018). In addition, our results are close to the ones from Liu et al., (2011). Despite 379
similar affinity for organic matter and illitic clays, observations in soils showed a limited role 380
of organic matter on thallium uptake (Vanek et al., 2009; Vanek et al., 2013; Voegelin et al., 381
2015). Thus, thallium seems to be highly mobile and labile when it is observed in organic rich 382
soil horizons (Vanek et al., 2009; Vanek et al., 2013) in agreement with results showed in Fig. 383
5. Furthermore, natural organic matter could also lead to release thallium in soil by enhancing 384
silicate alteration/weathering as suggested in some studies (Vanek et al., 2009; Ren et al., 2015). 385
Tl(I) in critical zone conditions will behave more like a lithophile element close to alkali metals 386
(K+, Rb+ and Cs+). This conclusion is supported by observations made that illitic clay systems
387
control the mobility of Tl(I) like for K+ and Cs+ (Jacobson et al., 2005; Voegelin et al., 2015;
388
Wick et al., 2018; Martin et al., 2018). These results also point out that in rivers, Tl(I) is 389
predominantly a highly bioavailable free ion (Tl+). Indeed, various studies highlighted that Tl(I)
390
poorly reacts with particulate phases and remains mainly in the dissolved fraction as a free ion 391
(Fig. 4) (Law and Turner, 2011; Boning et al., 2017; Casiot et al., 2017). However, several 392
questions regarding thallium remain open, especially the role of Tl(III) and its 393
abundance/stability in the environment (Lin and Nriagu, 1999; Twining et al., 2003; Karlsson 394
et al., 2006; Watanabe and Takahashi, 2015). Only one paper reported the binding of Tl(III) to 395
HA (Watanabe and Takahashi, 2015), the Tl(III) species would be stabilized by HA but only at 396
low pH and high redox potential values. The reactivity of Tl(III) with NOM needs more studies 397
to fully picture the Tl environmental biogeochemistry. The combination of HPLC-ICP-MS 398
system designed based on previous studies (Campanella et al., 2017; Casiot et al., 2017) and 399
the presently used DMT approach would greatly help to make progress. Finally, in order to 400
complete the database, Tl(I/III) interactions with other analogues of NOM should be studied. 401
402
3 Conclusion 403
Thallium complexation was compared to silver complexation using literature data and using the 404
same NICA-Donnan formalism. We report here, for the first time, parameters for these two 405
cations. Results display low thallium complexation to the NOM proxy while silver competes 406
with divalent cations for the NOM binding sites. Calculated speciation for dissolved thallium 407
highlights the dominance of free thallium (Tl+) in solution whereas Tl-NOM complexes
408
contribute roughly 15% to total Tl(I) species in river and lake type waters. Similar results are 409
obtained for soil solutions, Tl-bound to NOM < 30% of total, from UK soils with different land 410
use and geochemistry. However, several questions regarding thallium remain open, especially 411
the role of Tl(III) and its abundance/stability in the environment. 412
413
Acknowledgments 414
The authors thank IRSN, CEA, BRGM and IPGP for funding this research. Parts of this work 415
were also supported by IPGP multidisciplinary program PARI and by Region Ile de France 416
SESAME Grant no. 12015908. 417
418
Appendix A. Supplementary dara 419
Supplementary data associated with this article can be found in the online version at xxxxxx. 420
421
References 422
Aiken, G. R., Hsu-Kim, H., Ryan, J. N., 2011. Influence of Dissolved Organic Matter on the 423
Environmental Fate of Metals, Nanoparticles, and Colloids. Environmental Science and 424
Technology, 45, 3196–3201. http://doi.org/10.1021/es103992s 425
Benedetti, M. F., Milne, C. J., Kinniburgh, D. G., 1995. Metal ion binding to humic substances: 426
application of the non-ideal competitive adsorption model. Environmental Science & 427
Technology, 29(2), 446–457. http://doi.org/10.1021/es00002a022 428
Benedetti, M. F., Van Riemsdijk, W. H., Koopal, L. K., 1996a. Humic substances considered 429
as a heterogeneous Donnan gel phase. Environmental Science and Technology, 30(6), 1805– 430
1813. http://doi.org/10.1021/es950012y 431
Benedetti, M. F., Van Riemsdijk, W. H., Koopal, L. K., Kinniburgh, D. G., Gooddy, D. C., 432
Milne, C. J., 1996b. Metal ion binding by natural organic matter: From the model to the field. 433
Geochimica et Cosmochimica Acta, 60(14), 2503–2513.
http://doi.org/10.1016/0016-434
7037(96)00113-5
435
Böning, P., Ehlert, C., Niggemann, J., Schnetger, B., Pahnke, K., 2017. Thallium dynamics in 436
the Weser estuary (NW Germany). Estuarine, Coastal and Shelf Science, 187, 146–151. 437
Botero, W. G., Pineau, M., Janot, N., Domingos, R., Mariano, J., Rocha, L. S., Groenenberg, J. 438
E., Benedetti, M. F., Pinheiro, J. P., 2017. Isolation and purifications treatments change the 439
metal binding properties of humic acids: effect of the HF/HCl treatment. Environmental 440
Chemistry, 14, 417–424. https://doi.org/10.1071/EN17129 441
Campanella, B., Casiot, C., Onor, M., Perotti, M., Petrini, R., Bramanti, E., 2017. Thallium 442
release from acid mine drainages : Speciation in river and tap water from Valdicastello 443
mining district (northwest Tuscany). Talanta, 171(May), 255–261. 444
http://doi.org/10.1016/j.talanta.2017.05.009 445
Campanella, B., D Ulivo, A., Ghezzi, L., Onor, M., Petrini, R., Bramanti, E., 2018. Influence 446
of environmental and anthropogenic parameters on thallium oxidation state in natural waters. 447
Chemosphere, 196, 1–8. https://doi.org/10.1016/j.chemosphere.2017.12.155 448
Casiot, C., Egal, M., Bruneel, O., Verma, N., Parmentier M., Elbaz-Poulichet, F., 2011. 449
Predominance of Aqueous Tl(I) Species in the River System Downstream from the 450
abandoned Carnoulès Mine (Southern France). Environmental Science & Technology, 45(1), 451
2056–2064. http://doi.org/10.1021/es102064r 452
Catrouillet, C., Davranche, M., Dia, A., Bouhnik-Le Coz, M., Pédrot, M., Marsac, R., Gruau 453
G., 2015. Thiol groups controls on arsenite binding by organic matter : New experimental 454
and modeling evidence. Journal of Colloid and Interface Science, 460, 310–320. 455
https://doi.org/10.1016/j.jcis.2015.08.045
Cheam, V., 2001. Thallium Contamination of Water in Canada, Water Qual. Res. J. Canada, 457
36(4), 851–877. 458
Chen, Z., Campbell, P. G. C., Fortin, C., 2012. Silver binding by humic acid as determined by 459
equilibrium ion-exchange and dialysis. Journal of Physical Chemistry A, 116(25), 6532– 460
6539. http://doi.org/10.1021/jp212403r 461
Coup, K. M., Swedlund, P. J., 2015. Demystifying the interfacial aquatic geochemistry of 462
thallium(I): New and old data reveal just a regular cation. Chemical Geology, 398, 97–103. 463
http://doi.org/10.1016/j.chemgeo.2015.02.003
464
Garcia Bugarin, M. G., Casas, J. S., Sordo, J. Filella M., 1989. Thallium ( I ) Interactions in 465
Biological Fluids : A Potentiometric Investigation of Thallium ( I ) Complex Equilibria with 466
Some Sulphur-containing Amino Acids. Journal of Inorganic Biochemistry, 35, 95– 105. 467
Gharib, F., Shamel, A., 2009. Solvent Effects on Protonation and Complexation of Cysteine 468
and Thallium ( I ) in Different Aqueous Solutions of Methanol. J. Chem. Eng. Data., 54, 469
933–939 470
Haitzer, M., Aiken, G. R., Ryan, J. N., 2002. Binding of Mercury(II) to Dissolved Organic 471
Matter: The Role of the Mercury-to-DOM Concentration Ratio. Environmental Science and 472
Technology, 36, 3564–3570. http://doi.org/10.1021/es025699i 473
Jacobson, A. R., McBride, M. B., Baveye, P., Steenhuis, T. S., 2005a. Environmental factors 474
determining the trace-level sorption of silver and thallium to soils. Science of The Total 475
Environment, 345(1-3), 191–205. http://doi.org/10.1016/j.scitotenv.2004.10.027 476
Jacobson, A. R., Klitzke, S., McBride, M. B., Baveye, P., Steenhuis, T. S., 2005b. The 477
desorption of silver and thallium from soils in the presence of a chelating resin with thiol 478
functional groups. Water, Air, Soil Pollut., 160, 41–54.
http://doi.org/10.1007/s11270-005-479
3860-3
480
Joe-Wong, C., Shoenfelt, E., Hauser, E. J., Crompton, N., Myneni, S. C. B., 2012. Estimation 481
of reactive thiol concentrations in dissolved organic matter and bacterial cell membranes in 482
aquatic systems. Environmental Science and Technology, 46, 9854–9861. 483
http://doi.org/10.1021/es301381n 484
Kalis, E. J. J., Temminghoff, E. J. M., Van Riemsdijk, W. H., Weng, L., 2007. Measuring Free 485
Metal Ion Concentrations in Multicomponent Solutions Using the Donnan Membrane 486
Technique Measuring Free Metal Ion Concentrations in Multicomponent Solutions Using 487
the Donnan Membrane Technique. Analytical Chemistry, 40(3), 955–955. 488
http://doi.org/10.1021/ac0615403
Kalis, E. J. J., Weng, L., Dousma, F., Temminghoff, E. J. M., Van Riemsdijk, W. H., 2006. 490
Measuring Free Metal Ion Concentrations in Situ in Natural Water Using the Donnan 491
Membrane Technique. Environ. Sci. Technol, 40(3), 955–961.
492
http://doi.org/10.1021/ac0615403
493
Kaplan, D. I., Mattigod S. V., 1998. Aqueous geochemistry of thallium. In Thallium in the 494
Environment. J. O. Nriagu (Eds.), John Wiley & Sons, Inc. New York, pp15–29 495
Karlsson, U., Karlsson, S., Düker, A., 2006. The effect of light and iron(II)/iron(III) on the 496
distribution of Tl(i)/Tl(iii) in fresh water systems. Journal of Environmental Monitoring, 8(6), 497
634. http://doi.org/10.1039/b516445a 498
Keizer, M. G., Van Riemsdjik, W. H., 1994. A Computer Program for the Calculation of 499
Chemical Speciation and Transport in Soil-Water Systems (ECOSAT 4.7). Wageningen 500
Agricultural University, Wageningen, The Netherlands. 501
Kinniburgh, D. G., Milne, D. L., 1983. Extraction and chemical analysis of interstitial water 502
from soils and rocks. Environmental Science & Technology, 17(6), 362–368. 503
http://doi.org/10.1021/es00112a011
504
Kinniburgh, D. G., Milne, C. J., Benedetti, M. F., Pinheiro, J. P., Filius, J., Koopal, L. K., Van 505
Riemsdijk, W. H., 1996. Metal Ion Binding by Humic Acid: Application of the NICA-506
Donnan Model. Environmental Science & Technology, 30(5), 1687–1698. 507
http://doi.org/10.1021/es950695h
508
Kleja, D. B., Nakata, S., Persson, I., Gustafsson, J. P., 2016. Silver(I) Binding Properties of 509
Organic Soil Materials Are Different from Those of Isolated Humic Substances. 510
Environmental Science and Technology, 50, 7453–7460.
511
http://doi.org/10.1021/acs.est.6b00970
512
Koopal, L. K., Saito, T., Pinheiro, J. P., Van Riemsdijk, W. H., 2005. Ion binding to natural 513
organic matter: General considerations and the NICA-Donnan model. Colloids and Surfaces 514
A: Physicochemical and Engineering Aspects, 265(1-3), 40–54.
515
http://doi.org/10.1016/j.colsurfa.2004.11.050
516
Koopal, L., Van Riemsdijk, W., Dewit, J., Benedetti, M.F., 1994. Analytical Isotherm Equations 517
for Multicomponent Adsorption to Heterogeneous Surfaces. Journal of Colloid and Interface 518
Science, 166(1), 51–60. 519
Law, S., Turner, A., 2011. Thallium in the hydrosphere of south west England. Environmental 520
Pollution, 159, 3484–3489. 521
Lin, T.-S., Nriagu, J., 1999. Thallium Speciation in the Great Lakes. Environmental Science & 522
Technology, 33(19), 3394–3397. http://doi.org/10.1021/es981096o 523
Lis, J., Pasieczna, A., Karbowska, B., Zembrzuski, W., Lukaszewski, Z., 2003. Thallium in 524
soils and stream sediments of a Zn-Pb mining and smelting area. Environmental Science and 525
Technology, 37(20), 4569–4572. http://doi.org/10.1021/es0346936 526
Liu, J., Lippold, H., Wang, J., Lippmann-Pipke, J., Chen, Y., 2011. Sorption of thallium(I) onto 527
geological materials: Influence of pH and humic matter. Chemosphere, 82(6), 866–871. 528
http://doi.org/10.1016/j.chemosphere.2010.10.089
529
Manceau, A., Nagy, K. L., 2012. Quantitative analysis of sulfur functional groups in natural 530
organic matter by XANES spectroscopy. Geochimica et Cosmochimica Acta, 99, 206–223. 531
http://dx.doi.org/10.1016/j.gca.2012.09.03
532
Martin, L. A., Wissocq, A., Benedetti, M. F., Latrille, C., 2018. Thallium (Tl) sorption onto 533
illite and smectite: Implications for Tl mobility in the environment. Geochimica et 534
Cosmochimica Acta, 230, 1–16. https://doi.org/10.1016/j.gca.2018.03.016 535
Milne, C. J., Kinniburgh, D. G., Tipping, E., 2001. Generic NICA-Donnan model parameters 536
for proton binding by humic substances. Environmental Science and Technology, 35(10), 537
2049–2059. http://doi.org/10.1021/es000123j 538
Milne, C. J., Kinniburgh, D. G., van Riemsdijk, W. H., & Tipping, E., 2003. Generic 539
NICADonnan Model Parameters for Metal-Ion Binding by Humic Substances. 540
Environmental Science & Technology, 37(5), 958–971. http://doi.org/10.1021/es0258879 541
Nielsen, S. G., Rehkämper, M., Porcelli, D., Andersson, P., Halliday, A. N., Swarzenski, P. W.,
542
Günther, D., 2005. Thallium isotope composition of the upper continental crust and rivers—An
543
investigation of the continental sources of dissolved marine thallium. Geochimica et
544
Cosmochimica Acta, 69(8), 2007–2019. https://doi.org/10.1016/j.gca.2004.10.025
545
Peacock, C. L., Moon, E. M., 2012. Oxidative scavenging of thallium by birnessite: Explanation 546
for thallium enrichment and stable isotope fractionation in marine ferromanganese 547
precipitates. Geochimica et Cosmochimica Acta, 84, 297–313. 548
http://doi.org/10.1016/j.gca.2012.01.036
549
Pearson, R. G., 1968. Hard and Soft Acids and Bases, HSAB, Part II – Underlying theories. 550
Journal of Chemical Education, 45(10), 643–648. http://doi.org/10.1021/2Fed045p643 551
Perdue, E. M., Ritchie, J. D., 2003. Dissolved organic matter in freshwaters. Treatise on 552
geochemistry, 5, 605. 553
Peter, a. L. J., Viraraghavan, T., 2005. Thallium: a review of public health and environmental 554
concerns. Environment International, 31(4), 493–501.
555
http://doi.org/10.1016/j.envint.2004.09.003
Prytulak, J., Brett, A., Webb, M., Plank, T., Rehkämper, M., Savage, P. S., Woodhead, J., 2017. 557
Thallium elemental behavior and stable isotope fractionation during magmatic processes. 558
Chemical Geology, 448, 71–83. http://doi.org/10.1016/j.chemgeo.2016.11.007 559
Rao, B., Simpson, C., Lin, H., Liang, L., Gu, B., 2014. Determination of thiol functional groups 560
on bacteria and natural organic matter in environmental systems. Talanta, 119, 240–247. 561
http://doi.org/10.1016/j.talanta.2013.11.004
562
Ren, Z.-L., Tella, M., Bravin, M. N., Comans, R. N. J., Dai, J., Garnier, J.-M., Benedetti, M. F., 563
2015. Effect of dissolved organic matter composition on metal speciation in soil solutions. 564
Chemical Geology, 398, 61–69. http://doi.org/10.1016/j.chemgeo.2015.01.020 565
Rodríguez-Mercado, J. J., Altamirano-Lozano, M. A., 2013. Genetic toxicology of thallium : a 566
review. Drug and Chemical Toxicology, 36, 369–383.
567
http://doi.org/10.3109/01480545.2012.710633
568
Sikora, F. J., Stevenson, F. J., 1988. Silver Complexation by Humic Substances : Conditional 569
Stability Constants and Nature of Reactive Sites. Geoderma, 42, 353–363. 570
Skyllberg, U., Bloom, P. R., Qian, J., Lin, C.-M., Bleam W. F., 2006. Complexation of 571
Mercury(II) in Soil Organic Matter: EXAFS Evidence for Linear Two Coordination with 572
Reduced Sulfur Groups. Environmental Science and Technology, 40, 4174–4180. 573
http://doi.org/10.1021/es0600577
574
Smith, D. S., Bell, R. A., Kramer, J. R., 2002. Metal speciation in natural waters with emphasis 575
on reduced sulfur groups as strong metal binding sites. Comparative Biochemistry and 576
Physiology Part C, 133(1-2), 65–74. http://doi.org/10.1016/S1532-0456(02)00108-4 577
Temminghoff, E. J. M., Plette, A. C. C., Van Eck, R., van Riemsdijk, W. H., 2000. 578
Determination of the chemical speciation of trace metals in aqueous systems by the 579
Wageningen Donnan Membrane Technique. Analytica Chimica Acta, 417(2), 149–157. 580
http://doi.org/10.1016/S0003-2670(00)00935-1
581
Tipping E., 2002. Cation binding by humic substances, Cambridge environmental chemistry 582
Series / 12, Cambridge University Press, pp 434 583
Twining, B. S., Twiss, M. R., Fisher, N. S., 2003. Oxidation of thallium by freshwater plankton 584
communities. Environmental Science & Technology, 37(12), 2720–6. 585
http://doi.org/10.1021/es026145i
586
Valravamurthy, M. A., Maletic, D., Wang, S., Manowitz, B., Eglinton, T., Lyons, T., 1997. 587
Characterization of Sulfur-Containing Functional Groups in Sedimentary Humic Substances 588
by X-ray Absorption Near-Edge Structure Spectroscopy. Energy & Fuels, 11, 546–553. 589
Van k, A., Chrastný, V., Komárek, M., Peníek, V., Teper, L., Cabala, J., Dranek, O., 2013. 590
Geochemical position of thallium in soils from a smelter-impacted area. Journal of 591
Geochemical Exploration, 124, 176–182. 592
Van k, A., Chrastn , V., Mihaljevi, M., Drahota, P., Grygar, T., Komárek, M., 2009. Lithogenic 593
thallium behavior in soils with different land use. Journal of Geochemical Exploration, 102, 594
7–12. 595
Van k, A., Komárek, M., Chrastn , V., Galu, I., Mihaljevi, M., Drahota, P., Tejneck , V., 596
Vokurková, P., 2012. Effect of low-molecular-weight organic acids on the leaching of 597
thallium and accompanying cations from soil – A model rhizosphere solution approach. 598
Journal of Geochemical Exploration, 112, 212–217. 599
Vink, B. W., 1993. The behavior of thallium in the (sub) surface environment in terms of Eh 600
and pH. Chemical Geology, 109, 119–123. 601
Voegelin, A., Pfenninger, N., Petrikis, J., Majzlan, J., Plötze, M., Senn, A.-C., Göttlicher, J., 602
2015. Thallium speciation and extractability in a thallium- and arsenic-rich soil developed 603
from mineralized carbonate rock. Environmental Science and Technology, 49(9), 5390–8. 604
http://doi.org/10.1021/acs.est.5b00629
605
Watanabe, Y. Takahashi, Y., 2015. An Experimental Study of Stabilization of Trivalent 606
Thallium by Natural Organic Matter. Chem. Lett., 44, 297–313. 607
http://doi.org/10.1246/cl.150551
608
Weng, L., Van Riemsdijk, W. H., Temminghoff, E. J. M., 2005. Kinetic aspects of Donnan 609
membrane technique for measuring free trace cation concentration. Analytical Chemistry, 610
77(9), 2852–2861. http://doi.org/10.1021/ac0485435 611
Wick, S., Baeyens, B., Marques Fernandes, M., Voegelin, A., 2018. Thallium Adsorption onto 612
Illite. Environmental Science and Technology, 52, 571–580 613
Xiong, Y., 2009. The aqueous geochemistry of thallium: speciation and solubility of thallium 614
in low temperature systems. Environ. Chem., 6, 441–451. http://doi.org/10.1071/EN08086 615
616
List of tables 617
Table 1 Ion specific parameters (ISP) for the NICA-Donnan model selected after adjustment 618
with experimental data. RMSE were calculated only with data used for ISP adjustments. For 619
Tl(I) it means only data from the concentration isotherm. Subscript 1 and 2 correspond 620
respectively to low affinity and high affinity sites of the humic substances as defined in NICA-621
Donnan model theory (Benedetti et al., 1995; Benedetti et al., 1996a) 622
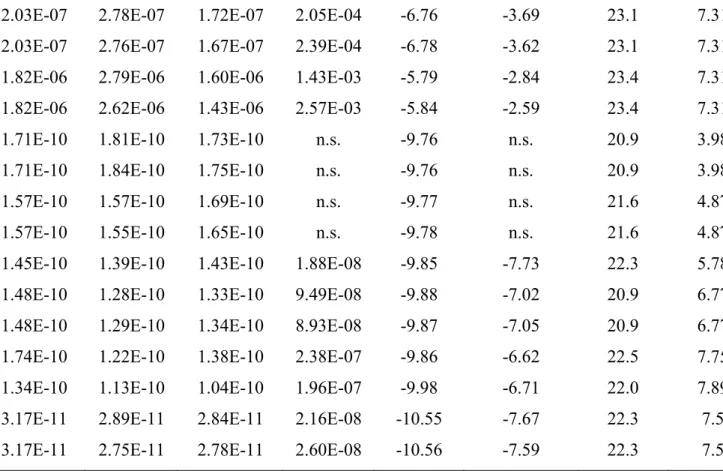
Element log𝐾, ni,1 log𝐾, ni,2 RMSE for free ion RMSE for bound ion Tl(I) 0.20 0.88 2.40 0.84 0.04 (n = 9) 0.16 (n = 9) Ag(I) -0.10 0.59 4.88 0.71 - 0.02 (n = 62) K(I) 0.2 0.88 1.14 0.84 - - 623 List of figures 624 625
Fig. 1 (a) Evolution of bound thallium as function of free thallium. pH for measured data was 626
7.35 ± 0.05 with [HA] = 150 mg/L. For free Tl: RMSE = 0.04 (n = 9) and for bound Tl(I): RMSE 627
= 0.16 (n = 9). (b) Calculated free thallium after the optimization of NICA-Donnan parameters 628
with the data set given in (a) vs. measured free Tl(I). (c) Measured vs. calculated for 629
complexed/bound thallium. For b and c, red lines are regression lines whereas dashed red lines 630
correspond to the confidence area (5%) of the regressions. The dashed black lines are one to 631
one lines. Error bars are ± 2 . 632
634
Fig. 2 Bound silver versus free silver for three humic acids (HA1, 3 and 8). Experimental points 635
are from Sikora and Stevenson (1988). Background electrolyte was KNO3 0.1 mol/L, pH was
636
6.5 and [HA] = 500 mg/L. Dashed black lines corresponding to NICA Donnan simulation 637
obtained after adjustment of NICA-Donnan model parameters values 638
639
640
Fig. 3 Log [metal bound] calculated with NICA-Donnan generic parameters for humic acids 641
from Milne et al., (2003) for metal ions represented by black dots. Tl and Ag parameters come 642
from the present study. The total metal concentration is equal to 10 nmol/L of a given metal and 643
a background concentration of 1 mmol/L of Ca2+ is used for each calculations.
644 645
646
Fig. 4 Modeled Tl speciation in various natural water systems from Kaplan and Mattigod (1998) 647
648
649
Fig. 5 Modeled Tl speciation in three soil solutions at relevant environmental concentrations. 650
More details are summarized in Appendix A (Tables S10 to S12 from Kinniburgh and Miles, 651
1983).
1 Appendix A. Supplemenary data
1 2
Effect of natural organic matter on thallium and silver speciation 3
4
Loïc A. Martin1,2,3, Caroline Simonucci2, Sétareh Rad4, and Marc F. Benedetti1*
5 6
1. Université de Paris, Institut de physique du globe de Paris, CNRS, UMR 7154, F-75238 7
Paris, France. 8
2. IRSN, PSE-ENV/SIRSE/LER-Nord, BP 17, 92262 Fontenay-aux-Roses Cedex, France 9
3. Catchment and Eco-Hydrology Research Group, Luxembourg Institute of Science and 10
Technology, L-4422, Belvaux, Luxembourg 11
4. BRGM, Unité de Géomicrobiologie et Monitoring environnemental 45060 Orléans 12
Cedex 2, France 13
14
*Corresponding authors. Email address: benedetti@ipgp.fr 15
16 17
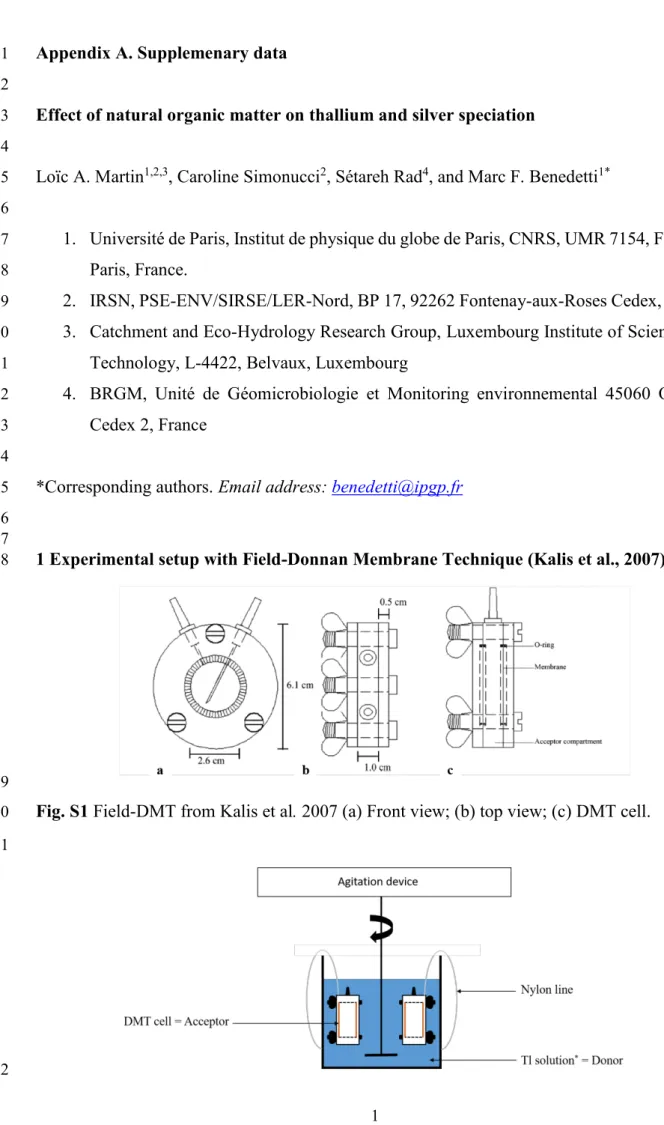
1 Experimental setup with Field-Donnan Membrane Technique (Kalis et al., 2007) 18
19
Fig. S1 Field-DMT from Kalis et al. 2007 (a) Front view; (b) top view; (c) DMT cell. 20
21
22
2
Fig. S2 Experimental set-up used for Tl(I) experiments. *Tl solution = D i is a
23
mixture that contains Tl(I)+, K+, NO
3- and humic acid.
24 25
2 Time to equilibrium for Tl+ (Donnan Membrane Technique) 26
27
Fig. S3 Time to reach equilibrium for Tl+ at pH = 4.0 ± 0.1, between the DMT compartments
28
(i.e. acceptor vs. donor sides) in absence of humic acid. Error bars are 2 f he e e i e a 29
data. Time to reach equilibrium is 24 hrs for Tl+ Dashed lines correspond to the modeled
30
variation of cation concentrations as function of time during experiments. Model equation is 31
given in Temminghoff et al., 2000. 32
3
3 Composition and calculated speciation of experimental solutions 34
Table S1 Calculated Tl speciation in the acceptor side of the DMT. Modeled with CHESS 2.0. 35
Only species corresponding to more than 1% of total concentration are presented here. 36
Saturations indices indicate that under-saturation towards Tl bearing minerals (TlOH, TlNO3,)
37
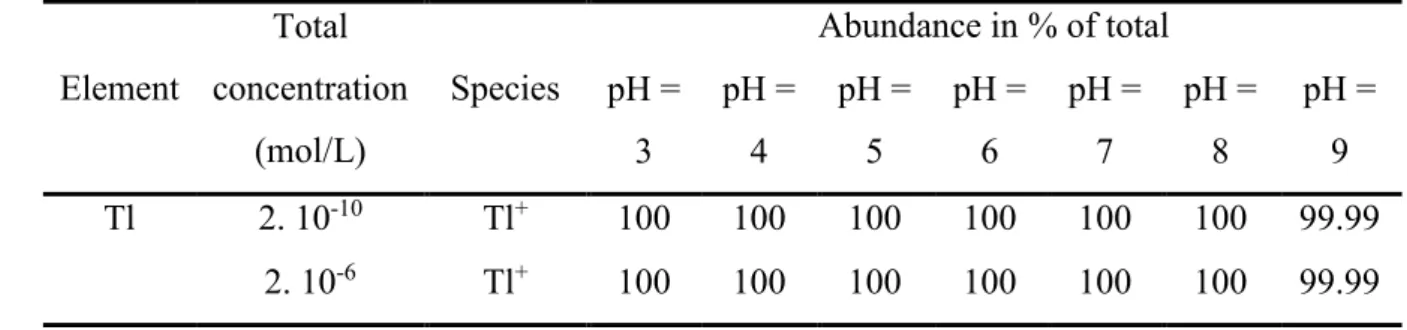
is expected during the experiments. Additional constants came from Casiot et al. (2011). 38 Element Total concentration (mol/L) Species Abundance in % of total pH = 3 pH = 4 pH = 5 pH = 6 pH = 7 pH = 8 pH = 9 Tl 2. 10-10 Tl+ 100 100 100 100 100 100 99.99 2. 10-6 Tl+ 100 100 100 100 100 100 99.99 39
Table S2 Compositions of donor and acceptor solutions at t=0. TlNO3 is not present because it
40
only exists as a solid specie. 41
Tl isotherms
Donor Tl+, K+, NO
3-, Humic Acids, Na+(after basic
pH)
Acceptor K+, NO
3
-42
4 205Tlmeasurements with HR-ICP-MS Element 2 (Thermo Scientific) 43
Table S3 Operating conditions and data acquisition parameters for HR-ICP-MS Element 2 used 44
for 205Tl measurements. Thallium was measured only in low-resolution mode.
45
HR-ICP-MS
Rf power (W) 1350
Sample uptake rate (mL.min -1)
0.2 Argon flow rates (L.min-1)
Cool 16
Auxiliary 1.0
Sample Between 0.9 and 1.0 (depends of sensibility)
Torch Quartz torch with a separate quartz injector tube
4
Spray chamber Quartz Cyclo spray chamber
Sampler cone Nickel
Skimmer cone Nickel
Data acquisition Low Resolution
No. of passes 3
Mass window (%) 20
Search window (%) 0
Integration window (%) 20
Samples per peak 25
Sample time (s) 1.0 (205Tl)
46
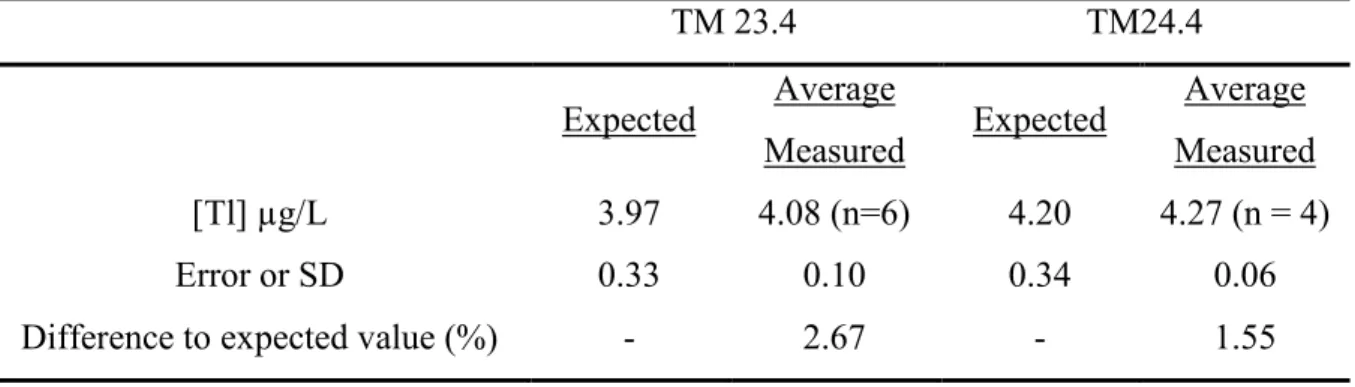
Table S4 Measured Tl values for TM23.4 and TM24.4 certified materials (Environment 47 Canada). 48 TM 23.4 TM24.4 Expected Average Measured Expected Average Measured [Tl] µg/L 3.97 4.08 (n=6) 4.20 4.27 (n = 4) Error or SD 0.33 0.10 0.34 0.06
Difference to expected value (%) - 2.67 - 1.55
49
5 NICA-Donnan model parameters 50
Table S5 Purified humic acid specific parameters used during NICA-Donnan modeling are 51
from Botero et al., 2017. 52 Α β Qmax,1 (mol/kg) log 𝐾 , n1,H Qmax,2 (mol/kg) log 𝐾 ,2 n2,H p1 p2 0.60 -0.27 3.18 3.65 0.84 3.02 8.07 0.65 0.79 0.44 53
6 Estimation of experimental errors and RMSE calculations 54
Uncertainties reported in this section are calculated from the propagation of known 55
measurements or lab errors following the same approach as Reinoso-Maset et al (2014). These 56
did not take into account the humic acid variability. Experimental errors were hence calculated 57
5
for each experimental point following the propagation errors theory. The variance of a G 58
function of different xi variable can be calculated from the variances of the variables xi using 59
the following expression: 60
𝜎2 ∑ 2𝜎2
= 2 ∑ ∑ 𝜎 (S Eq. 1)
61
he e ( G/ i) is the partial derivative of G with respect to xi, 2 is the variance of xi and
62
ij the covariance of the xi and xj variables. If these variables are independents, the covariance 63
term is then equal to zero. 64
Root Mean Square Error (RMSE, S Eq. 2) was calculated to assess the gap between 65
experimental and modelled values for each series. 66
𝑅𝑀𝑆𝐸 ∑ log Me +
, e red log Me + , odelled 2
= (S Eq. 2)
67
68
7 Experimental data and additional modeled data 69
70
Fig. S4 Free Tl concentration over total Tl concentration function of pH. When Tl = K is 71
mentioned (green dashed line), it means that ion-specific parameters, 𝐾, , 𝐾,2, ni,1 and ni,2 for 72
b h T a d K e e he a e d i g de i g. O he i e, he T K i e i ed ( ed 73
da hed i e), h e a a e e e e diffe e . E e i e a e ba a e 2 . 74
75
8 Silver complexation with humic acids 76
Table S6 Parameters used during modeling with ECOSAT software for experimental data of 77
silver complexation to three humic acids from Sikora et al. (1988). In all simulations, pH=6.5, 78
6
background electrolyte was KNO3 0.1 mol/L and HA concentration was 0.5 g/L. Values in bold
79
and italic are those that were adjusted. mi = nipi (Benedetti et al., 1995).
80
HA1 HA3 HA8
B 0.49 0.49 0.49 Qmax1, H 4.43 (from Sikora et al., 1988) 3.95 (from Sikora et al., 1988) 3.95 p1 0.62 0.62 0.62 log 𝐾 , 3.00 3.00 3.00 nH,1 0.80 0.80 0.80 Qmax2, H 3.30 3.30 3.30 p2 0.41 0.41 0.41 log 𝐾 ,2 7.00 7.60 7.25 nH,2 0.63 0.63 0.63 log 𝐾 , 0.20 0.20 0.20 nK,1 0.88 0.88 0.88 log 𝐾 ,2 1.14 1.14 1.14 nK,2 0.84 0.84 0.84 log 𝐾 , -0.10 -0.10 -0.10 nAg,1 0.59 0.59 0.59 log 𝐾 ,2 4.88 4.88 4.88 nAg,2 0.71 0.71 0.71 m1 0.50 0.50 0.50 m2 0.26 0.26 0.26 81
Table S7 Experimental data acquired for Tl(I) and used for calculations. n.s. not significant 82 [Tl]donor, eq (mol/L) [Tl]acceptor, eq (mol/L) [Tl]free,don, eq (mol/L) [Tl]complexed (mol/kg) log[Tl]free (mol/L) log[Tl]complexed (mol/kg) Tavg (°C) pH
2.24E-11 1.67E-11 1.210E-11 6.84E-08 -10.92 -7.17 24.4 7.39
2.24E-11 1.68E-11 1.16E-11 7.17E-08 -10.94 -7.14 24.4 7.39
2.11E-10 3.08E-10 1.27E-10 5.59E-07 -9.90 -6.25 23.5 7.40
1.73E-09 2.59E-09 1.47E-09 1.74E-06 -8.83 -5.76 24.2 7.35
7
2.03E-07 2.78E-07 1.72E-07 2.05E-04 -6.76 -3.69 23.1 7.31
2.03E-07 2.76E-07 1.67E-07 2.39E-04 -6.78 -3.62 23.1 7.31
1.82E-06 2.79E-06 1.60E-06 1.43E-03 -5.79 -2.84 23.4 7.31
1.82E-06 2.62E-06 1.43E-06 2.57E-03 -5.84 -2.59 23.4 7.31
1.71E-10 1.81E-10 1.73E-10 n.s. -9.76 n.s. 20.9 3.98
1.71E-10 1.84E-10 1.75E-10 n.s. -9.76 n.s. 20.9 3.98
1.57E-10 1.57E-10 1.69E-10 n.s. -9.77 n.s. 21.6 4.87
1.57E-10 1.55E-10 1.65E-10 n.s. -9.78 n.s. 21.6 4.87
1.45E-10 1.39E-10 1.43E-10 1.88E-08 -9.85 -7.73 22.3 5.78
1.48E-10 1.28E-10 1.33E-10 9.49E-08 -9.88 -7.02 20.9 6.77
1.48E-10 1.29E-10 1.34E-10 8.93E-08 -9.87 -7.05 20.9 6.77
1.74E-10 1.22E-10 1.38E-10 2.38E-07 -9.86 -6.62 22.5 7.75
1.34E-10 1.13E-10 1.04E-10 1.96E-07 -9.98 -6.71 22.0 7.89
3.17E-11 2.89E-11 2.84E-11 2.16E-08 -10.55 -7.67 22.3 7.5
3.17E-11 2.75E-11 2.78E-11 2.60E-08 -10.56 -7.59 22.3 7.5
83
9 Kaplan and Mattigod’s original data 84
Table S8 Concentrations reported by Kaplan and Mattigod (1998) for Tl(I) speciation 85
calculation in the dissolved phase in selected natural water systems. Authors reported the 86
following references for water composition: Groundwater and lake water (Stumm and Morgan 87
1981); river water (Hem 1985); bog water (Thurman 1985); seawater (Nordstrom et al., 1979); 88
organic carbon (Thurman 1985). 89
Groundwater River water Eutrophic Lake
Water Bog water Seawater [Tl(I)]tot (mol/L) 3.55 .10-8 9.79 .10-11 9.79 .10-11 9.79 .10-11 6.36 .10-11
[Ca] (mg/L) 59 15 40 0.2 422 [Mg] (mg/L) 26 4.1 10 0.19 1,322 [Na] (mg/L) 22 6.3 9 1.5 11,020 [K] (mg/L) 4 2.3 2 0.31 408 [CO3] (mg/L) 266 57 122 0.06 145 [SO4] (mg/L) 108 11 24 0.53 2,775 [Cl] (mg/L) 11 7.8 9 0.99 19,805 [F] (mg/L) 0.1 1 1 0.1 1.4
8 [NO3] (mg/L) 39 1 3.4 1 0.3 [PO4] (mg/L) 0.1 0.0767 0.6 0.0767 0.0614 [H4SiO4] (mg/L) 48 20.8 2 20.8 4.4 Org. Carbon (mg/L) 0.7 5.0 10.0 30.0 0.5 pH 7.14 8.01 7.70 3.60 8.22 90
10 Constants and associated references used in this paper 91
Table S9 Table of constant used in Tl(I) speciation modeling with ECOSAT software. 92
Reaction logK (298.15K) Reference
Tl+ + OH- T OH 0.63 This study Tl+ + SO 42- T SO4- 1.37 a Tl+ + Cl- T C (a ) 0.51 a Tl+ + 2Cl- T C 2- 0.28 a Tl+ + CO 32- T CO3- 2.16 a Tl+ + 2CO 32- T (CO3)23- 0.11 a Tl+ + HCO 3- T HCO3 0.90 a Tl+ + HPO 42- T HPO4- 1.27 b Tl+ + PO 43- T PO42- 3.54 c Tl+ + F- TlF 0.10 c Tl+ + Cit3- T Ci2- 2.00 c Tl+ + Ox2- T O - 1.39 b Tl+ + Ac- T Ac0 -0.11 c Tl+ + 2SO 42- + 3Fe3+ + 6OH T Fe3(SO4)2(OH)6(s) 3.36 b Tl+ + 2SO 42- + 3Al3+ + 24H+ T A (SO4)212H2(s) 7.46 c Tl+ + OH- T OH( ) 1.08 c Tl+ + Cl- T C (s) -3.65 b 2Tl+ + CO 32- T2CO3(s) 3.84 d 2Tl+ + SO 42- T2SO4(s) 3.79 a Tl+ + NO 3- T NO3(s) 1.06 b
* Calculated from Gibbs free energy of formation 93
a: Lin and Nriagu, (1999); b: Vink, (1983); c: Xiong, (2009) and d: Casiot et al., (2011) 94
![Fig. 3 Log [metal bound] calculated with NICA-Donnan generic parameters for humic acids 641](https://thumb-eu.123doks.com/thumbv2/123doknet/14738897.575604/23.892.108.788.627.859/metal-bound-calculated-nica-donnan-generic-parameters-humic.webp)

![Table S7 Experimental data acquired for Tl(I) and used for calculations. n.s. not significant 82 [Tl] donor, eq (mol/L) [Tl] acceptor, eq (mol/L) [Tl] free,don, eq(mol/L) [Tl] complexed(mol/kg) log[Tl] free(mol/L) log[Tl] complexed(mol/kg) T avg](https://thumb-eu.123doks.com/thumbv2/123doknet/14738897.575604/30.892.115.791.166.848/table-experimental-acquired-calculations-significant-acceptor-complexed-complexed.webp)