HAL Id: hal-02148590
https://hal.univ-lille.fr/hal-02148590
Submitted on 7 Jun 2021
HAL is a multi-disciplinary open access
archive for the deposit and dissemination of
sci-entific research documents, whether they are
pub-lished or not. The documents may come from
teaching and research institutions in France or
abroad, or from public or private research centers.
L’archive ouverte pluridisciplinaire HAL, est
destinée au dépôt et à la diffusion de documents
scientifiques de niveau recherche, publiés ou non,
émanant des établissements d’enseignement et de
recherche français ou étrangers, des laboratoires
publics ou privés.
Distributed under a Creative Commons Attribution| 4.0 International License
A new pharmacokinetic model for 90 Y-ibritumomab
tiuxetan based on 3-dimensional dosimetry
Franck Morschhauser, Berengere Dekyndt, Clio Baillet, Christine Barthelemy,
E Malek, J Fulcrand, P Bigot, Damien Huglo, Bertrand Decaudin, Nicolas
Simon, et al.
To cite this version:
Franck Morschhauser, Berengere Dekyndt, Clio Baillet, Christine Barthelemy, E Malek, et al.. A new
pharmacokinetic model for 90 Y-ibritumomab tiuxetan based on 3-dimensional dosimetry. Scientific
Reports, Nature Publishing Group, 2018, Scientific Reports, 8, pp.14860.
�10.1038/s41598-018-33160-0�. �hal-02148590�
A new pharmacokinetic model for
90
Y-ibritumomab tiuxetan based on
3-dimensional dosimetry
F. Morschhauser
1,2, B. Dekyndt
1,3, C. Baillet
1,4, C. Barthélémy
1, E. Malek
1, J. Fulcrand
1, P. Bigot
1,
D. Huglo
4, B. Décaudin
1,3, N. Simon
1,3& P. Odou
1,3Monoclonal antibodies (mAbs) are key components in several therapies for cancer and inflammatory diseases but current knowledge of their clinical pharmacokinetics and distribution in human tissues remains incomplete. Consequently, optimal dosing and scheduling in clinics are affected. With sequential radiolabeled mAb-based imaging, radiation dosing in tissues/organs can be calculated to provide a better assessment of mAb concentrations in tissues. This is the first pharmacokinetic model of 90Y-Ibritumomab tiuxetan (90Y-IT) in humans to be described, based on three-dimensional (3D)
dosimetry using single-photon emission computed-tomography coupled with computed-tomography. 19 patients with follicular lymphoma were treated initially with 90Y-IT in the FIZZ trial. Based on a
compartmental approach individualising the vascular compartment within studied organs, this study proposes a reliable pharmacokinetic (PK) five-compartment model replacing the currently used two-compartment model and constitutes a new direction for further research. This model provides exchange constants between the different tissues, Area Under the Curve of 111In-IT in blood (AUC) and Mean
Residence Time (MRT) that have not been reported so far for IT. Finally, the elimination process appears to occur in a compartment other than the liver or the spleen and suggests the metabolism of mAbs may take place mainly on the vascular compartment level.
Monoclonal antibodies (mAbs) whether alone or coupled with radioistopes or cytotoxic drugs1,2 are key
com-ponents in therapies for many cancers and inflammatory diseases. In spite of their widespread clinical use, lit-erature on mAb clinical pharmacokinetics (PK) remains sparse and little is known about mAb distribution in tissues3–5, which considerably complicates the defining of optimal mAb dosing and scheduling in clinical
prac-tice. Non-compartmental analysis, the most common approach to analysing PK data in drug development, requires a large amount of data and samples per individual to obtain precise PK parameter estimations and is inadequate for studying mAb behaviour6. With compartmental analysis, The mAb standard PK model is a
two compartment model (central and peripheral), which can assess mAb kinetics in blood but not their distri-bution in tissues. Fronton et al.7 showed that this model is not compliant with current knowledge. Sequential
imaging of radiolabeled mAbs in vivo means that the absorbed radiation dose as well as mAb concentrations can be calculated8–11. Radioimmunotherapy (RIT) - a targeted therapy using monoclonal antibodies (mAbs)
directed to tumor-associated antigens to deliver irradiation from radionucleides to the tumor - is therefore a particularly attractive tool to modelise mAb PK in patients. For many years, two-dimensional (2D) imaging (planar whole-body scintigraphy (anterior and posterior views))12 has been the method of choice for dosimetric
studies in RIT despite significant uncertainties in organ volume measurements affecting the accuracy of dosi-metric estimates. Nowadays, it is possible to obtain more accurate radiation dose estimation in tissues/organs with three-dimensional (3D) dosimetry using single-photon emission computed-tomography coupled with computed-tomography (SPECT-CT)13–16, or Positron Emission Tomography coupled with computed-tomography
(PET-CT)17,18.
1Univ. Lille, CHU Lille, EA 7365 – GRITA – Groupe de Recherche sur les formes Injectables et les Technologies
Associees, Lille, France. 2Haematology Department, Hôpital Claude Huriez, CHU Lille, F-59000, Lille, France. 3Pharmacy Institute, CHU Lille, F-59000, Lille, France. 4Nuclear Medicine department, Hôpital Claude Huriez, CHU
Received: 28 February 2018 Accepted: 7 September 2018 Published: xx xx xxxx
www.nature.com/scientificreports/
Accurate mAb PK modeling requires individualised estimations of antibody concentrations in the vascular compartment within each organ. This individualising appears feasible with dosimetric studies19 but has not been
applied in 3D dosimetric studies so far.
Yttrium 90 - Ibritumomab tiuxetan (Y90-IT) is a drug consisting of a murine anti-CD20 antibody (ibritu-momab) linked to a chelator (tiuxetan) radiolabeled with 90-Yttrium (YTRACIS, Curium Pharma) according to the method described in the Zevalin monograph (ZEVALIN, Spectrum Pharmaceuticals BV) for therapy or 111-Indium for imaging (Indium 111 Chlorure, Curium Pharma) according to the method described by Ferrer
et al.20. It has been approved for the treatment of follicular lymphoma (FL) in case of relapse or refractory disease
or to consolidate first-line therapy. The recently reported FIZZ Study showed that fractionated RIT is effective as initial treatment for advanced-stage FL in patients with a high tumor burden21. Following the protocol, a subset
of FIZZ patients underwent a patient-specific 3D dosimetric study.
This is the first description of a pharmacokinetic model of 90Y-Ibritumomab tiuxetan in humans, based on
dosimetric and 3D-imaging data obtained from FIZZ patients, coupled with a pharmacokinetic compartmental approach and individualising the vascular compartment within the organs studied. This method allows describ-ing all compartments in which mAb was measured.
Results
Patients.
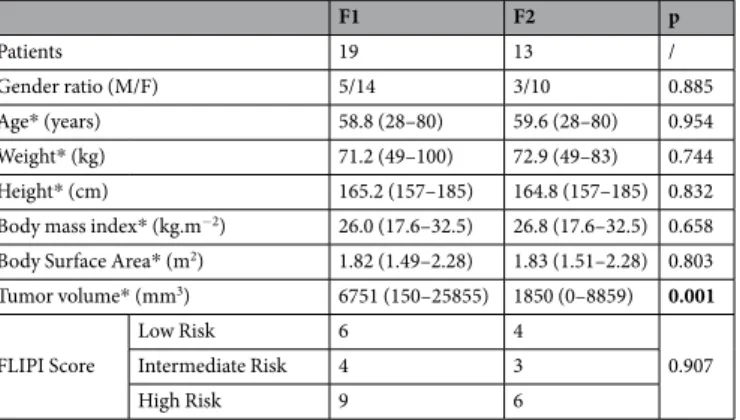
3D imaging data after the first fraction (F1) of RIT was available for 19 patients and after the 2 fractions (F1 and F2) for 13 patients since the second fraction was cancelled for 6 patients due to hematologic toxicity after F1 or the development of HAMA. Baseline characteristics are listed in Table 1. Only tumor volume is significantly different between F1 and F2 (6751 and 1850 mm3 respectively).Concentration-time profiles.
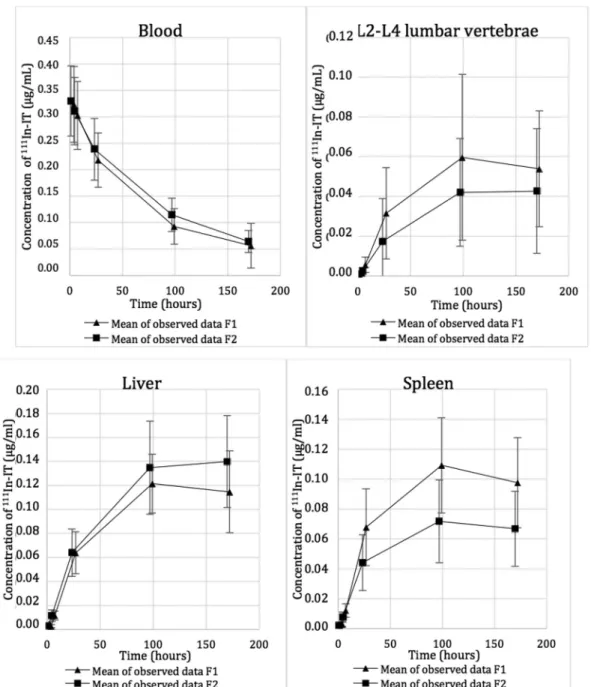
Estimated blood volumes of lumbar vertebrae L2-L4 (8.15 mL), liver (485 mL) and spleen (81.5 mL) are shown in Table 2.The calculation method for mAb amount in blood vessels within organs and tissues is shown in Fig. 1. Radiolabeled mAb concentrations in blood and organs (concentration-time profiles) are reported in Fig. 2.
Pharmacokinetic model.
The model selected with Kinetica®
software to best predict the biodistribution of Ibritumomab tiuxetan is shown in Fig. 3. This model is a 5-compartment model (including blood, bone-vertebrae L2-L4, liver, spleen plus a deep compartment). In this model, ibritumomab tiuxetan is infused into blood. The vascular compartment is considered as the central compartment, from which mAbs diffuse in both directions to other compartments, except for the spleen. Radiolabeled mAbs diffuse into the spleen from the blood and are cleared by the liver. The pharmacokinetic constants are order one constants. The deep compartment (number 5) includes the remaining organs and the tumor.Pharmacokinetic parameters.
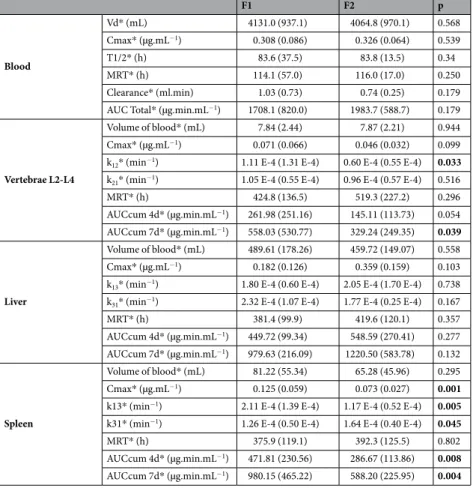
The pharmacokinetic parameters for the various compartments (blood, L2-L4 vertebrae, liver and spleen) from Kinetica®
software are reported in Table 3. Some parameters are signifi-cantly different from F1 to F2, especially for the vertebrae L1-L2 (the distribution constant k12 and the AUCcum7d* (µg.min.mL−1) are higher for F1 than F2) and Spleen compartments (the Cmax, the distribution constant,
the AUCcum 4d and AUCcum 7d are higher for F1 than F2 and the elimination constant is lower for F1 than F2).
F1 F2 p Patients 19 13 / Gender ratio (M/F) 5/14 3/10 0.885 Age* (years) 58.8 (28–80) 59.6 (28–80) 0.954 Weight* (kg) 71.2 (49–100) 72.9 (49–83) 0.744 Height* (cm) 165.2 (157–185) 164.8 (157–185) 0.832 Body mass index* (kg.m−2) 26.0 (17.6–32.5) 26.8 (17.6–32.5) 0.658 Body Surface Area* (m2) 1.82 (1.49–2.28) 1.83 (1.51–2.28) 0.803 Tumor volume* (mm3) 6751 (150–25855) 1850 (0–8859) 0.001 FLIPI Score Low Risk 6 4 0.907 Intermediate Risk 4 3 High Risk 9 6
Table 1. Patient characteristics at baseline. *Mean (range).
Area Lumbar vertebrae L2-L4 Liver Spleen
Blood in corresponding volume* (mL) 8.15 (2.81) 485 (174) 81.5 (53.7) Blood in mL.g−1 of organ* 0.15 (0.03) 0.29 (0.05) 0.28 (0.04)
Discussion
Among the thirty pharmacokinetic models assessed, the best pharmacokinetic model according to the AKAIKE test, validated on both RIT fractions, is a five-compartment model close to a mammalian PK model, except for the spleen. It provides exchange constants between the different tissues, AUC and MRT that have not yet been reported for Ibritumomab tiuxetan. Very little data is available on the elimination pathways of therapeutic mAbs. In our model, which individualises the vascular compartment within organs, the elimination process appears to be performed by a compartment other than that of the liver or the spleen and suggests the metabolism of mAbs may take place mainly on the vascular compartment level. This finding is in keeping with published data suggest-ing that monoclonal antibodies may be metabolised in the vascular compartment by endothelial cells and, to a much lesser extent (5.9%) urinary excretion22–27. Other studies, investigating the exact amount of urinary
excre-tion through urinary sampling could provide further details on eliminaexcre-tion pathways. However, biliary and renal excretions are known to be minimal22–25.
The pharmacokinetic parameters of the model concord with data in literature, thereby confirming its reliabil-ity. The mean blood half-life of 111In-ibritumomab tiuxetan is 83.6 and 83.8 hours for F1 and F2, respectively and
varies between 20 and 140 hours in the literature24,28. The volume of blood in the liver (489.61 mL and 459.72 mL
for F1 and F2 respectively) and in the spleen (81.22 mL and 65.28 mL) are in keeping with previously published estimates25. The Volumes of distribution (Vd) estimated by our model are 4131.0 and 4064.3 mL for F1 and F2,
respectively. These figures are slightly lower than published data (5000–10000 mL29). Nevertheless the calculated
volumes of distribution (our results and published data) remain small, suggesting a limited distribution outside the blood29,30 (29,30)(28,29). These results can be accounted for by mAb properties such as high molecular mass
and hydrophilicity/polarity ratio. Other parameters cannot be compared with scientific literature as they are rarely described.
Although our 5-compartment model is a step forward compared to the previous 2-compartment model, there are clear limitations. First, in dosimetric studies, the data used to delineate organs is usually obtained with few samples: three31,32, four30, five24,33,34 or even fewer35 but this reduced sampling can prove limiting for
phar-macokinetic studies. The number of image acquisitions was four (4 hours, 1, 4 and 7 days after infusions) The extrapolation method to determine the amount of blood in organs would have been more precise if imaging had been performed 1 hour after infusion, instead of 4 hours but this is problematic given the possible occurrence of infusion-related reactions to mAb. Also, the dosimetric study was limited to 7 days (taking into account the radioactive period of Indium 111 which is 67 hours). The presence of residual blood activity prevented a pre-cise calculation of the elimination constants since the completed diffusion phase could not be assessed. It has to be acknowledged that 4 samples is already considerable as a whole body SPECT/CT examination is a time/ device-consuming procedure (about 1 hour per image) and an inconvenience to patients.
A second limitation is that the compartment representing the tumor was not individualised. Tumor volume was significantly lower before F2 than F1 (1850 and 6751 mm3 respectively), as a consequence of tumor reduction
after the first RIT fraction36. It should be noted that mAb concentrations were higher in blood and liver and lower
in the spleen and lumbar vertebrae at F2 with significant changes in the PK parameters of “L2-L4 vertebrae” and “spleen”. This may be explained by tumor regression during the time between F1 and F2 which would modify the fifth compartment. Another study has revealed baseline metabolic tumor volume influence on mAb exposure37.
Evaluating radiolabeled mAb distribution in the tumor compartment is difficult and tedious, in particular for small tumors. PET imaging would yield more precise quantifications due to its better spatial resolution than
Figure 1. Subtraction of the blood constituent of Ibritumomab tiuxetan from total organ to obtain the
www.nature.com/scientificreports/
Figure 2. Evolution of 111In-IT concentration in blood and organ tissues.
study was first designed with the development of Zr89 labelled mAbs resulting in PET biodistribution studies38,39.
It should therefore be easier to estimate the volume of tumoral lesions and, their evolution as well as modifications in radiolabeled mAb kinetics from one fraction to the other. A study has shown that CD20 expression can be induced by low dose gamma-radiation which could account for the difference in antibody distribution between the F1 and F2 fractions40. Another explanation could be metabolisation by the internalising41 of surface CD20
receptors following their association with an anti-CD20 antibody or CD20 modulation42.
The PK parameters described in this study are numerous and relevant and constitute a background for further research. The study proposes a reliable pharmacokinetic five-compartment model of 90Y-Ibritumomab tiuxetan.
The main limitation to the model concerns the tumor compartment, which is not separated from the rest of the tissues. Differences in dosimetry and pharmacokinetic parameters (radiolabeled mAb concentrations, diffusion and elimination) for certain tissues might be better clarified with further investigations based on immunoPET and broader biological sampling.
Material and Methods
Patients.
Patients with histologically confirmed CD20-positive Follicular Lymphoma were included in the FIZZ study (NCT01493479 and Northwest Ethical Research Comittee IV)36.The FIZZ study was a multi-centre, non-randomised prospective phase II study of fractionated
90Y-Ibritumomab tiuxetan as the initial therapy for follicular lymphoma (FL) in patients in need of treatment
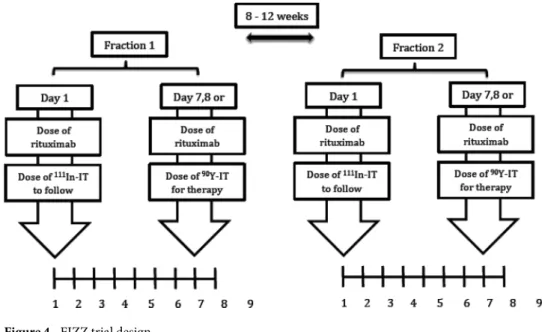
according to GELF/BNLI criteria. Briefly, treatment consisted of 2 infusions, termed fraction 1 (F1) and 2 (F2) of
90Y-ibritumomab tiuxetan (11.1 MBq/kg per fraction; maximal dose 888 MBq) given 8–12 weeks apart (Fig. 4)
provided the platelet count was >150 × 109/L (2nd infusion) and neutrophil count >1.5 × 10⁹/L. Occurrence of
grade 3 or grade 4 myelotoxicity after 2 weeks, or a Human anti-mouse antibody (HAMA) reaction led to exclu-sion from a second 90Y-ibritumomab tiuxetan infusion. Patients with >20% lymphoma infiltration of bone
mar-row (BM) received 4 weekly infusions of Rituximab (375 mg/m2) (RTX) and proceeded to fractionated RIT only
if a repeat BM biopsy demonstrated clearing of lymphoma to <20% involvement. Each 90Y-ibritumomab tiuxetan
fraction was preceded by two rituximab infusions (250 mg/m2) given 7–8 days apart, the second infusion given
immediately prior to 90Y-ibritumomab tiuxetan in order to saturate the binding sites of circulating anti-CD20
antibodies.
Dosimetric study.
Raw data used to establish a pharmacokinetic model of 90Y-Ibritumomab tiuxetan (IT) was obtained from the patients included in the FIZZ trial at Lille university hospital.F1 F2 p Blood Vd* (mL) 4131.0 (937.1) 4064.8 (970.1) 0.568 Cmax* (µg.mL−1) 0.308 (0.086) 0.326 (0.064) 0.539 T1/2* (h) 83.6 (37.5) 83.8 (13.5) 0.34 MRT* (h) 114.1 (57.0) 116.0 (17.0) 0.250 Clearance* (ml.min) 1.03 (0.73) 0.74 (0.25) 0.179 AUC Total* (µg.min.mL−1) 1708.1 (820.0) 1983.7 (588.7) 0.179
Vertebrae L2-L4
Volume of blood* (mL) 7.84 (2.44) 7.87 (2.21) 0.944 Cmax* (µg.mL−1) 0.071 (0.066) 0.046 (0.032) 0.099 k12* (min−1) 1.11 E-4 (1.31 E-4) 0.60 E-4 (0.55 E-4) 0.033 k21* (min−1) 1.05 E-4 (0.55 E-4) 0.96 E-4 (0.57 E-4) 0.516
MRT* (h) 424.8 (136.5) 519.3 (227.2) 0.296 AUCcum 4d* (µg.min.mL−1) 261.98 (251.16) 145.11 (113.73) 0.054 AUCcum 7d* (µg.min.mL−1) 558.03 (530.77) 329.24 (249.35) 0.039 Liver Volume of blood* (mL) 489.61 (178.26) 459.72 (149.07) 0.558 Cmax* (µg.mL−1) 0.182 (0.126) 0.359 (0.159) 0.103 k13* (min−1) 1.80 E-4 (0.60 E-4) 2.05 E-4 (1.70 E-4) 0.738 k31* (min−1) 2.32 E-4 (1.07 E-4) 1.77 E-4 (0.25 E-4) 0.167
MRT* (h) 381.4 (99.9) 419.6 (120.1) 0.357 AUCcum 4d* (µg.min.mL−1) 449.72 (99.34) 548.59 (270.41) 0.277 AUCcum 7d* (µg.min.mL−1) 979.63 (216.09) 1220.50 (583.78) 0.132 Spleen Volume of blood* (mL) 81.22 (55.34) 65.28 (45.96) 0.295 Cmax* (µg.mL−1) 0.125 (0.059) 0.073 (0.027) 0.001 k13* (min−1) 2.11 E-4 (1.39 E-4) 1.17 E-4 (0.52 E-4) 0.005 k31* (min−1) 1.26 E-4 (0.50 E-4) 1.64 E-4 (0.40 E-4) 0.045
MRT* (h) 375.9 (119.1) 392.3 (125.5) 0.802
AUCcum 4d* (µg.min.mL−1) 471.81 (230.56) 286.67 (113.86) 0.008 AUCcum 7d* (µg.min.mL−1) 980.15 (465.22) 588.20 (225.95) 0.004
www.nature.com/scientificreports/
Following protocol, a subset of FIZZ patients underwent a patient-specific 3D dosimetric study with 138 MBq of 111In-ibritumomab tiuxetan (111In–ibritumomab tiuxetan administered intravenously concomitantly with the
first rituximab infusion) for both 90Y- ibritumomab tiuxetan fractions21.
Radiolabeling.
Radiolabeling was performed with 222 MBq of 111In for 1.6 mg ibritumomab tiuxetan(spe-cific activity of 138 MBq/mg). The radiochemical purity threshold for injection to the patient was set at 95%.
Imaging method.
Whole body Single-photon emission computed- tomography (SPECT)/ Computed-Tomography (CT) (MEAP colimaters, Siemens medical solution, Symbia T2, Erlangem, Germany) was performed at 4 hours, 24 h, 96 h and 168 h after infusions. A CT scan was performed to delineate the organs of interest (liver, spleen, bone marrow) plus tumor volume. Concentration of radioactivity in each of these organs was determined on SPECT imaging by the count number in the respective volumes21. The absorbed bone marrowdose was assessed on the L2-L4 lumbar area according to Shen et al.43.
The accurate processing of 3D images to confirm absorbed-dose calculations (using CT images to estimate patient-specific organ and bone marrow volumes) was centralised in the CRCNA laboratory (Nantes) as previ-ously21. All patients provided informed written consent. Ethics approval was granted in accordance with French
and UK Medical Research Council guidelines and the Declaration of Helsinki (NCT01493479). All methods were performed in accordance with the relevant guidelines and regulations.
Blood samples study.
Blood vessel compartment in each organ. Antibody diffusion was assumed to consistof a vascular phase (from a few minutes until one hour after injection) and a tissue phase. After one hour, when antibody concentration in blood is maximal and before the tissue phase, the blood volume in each organ was extrapolated, by dividing the amount of 111In-IT in the whole organ (whole body SPECT/CT performed 4 hours
after injection) by the concentration of 111In-IT in peripheral blood (sample taken 1 h after injection). Organ mass
was determined using the CT scan.
Determination of amounts of radiolabeled mAbs in blood. The amount of radioelement in peripheral blood was
calculated through decay correction and correspondence between mass and activity (activity concentration). Blood radioactivity was determined using a well counter (Packard Cobra Gamma counter, GMI Inc, Minnesota, USA) (efficiency = 93.3%). Radiolabeled antibodies were considered to be the only source of radioactivity in blood samples. The amount of 111In-ibritumomab tiuxetan in blood was then calculated as follows.
= . × − . Am Ac e MAc /0 933 ibr ln(2)t T1/2in Where:
• Amibr is the amount of 111In-Ibritumomab tiuxetan, expressed in milligrams in the blood sample.
• Ac is the detected radioactivity, expressed in MBq. • Tin
1/2 is the radioactive half-life of 111In.
• MAc is the activity concentration. Here, the value was 138 MBq/mg.
At each sampling time, amounts of radiolabeled mAbs in blood in organs were calculated as follows: = ×
Amibr Blood in organ Amibr VBlood in the organ
Determination of amounts of radiolabeled mAbs in tissues. The amount of mAbs in each tissue was determined
by substracting the amount of radiolabeled mAbs in blood from the total amount of radiolabeleld mAbs in organs at each sampling time.
Pharmacokinetic model building and Modelling.
The Designer module of Kinetica®
soft-ware v5.0 (Thermo Fisher Scientific) was used to estimate the PK parameters of Ibritumomab tiuxetan from radiolabeled-mAb blood and organ concentrations. The quality of PK models was assessed by the Akaike Information Criterion (AIC). The best AIC score (43) indicated the most accurate model to describe PK data. The model was built from pharmacokinetic parameters which were evaluated for each patient.These are expressed as
• kx1x2 being the order one rate constant from the x1 compartment to the x2 compartment.
• x1, x2, x3, x4 and x5 respectively represent blood, L2-L4 vertebrae, liver, spleen and a deep compartment,
con-sidered as the other compartments of the organism (including tumor volume). • kel is the elimination constant rate from the blood compartment (order one).
• Vd is the distribution volume (Vd).
• T1/2 is the mAb biological half-life.
• CLT is the total clearance.
• AUC is the total Area Under the Curve of 111In-Ibritumomab tiuxetan in blood.
Organ blood volumes were measured. The cumulated AUC at four (AUCcum 4d) and seven (AUCcum 7d) days after injection of 111In-Ibritumomab tiuxetan was calculated.
For each compartment, the Mean Residence Time (MRT) and maximal concentration (Cmax) of
111In-Ibritumomab tiuxetan were calculated.
Statistical analysis.
Data obtained after F1 and F2 was not pooled and the pharmacokinetic model was first established on data obtained after F1, followed by that obtained after F2. Parameters are expressed as mean values and standard deviation or mean values and range of variation. They were compared using the bilateral non-parametric Mann–Whitney test (α = 0.05) with XLSTAT®
software (version 2012.2.03, Addinsoft).References
1. Kuroki, M. et al. Possible applications of antibodies or their genes in cancer therapy. Anticancer Res. 26, 4019–4025 (2006). 2. Guillemard, V. & Saragovi, H. U. Novel approaches for targeted cancer therapy. Curr. Cancer Drug Targets 4, 313–326 (2004). 3. Keizer, R. J., Huitema, A. D. R., Schellens, J. H. M. & Beijnen, J. H. Clinical pharmacokinetics of therapeutic monoclonal antibodies.
Clin. Pharmacokinet. 49, 493–507 (2010).
4. Paintaud, G. Pharmacokinetics (PK) of mAbs. Med. Sci. MS 25, 1057–1062 (2009).
5. Dostalek, M., Gardner, I., Gurbaxani, B. M., Rose, R. H. & Chetty, M. Pharmacokinetics, pharmacodynamics and physiologically-based pharmacokinetic modelling of monoclonal antibodies. Clin. Pharmacokinet. 52, 83–124 (2013).
6. Davda, J. P., Dodds, M. G., Gibbs, M. A., Wisdom, W. & Gibbs, J. A model-based meta-analysis of monoclonal antibody pharmacokinetics to guide optimal first-in-human study design. mAbs 6, 1094–1102 (2014).
7. Fronton, L., Pilari, S. & Huisinga, W. Monoclonal antibody disposition: a simplified PBPK model and its implications for the derivation and interpretation of classical compartment models. J. Pharmacokinet. Pharmacodyn. 41, 87–107 (2014).
8. Sepp, A., Berges, A., Sanderson, A. & Meno-Tetang, G. Development of a physiologically based pharmacokinetic model for a domain antibody in mice using the two-pore theory. J. Pharmacokinet. Pharmacodyn. 42, 97–109 (2015).
9. Garg, A. & Balthasar, J. P. Physiologically-based pharmacokinetic (PBPK) model to predict IgG tissue kinetics in wild-type and FcRn-knockout mice. J. Pharmacokinet. Pharmacodyn. 34, 687–709 (2007).
10. Kletting, P., Bunjes, D., Reske, S. N. & Glatting, G. Improving anti-CD45 antibody radioimmunotherapy using a physiologically based pharmacokinetic model. J. Nucl. Med. Off. Publ. Soc. Nucl. Med. 50, 296–302 (2009).
11. Kletting, P. et al. Radioimmunotherapy with anti-CD66 antibody: improving the biodistribution using a physiologically based pharmacokinetic model. J. Nucl. Med. Off. Publ. Soc. Nucl. Med. 51, 484–491 (2010).
12. Fleming, J. S. A technique for the absolute measurement of activity using a gamma camera and computer. Phys. Med. Biol. 24, 176–180 (1979).
13. Da Silva, A. J. et al. Absolute quantification of regional myocardial uptake of 99mTc-sestamibi with SPECT: experimental validation in a porcine model. J. Nucl. Med. Off. Publ. Soc. Nucl. Med. 42, 772–779 (2001).
14. Ritt, P., Vija, H., Hornegger, J. & Kuwert, T. Absolute quantification in SPECT. Eur. J. Nucl. Med. Mol. Imaging 38(Suppl 1), S69–77 (2011).
15. Shcherbinin, S., Celler, A., Belhocine, T., Vanderwerf, R. & Driedger, A. Accuracy of quantitative reconstructions in SPECT/CT imaging. Phys. Med. Biol. 53, 4595–4604 (2008).
16. Zeintl, J., Vija, A. H., Yahil, A., Hornegger, J. & Kuwert, T. Quantitative accuracy of clinical 99mTc SPECT/CT using ordered-subset expectation maximization with 3-dimensional resolution recovery, attenuation, and scatter correction. J. Nucl. Med. Off. Publ. Soc.
Nucl. Med. 51, 921–928 (2010).
17. Grudzinski, J. J. et al. Application of a whole-body pharmacokinetic model for targeted radionuclide therapy to NM404 and FLT.
Phys. Med. Biol. 57, 1641–1657 (2012).
18. Tian, M. et al. Whole-body biodistribution kinetics, metabolism, and radiation dosimetry estimates of 18F-PEG6-IPQA in nonhuman primates. J. Nucl. Med. Off. Publ. Soc. Nucl. Med. 52, 934–941 (2011).
19. Nickel, M. et al. Development and evaluation of a pharmacokinetic model for prediction of radioimmunotherapy based on pretherapy data. Cancer Biother. Radiopharm. 24, 111–122 (2009).
20. Fink-Bennett, D. M. & Thomas, K. 90Y-ibritumomab tiuxetan in the treatment of relapsed or refractory B-cell non-Hodgkin’s
www.nature.com/scientificreports/
21. Ferrer, L. et al. Comparisons of dosimetric approaches for fractionated radioimmunotherapy of non-Hodgkin lymphoma. Q. J. Nucl.
Med. Mol. Imaging Off. Publ. Ital. Assoc. Nucl. Med. AIMN Int. Assoc. Radiopharmacol. IAR Sect. Soc. Of 56, 529–537 (2012).
22. McKeage, K. & Perry, C. M. Trastuzumab: a review of its use in the treatment of metastatic breast cancer overexpressing HER2.
Drugs 62, 209–243 (2002).
23. Gupta, A. K., Lad, V. J. & Koshy, A. A. Protection of mice against experimental Japanese encephalitis virus infections by neutralizing anti-glycoprotein E monoclonal antibodies. Acta Virol. 47, 141–145 (2003).
24. Wiseman, G. A. et al. Biodistribution and dosimetry results from a phase III prospectively randomized controlled trial of Zevalin radioimmunotherapy for low-grade, follicular, or transformed B-cell non-Hodgkin’s lymphoma. Crit. Rev. Oncol. Hematol. 39, 181–194 (2001).
25. Villeneuve, J. et al. The hepatic microcirculation in the isolated perfused human liver. Hepatology 23, 24–31 (1996).
26. Brambell, F. W., Hemmings, W. A. & Morris, I. G. A Theoretical Model of Gamma-Globulin Catabolism. Nature 203, 1352–1354 (1964).
27. Junghans, R. P. & Waldmann, T. A. Metabolism of Tac (IL2Ralpha): physiology of cell surface shedding and renal catabolism, and suppression of catabolism by antibody binding. J. Exp. Med. 183, 1587–1602 (1996).
28. Watanabe, T. et al. Phase I study of radioimmunotherapy with an anti-CD20 murine radioimmunoconjugate ((90)Y-ibritumomab tiuxetan) in relapsed or refractory indolent B-cell lymphoma. Cancer Sci. 96, 903–910 (2005).
29. Meibohm, B. Pharmacokinetics and Pharmacodynamics of Biotech Drugs: Principles and Case Studies in Drug Development. (John Wiley & Sons, 2006).
30. Arrichiello, C. et al. Feasibility of bremsstrahlung dosimetry for direct dose estimation in patients undergoing treatment with
90Y-ibritumomab tiuxetan. Eur. J. Nucl. Med. Mol. Imaging 39, 956–966 (2012).
31. Conti, P. S. et al. The role of imaging with (111)In-ibritumomab tiuxetan in the ibritumomab tiuxetan (zevalin) regimen: results from a Zevalin Imaging Registry. J. Nucl. Med. Off. Publ. Soc. Nucl. Med. 46, 1812–1818 (2005).
32. Fisher, D. R., Shen, S. & Meredith, R. F. MIRD dose estimate report No. 20: radiation absorbed-dose estimates for 111In- and 90Y-ibritumomab tiuxetan. J. Nucl. Med. Off. Publ. Soc. Nucl. Med. 50, 644–652 (2009).
33. Minarik, D. et al. 90Y Bremsstrahlung imaging for absorbed-dose assessment in high-dose radioimmunotherapy. J. Nucl. Med. Off. Publ. Soc. Nucl. Med. 51, 1974–1978 (2010).
34. Cremonesi, M. et al. High-dose radioimmunotherapy with 90Y-ibritumomab tiuxetan: comparative dosimetric study for tailored
treatment. J. Nucl. Med. Off. Publ. Soc. Nucl. Med. 48, 1871–1879 (2007).
35. Rizvi, S. N. F. et al. Biodistribution, radiation dosimetry and scouting of 90Y-ibritumomab tiuxetan therapy in patients with relapsed
B-cell non-Hodgkin’s lymphoma using 89Zr-ibritumomab tiuxetan and PET. Eur. J. Nucl. Med. Mol. Imaging 39, 512–520 (2012). 36. Morschhauser, F. et al. 90Yttrium-ibritumomab tiuxetan consolidation of first remission in advanced-stage follicular non-Hodgkin
lymphoma: updated results after a median follow-up of 7.3 years from the International, Randomized, Phase III First-LineIndolent trial. J. Clin. Oncol. Off. J. Am. Soc. Clin. Oncol. 31, 1977–1983 (2013).
37. Tout, M. et al. Rituximab exposure is influenced by baseline metabolic tumor volume and predicts outcome of DLBCL patients: a LYSA study. Blood, https://doi.org/10.1182/blood-2016-10-744292 (2017).
38. Menke-van der Houven van Oordt, C. W. et al. 89Zr-cetuximab PET imaging in patients with advanced colorectal cancer. Oncotarget
6, 30384–30393 (2015).
39. Natarajan, A. & Gambhir, S. S. Radiation Dosimetry Study of [(89)Zr]rituximab Tracer for Clinical Translation of B cell NHL Imaging using Positron Emission Tomography. Mol. Imaging Biol. MIB Off. Publ. Acad. Mol. Imaging 17, 539–547 (2015). 40. Singh, V. et al. Surface levels of CD20 determine anti-CD20 antibodies mediated cell death in vitro. PloS One 9, e111113 (2014). 41. Zettlitz, K. A. et al. ImmunoPET of Malignant and Normal B Cells with 89Zr- and 124I-Labeled Obinutuzumab Antibody
Fragments Reveals Differential CD20 Internalization In Vivo. Clin. Cancer Res. 23, 7242–7252 (2017).
42. Vaughan, A. T., Cragg, M. S. & Beers, S. A. Antibody modulation: Limiting the efficacy of therapeutic antibodies. Pharmacol. Res.
99, 269–275 (2015).
43. Shen, S. et al. Improved prediction of myelotoxicity using a patient-specific imaging dose estimate for non-marrow-targeting (90) Y-antibody therapy. J. Nucl. Med. Off. Publ. Soc. Nucl. Med. 43, 1245–1253 (2002).
Acknowledgements
The authors wish to thank the hospital staff who compiled the imaging data. The authors thank Mrs Alexandra Tavernier-Sommerville (M.A. (University of Glasgow, U.K), Professeur Agrégée (in English language), France) for the proofreading of the manuscript.
Author Contributions
Morschhauser F and Odou P designed the study. Morschhauser F, Dekyndt B, Décaudin B, Odou P wrote the manuscript. Morschhauser F, Dekyndt B, Baillet C, Barthélémy C, Malek E, Fulcrand J, Bigot P, Huglo D, Décaudin B, Simon N, Odou P contributed to the acquisition of study material, analysis, or interpretation of data for the work and approved the manuscript. All authors are accountable for all aspects of the work by ensuring that questions related to the accuracy or integrity of any part of the work are appropriately investigated and answered.
Additional Information
Competing Interests: The authors declare no competing interests.
Publisher's note: Springer Nature remains neutral with regard to jurisdictional claims in published maps and
institutional affiliations.
Open Access This article is licensed under a Creative Commons Attribution 4.0 International
License, which permits use, sharing, adaptation, distribution and reproduction in any medium or format, as long as you give appropriate credit to the original author(s) and the source, provide a link to the Cre-ative Commons license, and indicate if changes were made. The images or other third party material in this article are included in the article’s Creative Commons license, unless indicated otherwise in a credit line to the material. If material is not included in the article’s Creative Commons license and your intended use is not per-mitted by statutory regulation or exceeds the perper-mitted use, you will need to obtain permission directly from the copyright holder. To view a copy of this license, visit http://creativecommons.org/licenses/by/4.0/.