HAL Id: hal-02109070
https://hal.archives-ouvertes.fr/hal-02109070
Submitted on 24 Apr 2019
HAL is a multi-disciplinary open access
archive for the deposit and dissemination of
sci-entific research documents, whether they are
pub-lished or not. The documents may come from
teaching and research institutions in France or
abroad, or from public or private research centers.
L’archive ouverte pluridisciplinaire HAL, est
destinée au dépôt et à la diffusion de documents
scientifiques de niveau recherche, publiés ou non,
émanant des établissements d’enseignement et de
recherche français ou étrangers, des laboratoires
publics ou privés.
Activity modelling and impact on planet’s parameters
Susana Barros, Raphaëlle Haywood, M. Deleuil
To cite this version:
Susana Barros, Raphaëlle Haywood, M. Deleuil. Activity modelling and impact on planet’s
param-eters: The case of CoRoT-7. Annie Baglin. The CoRoT Legacy Book, EDP Sciences, pp.123-127,
2016, 978-2-7598-1876-1. �10.1051/978-2-7598-1876-1.c032�. �hal-02109070�
c
The authors, 2016
DOI:10.1051/978-2-7598-1876-1.c032
III.2
Activity modelling and impact on planet’s parameters
The case of CoRoT-7
S. C. C. Barros
1, 2, R. D. Haywood
3, 4, and M. Deleuil
21 Centro de Astrof´ısica, Universidade do Porto, Rua das Estrelas, 4150-762 Porto, Portugal
e-mail:[email protected]
2 Aix Marseille Universit´e, CNRS, LAM (Laboratoire d’Astrophysique de Marseille) UMR 7326, 13388, Marseille, France 3 SUPA, School of Physics and Astronomy, University of St Andrews, St Andrews KY16 9SS, UK 4 Harvard-Smithsonian Center for Astrophysics, 60 Garden Street, Cambridge, MA 02138, USA
1. Introduction
CoRoT-7b was the first transiting super-Earth discovered (L´eger et al. 2009) and is one of the most exciting plan-ets detected by CoRoT. This planet with an orbital period of ∼0.85 days was detected in the LRa01 run of CoRoT that started on 2007, October 24 and ended on 2008, March 3. The host star was found to be a young (1.2−2.3 Gyr) G9V type star with log g = 4.47 ± 0.05, [Fe/H] = 0.12 ± 0.06, Teff = 5250 ± 60 K (Bruntt et al. 2010). The star is very
active, showing a 2% amplitude variability in the LRa01 light curve. The stellar activity affected the observed tran-sits and transit derived parameters and severely affected the radial velocity (RV) follow-up observations needed to confirm the planet (Queloz et al. 2009).
The normalised transit depth is 0.01784 ± 0.00047 (Barros et al. 2014), which is approximately one third of the rms of the light curve, therefore the effect of activity in the transit is not obvious. However, it was suspected that the stellar activity also affected the derived transit param-eters of CoRoT-7b (L´eger et al. 2009) because the stellar density derived from transit fitting was found to be much lower (ρ∗ = 0.12ρ ) than the derived spectroscopic value
(ρ∗ = 1.4ρ ). This was supported by the fact that when
subsets of 4−5 transits were fitted separately, the resulting stellar density was in agreement with the expected value for a G9V type star. To avoid the underestimation of the stellar density, the spectroscopic derived radius was used as a prior in their transit fitting (L´eger et al. 2009).
The effect of stellar activity in the RVs was even more problematic. During the RV observations, the semi-amplitude of activity-induced RV variability was 20 m/s which is much larger than the expected planet RV am-plitude of ∼1.6−5.7 m/s. Several methods were developed to correct the activity-induced RV variability.Queloz et al.
(2009) applied a pre-whitening procedure followed by a har-monic decomposition. This way they obtained a planetary
mass mb = 4.8 ± 0.8 M⊕ and found a second planet
in the system with a period of 3.69 days and a mass mc= 8.4 ± 0.9 M⊕.Lanza et al.(2010) modelled the light
curve with a maximum entropy spot model and synthesised RVs. Since the modelled activity-induced RV variations did not contain periodic signals coincident with the orbital pe-riod of either CoRoT-7b nor c, their planetary nature was confirmed. Hatzes et al.(2010) showed that the full width at half-maximum (FWHM), bisector span and Ca II H&K line emission also did not contain periodicities at the planet orbital period which supported the existence of the planets. The authors suggested the existence of a third planet in the system, CoRoT-7d, with a period of 9.02 days and a mass of md = 16.7 ± 0.42 M⊕. In another paper, Hatzes et al.
(2011) used the fact that CoRoT-7b’s orbital period is much shorter than the stellar rotation period (Prot = 23.81±0.03;
Haywood et al. 2014). They assumed that on any given night, the variations in RV are solely due to the planet’s or-bital reflex motion and that the activity-induced variations can be treated as a constant offset on each night. This al-lowed to determine a mass mb= 7.42±1.21 M⊕.Pont et al.
(2011) presented another study with a maximum entropy spot model but including a correlated noise term. They ob-tained a mass mb = 2.3 ± 1.8 M⊕ which lead them to
question the significance of CoRoT-7b. The SOAP tool was used by Boisse et al. (2011) to simulate the spot induced variations in the RVs. These were used to correct for the activity and derive planetary masses mb= 5.7±2.5 M⊕and
mc= 13.2 ± 4.1 M⊕. Another version of the high-frequency
filter was applied by Ferraz-Mello et al. (2011), who ob-tained slightly higher planetary masses mb= 8.0 ± 1.2 M⊕
and mc = 13.6 ± 1.4 M⊕. A table summarising the mass
determinations for CoRoT-7b can be found inHatzes et al.
(2011). Although most of these analyses gave consistent results, it is clear that the determination of the masses of both CoRoT-7b and c strongly depends on how the activity-induced RV variations are modelled.
The CoRoT Legacy Book
To better understand and characterise this iconic sys-tem, CoRoT-7 was re-observed with the CoRoT satellite for an additional 80 days, from 2012, January 10 to 2012, March 29. This allowed us to improve our estimates of the transit parameters of CoRoT-7b, despite its shallow transits and the high levels of activity (Barros et al. 2014). Furthermore, a second HARPS campaign was carried out for 26 consecutive clear nights from 2012, January 12 to February 6 in conjunction with the CoRoT photometry. The simultaneous photometry provided unique additional information on the surface activity of the star, enabling us to model the activity-induced RV variations more faithfully and thus determining more precise and accurate masses for CoRoT-7b (as well as CoRoT-7c).
2. Stellar activity effect in the transit
parameters
Even for high signal-to-noise transit light curves of large planets, the effects of stellar activity are difficult to recog-nise and to correct as has been shown by Barros et al.
(2013). For smaller-sized planets, the effects can be larger but are even more difficult to distinguish because the individual transits are not resolved due to their lower signal-to-noise.
Stellar activity can affect the transit light curves in two different ways (Czesla et al. 2009). Dark spots or bright fac-ulae outside the transit chord (projected path of the planet in the stellar surface) alter the out-of-transit stellar flux and can introduce trends in the normalisation and an unknown offset since the real stellar flux is not accessible. Spots or faculae inside the transit chord (planet-spot occultations) will affect the transit shape. Both effects will influence the parameter estimation.
The out-of-transit stellar variability of CoRoT-7b dur-ing the LRa01 CoRoT observations was modelled by
Lanza et al. (2010) who found that the photometric vari-ability is dominated by cool spots with reduced facular contribution in comparison to the Sun. This was also con-firmed by ground-based colour-photometry acquired from Decembre 2008 to February 2009 (Queloz et al. 2009).
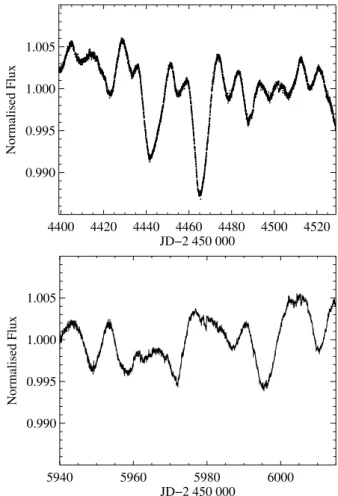
During the new observation of CoRoT-7b, the star was in a lower activity level. The light curves for both observa-tions are shown in Fig.III.2.1. During the new observation, the flux variability was 1% and the spectroscopic activity in-dex (log RHK0 ) measured in both RV data sets also decreased from −4.60 ± 0.03 to −4.73 ± 0.03. Futhermore, the spot mean latitudes have also changed (Lanza et al. 2010; Lanza et al. in prep). This resulted in the light curve of CoRoT-7 taken during LRa06 being less affected by activity.
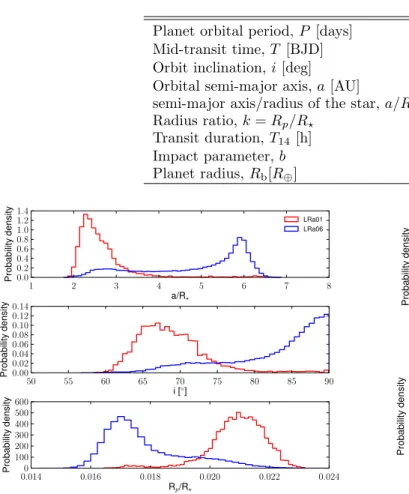
The transits observed by CoRoT in the runs LRa01 and LRa06 were modelled by Barros et al.(2014) with the PASTIS MCMC code (D´ıaz et al. 2014). To analyse the transit shape, the authors compared the posteriors of a geometric fit (no stellar prior information) of each indi-vidual observation. The parameter posterior distributions of a/R∗, i, and Rp/R∗ for LRa01 and LRa06 are shown
in Fig. III.2.2. It is obvious that the distributions are very different for the two runs. The transit-derived stellar den-sity for LRa01 is 0.27+0.17−0.10 ρ , significantly different from
that obtained for LRa06 which is 3.79+0.12−3.2 ρ . The latter is
4400 4420 4440 4460 4480 4500 4520 JD−2 450 000 0.990 0.995 1.000 1.005 Normalised Flux 5940 5960 5980 6000 JD−2 450 000 0.990 0.995 1.000 1.005 Normalised Flux
Fig. III.2.1. Light curve of CoRoT-7 binned to 30 min for clarity during the first CoRoT run LRa01 (top) and last CoRoT run LRa06 (bottom). It is clear that the variability level during LRa01 is twice that in the LRa06 CoRoT light curve. Adapted fromBarros et al.(2014) c A&A.
higher than the stellar density derived from spectroscopic analysis of the host star but consistent within the errors.
Barros et al. (2014) performed simulations assuming white noise and showed that overestimation of the stel-lar density in LRa06 is due to low signal-to-noise of the transits. In this case ingress/egress times cannot be well constrained leading to a degeneracy in the transit solu-tion. Therefore, stellar parameter priors need to be in-cluded in the transit analysis in order to derive the transit parameters.
However, in the case of LRa01, Barros et al. (2014) showed that the transit shapes were deformed. They were able to discard the low signal-to-noise of the individual tran-sit and out-of-trantran-sit variability due to either activity or in-strumental noise as causes of the transit shape deformation. The authors argued that the transit shape deformation was due to planet-spot occultation events. This was supported by the fact that the transit times showed a periodicity equal to half of the rotation period of the star. Moreover, they found that transits with out-of-transit flux higher than the median level are less distorted. In Fig. III.2.3, we show a comparison of the posterior distributions of a/R∗ and i for
the high and low flux levels of each run.Barros et al.(2014) found that the posterior distributions are all similar except for the selection of the low flux level of LRa01. They con-cluded that the low flux level transits of LRa01 appear to have more extra noise than the other samples. To avoid
Table III.2.1.CoRoT-7 transit parameters fromBarros et al.(2014).
Planet orbital period, P [days] 0.85359159 ± 5.7e−7 Mid-transit time, T [BJD] 2 454 398.07756+4.5e−4−7.4e−4 Orbit inclination, i [deg] 80.78+0.51−0.23 Orbital semi-major axis, a [AU] 0.017016+1.7e−4−3.6e−5 semi-major axis/radius of the star, a/R? 4.484 ± 0.070
Radius ratio, k = Rp/R? 0.01784 ± 0.00047
Transit duration, T14[h] 1.059 ± 0.026
Impact parameter, b 0.713+0.017−0.026
Planet radius, Rb[R⊕] 1.585 ± 0.064
Fig. III.2.2.Posterior distribution of the geometric parameters for the separate fits of the LRa01 (red) and the LRa06 (blue) runs. Adapted fromBarros et al.(2014) c A&A.
biasing the derivation of the transit parameters, only tran-sits occurring when the star had higher flux were used in their final analysis. The final transit parameters obtained byBarros et al.(2014) are given in TableIII.2.1.
3. Stellar activity effect in the RVs
During the 2012 RV HARPS campaign, the activity-induced RV variations were also smaller than in 2009. More importantly, the simultaneous CoRoT observations allow to use the photometry to correct the RVs. Haywood et al.
(2014) used the out-of-transit flux to estimate the RV vari-ations using the FF0 method (Aigrain et al. 2012). The FF0 method assumes that the suppression of convective blueshift in active regions and the flux blocked by spots are the dominant RV activity signal. In this case, the RV vari-ations can be approximated with a model that depends on the photometric flux F and its first time derivative F0.
How-ever,Haywood et al.(2014) found that this model was not sufficient to account for all the quasi-periodic (thus activity-induced) signals present in the RVs. This indicates that other activity-related phenomena such as limb-brightened facular emission, photospheric inflows towards active re-gions, or faculae that are not spatially associated with spot groups which are not accounted for in the FF0 method might have a significant effect on the observed RVs.
Fig. III.2.3.Posterior distribution of a/R∗(top) and i (bottom)
for pure geometric fits of the transit selections based on the out-of-transit flux. The transits at high flux levels are shown in red for LRa01 and blue for LRa06 while the one at the low flux levels are shown in magenta for LRa01 and cyan for LRa06. Adapted fromBarros et al.(2014) c A&A.
To model such an additional activity-induced RV signal,
Haywood et al.(2014) used a Gaussian process (GP) with a quasi-periodic covariance function that refleted the fre-quency structure of the light curve. The chosen GP kernel (Rasmussen & Williams 2006) has 4 hyperparameters: the amplitude of the GP, the timescale for growth and decay of active regions, a smoothing parameter, and the recur-rence timescale which was chosen to be the rotation period of the star. The first three parameters were determined by training the GP on the simultaneous light curve. Only the amplitude of the GP was allowed to vary. The planet orbital signals were modelled as Keplerians. The best fit parame-ters of this model were determined via an MCMC procedure (seeHaywood et al.(2014) for further details).
In Fig. III.2.4 we show the decomposition of the ob-served RVs into the different activity components: the two FF0 basis functions, the additional term modelled as the a GP and the two Keplerian orbits for CoRoT-7b and CoRoT-7c. Using Bayesian model comparison, the authors found that the two planets model is more likely. Indeed, the signal at 8−9 days is better modelled by a GP with a quasi-periodic covariance function than by a Keplerian signal, implying that this signal is not fully periodic or coherent. They found planetary masses mb = 4.73 ± 0.95 M⊕ and
The CoRoT Legacy Book
Fig. III.2.4.Top panel : observed radial velocities of CoRoT-7. Second panel : the 3 fitted components of the activity signal the RV due to rotation in orange full line, the RV due to convective blueshift in purple dashed line), and the additional RV signal models with the GPs in blue full line with grey error band. Third panel : RV signal due to planet b. Fourth panel : RV signal due to planet c. Fifth panel : observed RV with the total RV final model overploted. Sixth panel: RV residuals of the model. All RVs are given in m/s. Adapted fromHaywood et al.(2014) c A&A.
4. Conclusions
As the precision of planet observations increases, intrinsic stellar variability is becoming the dominant limitation in the study and characterisation of exoplanets. Moreover, de-tecting smaller planets is easier for smaller late-type main sequence stars, which are generally more active. This will in turn undermine our ability to determine the radius and the mass of the planet via RV follow-up observations; in some cases, activity-induced RV variations may prevent us from confirming a planet candidate at all. It is therefore crucial to understand the effects of stellar activity in the derived exoplanet parameters.
The re-observation of CoRoT-7 with the CoRoT satel-lite and a simultaneous observation with HARPS offers a good opportunity to explore in more details the impact of stellar activity and a better understanding on how stellar activity affects the derivation of system parameters. In ad-dition, it also allowed to much better constraints on the system parameters of CoRoT-7.
– In low signal-to-noise transits with only white noise, the ingress/egress times are not well defined leading to an overestimation of the inclination angle. In this case, to avoid biasing the transit parameters a prior on
the stellar parameters derived from spectroscopy should be used (Barros et al. 2014).
– Although invisible, planet-spot crossing events in low signal-to-noise transit can deform the transit shape, leading to an underestimation of the inclination angle. When the planet-spot crossing events are not directly detectable in the transits, tests need to be made to en-sure that the transit shape is not deformed. To quan-tify this effect, we suggest to compare the parameters of transits that occur when the star is at a higher flux level with the ones of transits that occur when the star has a lower flux level. The later happens when planet-spot occultation has a higher probability of occurring. If dif-ferences are detected, then the transits occurring during lower flux level should be discarded to derive unbiased transit parameters.
– In very active stars like CoRoT-7, the FF0 method (Aigrain et al. 2012) that uses the out-of-transit photo-metric variability to derive the activity-induced RV vari-ability is not enough to fully reproduce the observations. – Haywood et al.(2014) found that the FF0 method com-bined with a Gaussian process with the same frequency properties as the light curve overcomes the limitations of applying the FF0 method only. Indeed, they found that it reproduces the activity-induced RV variations very well. For the specific case of CoRoT-7, it allowed them to determine reliable planetary masses. In practice, it is difficult to obtain high precision (space-based) pho-tometric observations simultaneously with RV observa-tions. The covariance properties of the star’s magnetic activity should, however, be present in observables other than the photometry, such as the spectroscopic indices (eg. the FWHM, bisector span and R0HK).Rajpaul et al.
(2015) have recently developed a method whereby the activity-induced RV variations are modelled with a GP, whose covariance kernel is a combination of that of the FWHM, bisector span and R0HK variations. As they mention, GPs are naturally well-suited to model activity-induced signals that are of stochastic nature, and are often quasi-periodic and coherent only on short timescale. The GP framework also allows a rigorous propagation of uncertainties which results in a more honest uncertainty in the mass, that reflects the effects of stellar activity.
CoRoT-7 system is a good test case to prepare the analysis of planetary systems (with small-size planets) around active stars that TESS and PLATO will provide us.
Acknowledgements. SCCB acknowledges support by grants 98761 by CNES and the Funda¸c˜ao para a Ciˆencia e a Tecnologia (FCT) through the Investigador FCT Contract No. IF/01312/2014. We ac-knowledge the support from Funda¸c˜ao para a Ciˆencia e a Tecnolo-gia (FCT, Portugal) in the form of grant reference PTDC/FIS-AST/1526/2014.” RDH acknowledges support from STFC stu-dentship grant ST/J500744/1. RDH gratefully acknowledges a grant from the John Templeton Foundation. The opinions expressed in this publication are those of the authors and do not necessarily reflect the views of the John Templeton Foundation.
References
Aigrain, S., Pont, F., & Zucker, S. 2012, MNRAS, 419, 3147 Barros, S. C. C., Bou´e, G., Gibson, N. P., et al. 2013,
Barros, S. C. C., Almenara, J. M., Deleuil, M., et al. 2014, A&A, 569, A74
Boisse, I., Bouchy, F., H´ebrard, G., et al. 2011, A&A, 528, A4
Bruntt, H., Deleuil, M., Fridlund, M., et al. 2010, A&A, 519, A51
Czesla, S., Huber, K. F., Wolter, U., Schr¨oter, S., & Schmitt, J. H. M. M. 2009, A&A, 505, 1277
D´ıaz, R. F., Almenara, J. M., Santerne, A., et al. 2014, MNRAS, 441, 983
Rasmussen, E. C. & Williams C. K. I 2006, in Gaussian processes for machine learning (MIT Press)
Ferraz-Mello, S., Tadeu Dos Santos, M., Beaug´e, C., Michtchenko, T. A., & Rodr´ıguez, A. 2011, A&A, 531, A161
Hatzes, A. P., Dvorak, R., Wuchterl, G., et al. 2010, A&A, 520, A93
Hatzes, A. P., Fridlund, M., Nachmani, G., et al. 2011, ApJ, 743, 75
Haywood, R. D., Collier Cameron, A., Queloz, D., et al. 2014, MNRAS, submitted
Lanza, A. F., Bonomo, A. S., Moutou, C., et al. 2010, A&A, 520, A53
L´eger, A., Rouan, D., Schneider, J., et al. 2009, A&A, 506, 287
Pont, F., Aigrain, S., & Zucker, S. 2011, MNRAS, 411, 1953 Queloz, D., Bouchy, F., Moutou, C., et al. 2009, A&A, 506,
303
Rajpaul, V., Aigrain, S., Osborne, M. A., Reece, S., & Roberts, S. 2015, MNRAS, 452, 2269