HAL Id: inserm-01478428
https://www.hal.inserm.fr/inserm-01478428
Submitted on 20 Apr 2021HAL is a multi-disciplinary open access archive for the deposit and dissemination of sci-entific research documents, whether they are pub-lished or not. The documents may come from teaching and research institutions in France or abroad, or from public or private research centers.
L’archive ouverte pluridisciplinaire HAL, est destinée au dépôt et à la diffusion de documents scientifiques de niveau recherche, publiés ou non, émanant des établissements d’enseignement et de recherche français ou étrangers, des laboratoires publics ou privés.
Can Genetic Variability in α-Tocopherol Bioavailability
Explain the Heterogeneous Response to α-Tocopherol
Supplements?
Patrick Borel, Charles Desmarchelier, Marion Nowicki, Romain Bott, Franck
Tourniaire
To cite this version:
Patrick Borel, Charles Desmarchelier, Marion Nowicki, Romain Bott, Franck Tourniaire. Can Ge-netic Variability in α-Tocopherol Bioavailability Explain the Heterogeneous Response to α-Tocopherol Supplements?. Antioxidants and Redox Signaling, Mary Ann Liebert, 2015, 22 (8), pp.669 - 678. �10.1089/ars.2014.6144�. �inserm-01478428�
1 Borel et al.
News & Views manuscript
Can genetic variability in α-tocopherol bioavailability explain the heterogeneous response to α-tocopherol supplements?
Abbreviated title: Variability in α-tocopherol bioavailability
Patrick Borel1,2,3* (PhD), Charles Desmarchelier1,2,3** (PhD), Marion Nowicki1,2,3 (MS),
Romain Bott1,2,3 (MD), Franck Tourniaire1,2,3 (PhD)
1
INRA, UMR INRA1260, F-13005, Marseille, France
2
INSERM, UMR_S 1062, F-13005, Marseille, France
3
Aix-Marseille Université, NORT, F-13005, Marseille, France
* To whom correspondence should be addressed:
UMR 1260 INRA/1062 INSERM/Aix-Marseille University
"Nutrition Obesity and Risk of Thrombosis"
Faculté de Médecine
27, boulevard Jean Moulin
13005 Marseille
France
Phone: +33 (0)4 91 29 41 11
2 Borel et al. ** C. Desmarchelier is co-first author.
Keywords: single nucleotide polymorphisms, chylomicrons, absorption, tocopherol,
nutrigenetic, vitamin E.
Word count: 1884 Reference numbers: 9
Number of greyscale illustrations: 3 Number of color illustrations: 0
3 Borel et al.
ABSTRACT
AIM: Both vitamin E (VE) consumption and blood VE status have been negatively
associated with the incidence of degenerative diseases and some cancers. However, the
response to VE supplementation is very variable among individuals. This could be due to
interindividual variability in VE bioavailability, due, at least partly, to genetic variations in
genes involved in VE metabolism. Thus, the main objective was to identify single nucleotide
polymorphisms (SNPs) that may be involved in the interindividual variability in α-tocopherol
(TOL) bioavailability.
RESULTS: The postprandial chylomicron TOL response (area under the curve of the
postprandial chylomicron TOL concentration) to a TOL rich meal was highly variable
(CV=81%; n=38). This response was positively correlated with the fasting plasma TOL
concentration (r = 0.5, P = 0.004). A significant (P=1.8.10-8) partial least squares regression
model, which included 28 SNPs in 11 genes, explained 82% of this response.
INNOVATION: First evidence that the interindividual variability in TOL bioavailability is,
at least partly, modulated by a combination of SNPs.
CONCLUSIONS: TOL bioavailability is, at least partly, modulated by genetic variations that
can affect long-term TOL status. This allows us to propose a new hypothesis that links the
biological response to VE supplementation with one’s individual genetic characteristics.
4 Borel et al.
INTRODUCTION
Vitamin E (VE), which consists of eight isomers known as , β-, γ-, and δ-tocopherols and
α-, β-α-, γ-α-, and δ-tocotrienolsα-, is considered to be the primary fat-soluble dietary antioxidant
consumed by humans and has also been suggested to have biological activities independent of
its antioxidant effects (6). For example tocotrienols could up-regulate genes related to
osteoblastogenesis and might prevent colorectal cancer better than tocopherols. It has also
been suggested that α-tocotrienol and γ-tocopherol are more effective than the other VE
isomers for reducing cerebral infarcts.
VE has been hypothesized to be involved in the prevention of cardiovascular diseases
and cancers following the negative associations observed in epidemiological studies between
its dietary intake or fasting blood concentration and the incidence of these diseases.
Nevertheless, most prospective randomized controlled trials (RCTs) designed to provide
definite evidence of the beneficial effects of TOL supplementation have failed to support these
associations. Indeed, no effects and even adverse effects (2) of TOL supplementation have
been reported. Several hypothesis have been proposed to explain this discrepancy. A first one
suggests that, epidemiological studies being inherently biased, the absence of beneficial effect
reported by most RCTs demonstrates that TOL is unrelated to these diseases. A second
hypothesis suggests that TOL supplementation in RCTs was not effective because the TOL
status among most participants was already close to optimal, thus providing no opportunity to
observe any significant benefit of TOL supplementation. A third hypothesis might reconcile
these two opposing views by suggesting that the benefit of TOL supplementation depends on
the haptoglobin (Hp) genotype of the subjects (1). Finally it has been suggested that any
potential health benefits of TOL supplementation have been offset by diminution in the
5 Borel et al.
We suggest that the variability in the response to TOL supplementation observed in
RCTs is in part due to interindividual differences in absorption and metabolism of TOL. These
differences can be due to several factors, among them genetic variations that have been
proposed as a determining factor in antioxidant status. Indeed, several genetic polymorphisms
have been shown to influence the fasting blood TOL concentration (5). Nevertheless, this
parameter reflects the complex interactions between TOL intake, TOL absorption efficiency,
blood clearance (e.g. liver secretion and tissue uptake), utilisation, and catabolism (7) and its
variability is hence highly dependent on environmental factors. Conversely, the chylomicron
(CM) VE response to a VE rich test meal, which is acknowledged as a good estimate of VE
absorption efficiency, also called bioavailability, is less affected by environmental factors and
is hypothesized to be mostly dependent on genetic factors when similar VE rich test meals are
given to different individuals. TOL bioavailability has systematically been shown to display
an elevated interindividual variability in clinical studies of TOL supplementation, hence
supporting the possible involvement of genetic factors. Yet, no study has attempted to
decipher the mechanisms underlying this phenomenon.
Thus, the objectives of this study were to i) better characterize the interindividual
variability of TOL bioavailability in healthy subjects, ii) assess whether this variability might
affect the fasting TOL status, and iii) identify single nucleotide polymorphisms (SNPs) that
6 Borel et al.
RESULTS
Interindividual variability in the chylomicron TOL response to the meal
The postprandial chylomicron (CM) TOL response after consumption of the meal
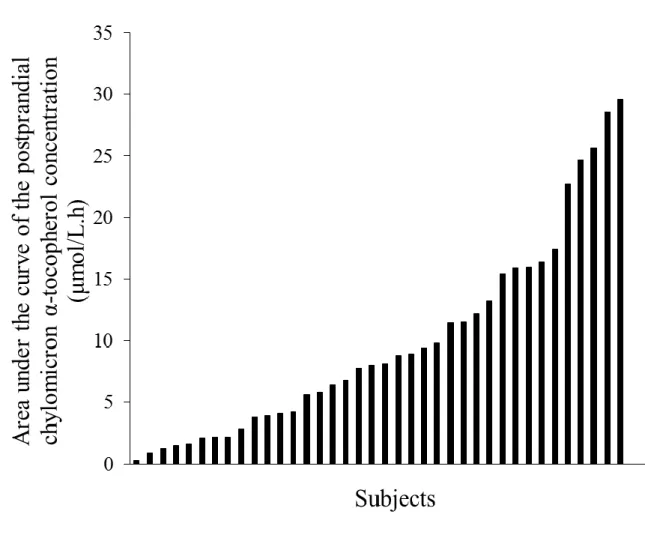
containing the TOL supplement is shown in Figure 1. The coefficient of variation (CV) of the
CM TOL response was 81%, as illustrated in Figure 2.
Correlation between the CM TOL response to the TOL-rich meal and the fasting plasma TOL concentration
To assess whether the fasting plasma TOL concentration, which is known to be a
marker of TOL status, was related to the ability to respond to dietary TOL, we calculated the
correlation between the CM TOL response of the subjects (subjects’ characteristics shown in
Table 1) and their fasting plasma TOL concentration. Results showed that there was a
significant positive correlation between the CM TOL response to the meal containing the TOL
supplement and the fasting plasma TOL concentration (Pearson’s r = 0.46, P = 0.004; Spearman’s rank correlation coefficient = 0.38, P = 0.022).
Genetic variants associated with the TOL response
The PLS regression model that included all 3769 candidate SNPs (used as qualitative
X variables) described the group variance with good accuracy (R2 = 0.81) but was not
predictive of this variance (Q2 = -0.10), as shown in Table 2. Therefore, to improve the model
and find an association of SNPs more predictive of the TOL response, we filtered out those
that displayed the lowest variable importance in the projection (VIP) value (i.e. those that
made no important contribution). After the application of increasing thresholds of VIP value
7 Borel et al.
the predicted postprandial CM TOL response was selected. The Spearman’s Rho value of this
model was 85.2 % (P < 0.001) and it included 36 SNPs (28 not in linkage disequilibrium)..
The 28 SNPs were located in or near 11 genes (ABCA1, ABCG1, APOB, BET1, IRS1, LIPC,
NAT2, PNLIP, SLC10A2, SREBF2, ZNF664) (Table 3) and described 82 % of the group
variance, with a predicted variance (Q2) of 74 % (Table 2). The robustness and the stability of
the model were validated by 4 independent procedures (see Notes section).
The association of these 28 SNPs with the CM TOL response was further evaluated
using univariate statistics by comparing for each SNP the CM TOL response of the subjects
who bore different genotypes (Table 3). For all the SNPs, subjects with different genotypes
exhibited a significantly different CM TOL response (p after Benjamini-Hochberg correction
< 0.05).
Genetic score to predict the CM TOL response of a genotyped subject
With the knowledge of a subject’s genotype at the 28 aforementioned loci, it was
possible to predict the subject’s ability to respond to TOL according to the following
equation:
With RP as the responder phenotype (i.e. the CM TOL response to a TOL rich meal), a as a
constant (9.93), ri as the regression coefficient of the ith SNP included in the PLS regression
model, and “genotype.(SNPi)” as a Boolean variable indicating the subject’s genotype at the
ith SNP. See Table 4 for the list of regression coefficients calculated by the SIMCA-P12
8 Borel et al.
DISCUSSION
The first aim of this study was to accurately determine the interindividual variability in
TOL bioavailability. Thus, we chose to measure the postprandial CM TOL response to a
TOL-rich meal, a widely used method for clinical assessment of TOL bioavailability. Note
that the choice of TOL as the dietary source of VE limits our conclusions to TOL, which is the
main form of VE used in VE supplementation trials and which is the main form of VE found
in human tissues, and cannot be extrapolated to tocotrienols. Indeed it is not known whether
absorption mechanisms of TOL and tocotrienols are similar in humans. The first observation
from this study was the large range of interindividual variability in TOL bioavailability,
estimated at 81% (CV), which is similar to previous observations (4). The second observation
from this study was that a significant part of the interindividual variability in TOL
bioavailability was explained by 28 SNPs in or near 11 genes. It was first striking to observe
that 7 of these genes (Table 3) were shown to be involved in the postprandial CM
triacylglycerol response in the same group of subjects (3). This observation was not
surprising, as most newly absorbed VE is carried from the intestine to peripheral organs and
the liver via CM (8). Thus, SNPs in genes that modulate CM metabolism likely have an
indirect effect on the CM VE response (3). Interestingly, SNPs in the 4 remaining genes were
not associated with the CM triacylglycerol response and were thus specifically associated with
the CM TOL response. These genes were: solute carrier family 10 (sodium/bile acid
cotransporter), member 2 (SLC10A2), pancreatic lipase (PNLIP), sterol regulatory element
binding transcription factor 2 (SREBF2), and ATP-binding cassette, sub-family G (WHITE),
member 1 (ABCG1). SLC10A2 encodes an apical sodium-dependent bile acid transporter
(ASBT). It has been shown that mutations in this gene cause primary bile acid malabsorption
and SNPs have been suggested to impair bile acid transport. The association of this gene with
9 Borel et al.
have been shown to cause fat-soluble vitamin deficiency. PNLIP encodes for pancreatic
lipase, which is responsible for the intestinal hydrolysis of triacylglycerols (i.e. the primary
form of dietary fat). Since VE is fat-soluble, it must be released from lipid droplets in the
digestive tract to be incorporated into mixed micelles for efficient absorption. Thus, we
hypothesize that SNPs that affect PNLIP activity or expression may affect fat hydrolysis and
thus VE absorption. SREBF2 encodes for a transcription factor, SREBP-2, that controls
cholesterol homeostasis. Interestingly, SREBP-2 modulates the expression of NPC1L1, which
is involved in TOL absorption/transport. Thus the association between SNPs in SREBF2 could
be explained by an indirect effect on NPC1L1 expression. ABCG1 is an ATP-binding cassette
transporter involved in macrophage and liver cholesterol and phospholipid transport. There is
no published study on its involvement in TOL transport. Nevertheless, unpublished in vitro
and in vivo studies from our laboratory suggest that it is involved in the cellular efflux of
TOL. Finally note that it was surprising to did not find some TOL transporters, i.e. α-TTP,
CD36, SCARB1, SEC14L, associated with the TOL response. We have two hypothesis to
explain this finding, the first one is that SNPs in these genes are indeed not associated to this
phenotype, or their association is weaker than that of SNPs we have found associated. The
second hypothesis is that SNPs in these genes were not entered in the PLS regression analysis
because either they were not expressed on the BeadChips, or they were excluded from the
analysis (for not respecting the Hardy-Weinberg equilibrium or because their genetic call rate
was <95%). We acknowledge this limitation but it does not change the important finding of
this study: TOL bioavailability is associated with a combination of genetic variants and we
have found some SNPs that likely explain a significant part of the variability in TOL
bioavailability.
The third noteworthy observation of this study was that the plasma TOL concentration
10 Borel et al.
plasma TOL concentration is the result of interactions between several factors, e.g. dietary
TOL intake, TOL absorption efficiency, TOL catabolism rate, etc., this association suggests
that the individual ability to respond to dietary TOL is a key factor that governs blood TOL
concentration. This likely affects tissue concentrations as well. Obviously, the size of the
studied population and the candidate gene approach used in this study suggest that the list of
SNPs involved in this phenotype will be corrected and/or complemented in future studies. It is
also possible that additional SNPs will be involved in the CM response of other VE forms,
e.g. tocotrienols, whether some different proteins are involved in absorption and metabolism
of TOL and tocotrienols. However, the current results strongly support the conclusion that a
significant percentage of the interindividual variability in TOL, and likely other VE isomers,
bioavailability is explained by a combination of genetic variants.
We believe these results can be extrapolated to help to understand the interindividual
differences observed when TOL supplements are given to healthy subjects. Indeed, we
suggest that the interindividual variability in TOL bioavailability can partially explain the
variability in the response to TOL supplementation, following the model proposed in Figure
3. In summary, the TOL responder characteristics of the subjects could affect both the initial
TOL status and the amplitude of the blood and tissue response to TOL supplementation.
In conclusion, there is a high interindividual variability in TOL bioavailability, which
is partly due to genetic variations. As suggested recently, future clinical studies designed to
elucidate the impact of VE supplementation on various diseases should take into account the
11 Borel et al.
INNOVATION
Vitamin E (VE) supplementation has been hypothesized to reduce the incidence of oxidative
stress-related diseases. However, results of RCTs do not support this hypothesis and show a
very heterogeneous response to α-tocopherol (TOL) supplementation. We here show that
TOL bioavailability is associated with the long term blood TOL status and that its variability
is modulated, at least partly, by a combination of SNPs in 11 genes. These findings allow us
to propose a model where the biological effects of TOL supplementation depend on one’s
individual genetic characteristics and could have significant implications in the design of
12 Borel et al.
TABLES
Table 1. Characteristics of subjects included in the statistical analysis of the results*
Parameter Mean ± SEM
Age (y) 33.3 ± 2.1 Weight (kg) 73.7 ± 1.3 BMI (kg/m²) 22.9 ± 0.4 Glucose (mmol/L) † 4.7 ± 0.1 Triacylglycerol (g/L)† 0.7 ± 0.1 Total cholesterol (g/L)† 1.7 ± 0.1 Hemoglobin (g/dL)† 15.1 ± 0.1 α-tocopherol (µmol/L)† 27.8 ± 1.0 * n = 38.
13
Table 2. Performances of different Partial Least Square regression models to explain the postprandial chylomicron α-tocopherol response *
VIP threshold R² Q² SNPs no. P (CV-ANOVA) Average R² of 100 permuted models Spearman’s Rho
No selection 0.81 -0.10 3759 1 0.90 0.926 >0.5 0.99 0.75 1077 0.16 0.98 0.986 >1.0 0.90 0.79 342 6.24 x 10⁻⁶ 0.70 0.893 >1.5 0.97 0.83 142 1.04 x 10⁻⁴ 0.86 0.981 >1.6 0.91 0.78 123 5.71 x 10⁻⁶ 0.69 0.914 >1.7 0.90 0.79 102 1.54 x 10⁻⁶ 0.66 0.912 >1.8 0.85 0.78 78 3.09 x 10⁻⁸ 0.45 0.825 >1.9 0.84 0.77 72 2.51 x 10⁻⁸ 0.42 0.826 >2.0 0.83 0.75 61 1.84 x 10⁻⁸ 0.40 0.828 >2.1 0.83 0.76 54 2.12 x 10⁻⁸ 0.38 0.845 >2.2 0.82 0.74 44 2.09 x 10⁻⁸ 0.33 0.838 >2.3 0.82 0.74 41 1.93 x 10⁻⁸ 0.33 0.841 >2.35 0.82 0.74 36 1.81 x 10⁻⁸ 0.30 0.852 >2.4 0.79 0.70 32 8.61 x 10⁻⁸ 0.27 0.842 >2.5 0.77 0.68 30 1.36 x 10⁻⁷ 0.25 0.827 >2.6 0.73 0.65 21 1.04 x 10⁻⁶ 0.20 0.788
14
*
Different partial least squares regression (PLS) models were built by using increasing VIP threshold values. We first tested the validity of the
models using the permutation technique (see the Notes section for more details): we considered a PLS regression model as validated when the
average of the R² values of 100 permuted models was less than half the R² value of the original model, indicating that more than half of the
explained variability was not due to chance. Then, the validated model presenting the highest Spearman’s Rho between the measured and the
predicted area under the curve of the postprandial plasma chylomicron α-tocopherol concentration was selected. This is the model with VIP
>2.35, shown in the table. Validation criteria and procedures of the PLS regression models are described in the Notes section. CV-ANOVA,
ANOVA after cross-validation; Q², predicted variance; R², explained variance; SNP, single nucleotide polymorphism; VIP, variable importance
15
Table 3. Genes and single nucleotide polymorphisms associated with the postprandial
chylomicron α-tocopherol response*
Gene and SNP rs no. VIP value SNP minor allele
frequency q† APOB-rs4643493 3.66 0.103 0.006 LIPC-rs4238329 3.28 0.139 0.003 ABCA1-rs4149314 3.18 0.077 0.006 SLC10A2-rs1571513 3.09 0.242 0.006 LIPC-rs8041525 3.08 0.097 0.006 ZNF664-rs7296124 3.04 0.096 0.006 ABCA1-rs11789603 3.04 0.088 0.007 PNLIP-rs2915775 3.04 0.250 0.007 ABCA1-rs2274873 3.03 0.086 0.006 APOB-rs1042031 2.94 0.153 0.013 ZNF664-rs1048497 2.88 0.081 0.007 BET1-rs10464587 2.86 0.293 0.013 LIPC-rs7164909 2.83 0.144 0.006 LIPC-rs8035357 2.77 0.131 0.010 LIPC-rs12591216 2.71 0.096 0.011 PNLIP-rs3010494 2.67 0.282 0.018 ABCA1-rs4149297 2.67 0.088 0.026 SREBF2-rs2839715 2.59 0.148 0.017 APOB-rs1713222 2.58 0.152 0.019 SREBF2-rs4822062 2.57 0.132 0.015 SLC10A2-rs9558203 2.54 0.203 0.006 LIPC-rs12593880 2.51 0.075 0.011 SLC10A2-rs16961116 2.50 0.166 0.006 SLC10A2-rs12874168 2.49 0.209 0.027 SLC10A2-rs2065550 2.47 0.149 0.024 IRS1-rs1316328 2.38 0.142 0.006
16
NAT2-rs4921920 2.37 0.101 0.023
ABCG1-rs468320 2.35 0.218 0.026
*
SNPs present in the selected partial least squares regression model shown in Table 2.
SNPs are ranked by decreasing variable importance in the projection (VIP) value. Note that 8
of the 36 SNPs present in the selected model were in linkage disequilibrium. Because these
SNPs provided redundant information in the model, we randomly kept one of each SNP
(those presented in this table), in the final selected partial least squares regression model. See
the Notes section for a complete list of gene names and symbols. rs, reference single
nucleotide polymorphism; SNP, single nucleotide polymorphism; VIP, variable importance in
the projection.
† Student’s t test with the Benjamini-Hochberg correction was carried out to test
differences between the postprandial chylomicron α-tocopherol response according to
17
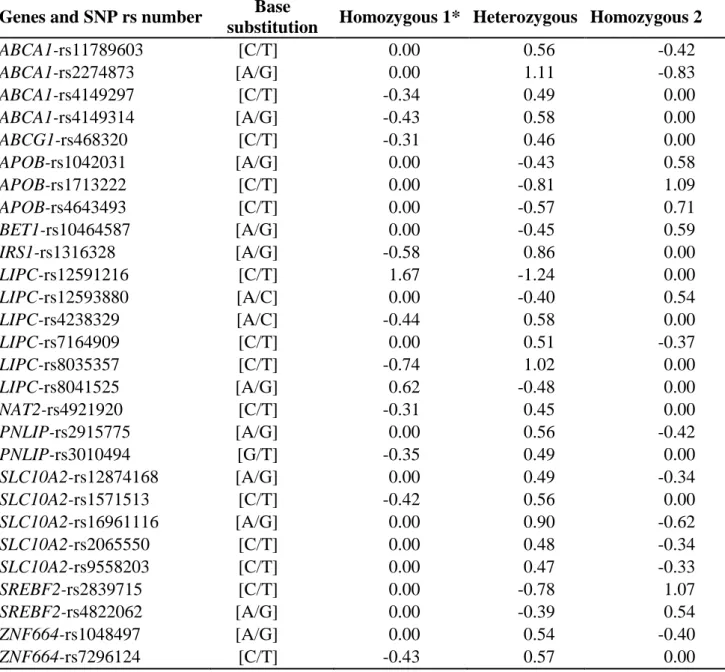
Table 4. Regression coefficients of the genetic score equation that aims to predict the
α-tocopherol response of a genotyped subject to a α-α-tocopherol rich meal
Genes and SNP rs number Base
substitution Homozygous 1* Heterozygous Homozygous 2
ABCA1-rs11789603 [C/T] 0.00 0.56 -0.42 ABCA1-rs2274873 [A/G] 0.00 1.11 -0.83 ABCA1-rs4149297 [C/T] -0.34 0.49 0.00 ABCA1-rs4149314 [A/G] -0.43 0.58 0.00 ABCG1-rs468320 [C/T] -0.31 0.46 0.00 APOB-rs1042031 [A/G] 0.00 -0.43 0.58 APOB-rs1713222 [C/T] 0.00 -0.81 1.09 APOB-rs4643493 [C/T] 0.00 -0.57 0.71 BET1-rs10464587 [A/G] 0.00 -0.45 0.59 IRS1-rs1316328 [A/G] -0.58 0.86 0.00 LIPC-rs12591216 [C/T] 1.67 -1.24 0.00 LIPC-rs12593880 [A/C] 0.00 -0.40 0.54 LIPC-rs4238329 [A/C] -0.44 0.58 0.00 LIPC-rs7164909 [C/T] 0.00 0.51 -0.37 LIPC-rs8035357 [C/T] -0.74 1.02 0.00 LIPC-rs8041525 [A/G] 0.62 -0.48 0.00 NAT2-rs4921920 [C/T] -0.31 0.45 0.00 PNLIP-rs2915775 [A/G] 0.00 0.56 -0.42 PNLIP-rs3010494 [G/T] -0.35 0.49 0.00 SLC10A2-rs12874168 [A/G] 0.00 0.49 -0.34 SLC10A2-rs1571513 [C/T] -0.42 0.56 0.00 SLC10A2-rs16961116 [A/G] 0.00 0.90 -0.62 SLC10A2-rs2065550 [C/T] 0.00 0.48 -0.34 SLC10A2-rs9558203 [C/T] 0.00 0.47 -0.33 SREBF2-rs2839715 [C/T] 0.00 -0.78 1.07 SREBF2-rs4822062 [A/G] 0.00 -0.39 0.54 ZNF664-rs1048497 [A/G] 0.00 0.54 -0.40 ZNF664-rs7296124 [C/T] -0.43 0.57 0.00 *
For a given SNP, homozygous 1 refers to subjects homozygous for the first allele. The
responder phenotype (RP), i.e. the incremental area under the curve of the postprandial plasma chylomicron α-tocopherol concentration, can be predicted as follows: , where r
i is the regression coefficient of the ith SNP included in
the PLS regression model and genotype.(SNPi) is a Boolean variable indicating the subject’s
genotype at the ith SNP. A positive regression coefficient indicates that a genotype is
18
ABCA1- rs11789603 (CT)) whereas a negative regression coefficient indicates that a genotype
is associated with a decrease in this response (e.g. ABCA1- rs11789603 (TT)). A regression
coefficient of 0 for a given SNP (e.g. ABCA1- rs11789603 (CC)) indicates that a genotype
was not carried by enough subjects to reach statistical significance in the selected PLS
19
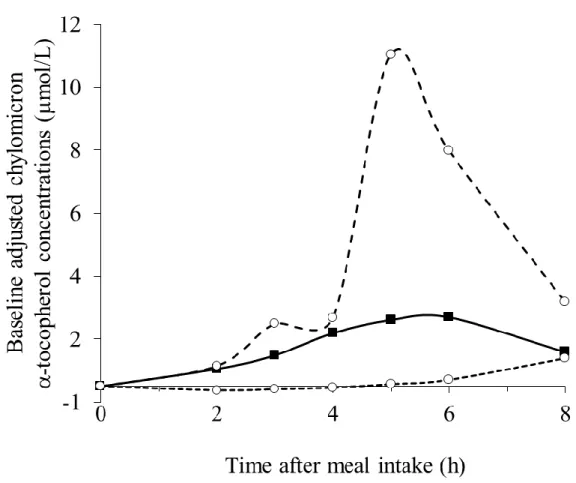
FIGURES
Figure 1: Baseline-adjusted chylomicron α-tocopherol concentration over 8 hours after consumption of the vitamin E-rich meal.
For each subject, postprandial chylomicron α-tocopherol (CM TOL) concentrations were
baseline adjusted by using the fasting CM TOL concentration. The bold curve shows mean ±
SEM of 38 subjects combined. The smaller dashed curve shows the concentration of CM
TOL measured in the lowest single responder. The larger dashed curve shows the
20
Figure 2: Individual AUCs of the postprandial chylomicron α-tocopherol response after consumption of the α-tocopherol rich meal.
Subjects were sorted by increasing postprandial chylomicron α-tocopherol response (i.e. 0-8 h
21
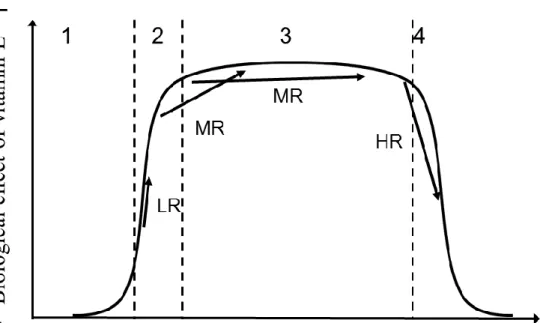
Figure 3: Proposed model of the effect of the interindividual differences in vitamin E bioavailability on the biological effects of vitamin E supplementation.
The curve shows the theoretical biological effects of vitamin E (VE) supplementation as a
function of vitamin E status (i.e. blood and tissue concentration). We hypothesize that this
model can be applied to the different forms of VE, e.g. tocopherols and tocotrienols. When
VE concentration is below optimal levels (i.e. when the concentration falls in intervals 1 or
2), then the subject either displays symptoms of deficiency (interval 1) or does not fully
experience the beneficial biological effects of VE (interval 2). When the VE concentration is
optimal (interval 3), the maximum beneficial biological effects of VE are obtained. Finally,
when VE concentration is above optimal (interval 4), adverse biological effects of VE can be
observed. In studies with VE supplementation, several possibilities can take place depending
on the VE responder characteristic of the subjects. Some examples are shown on the figure.
22
suboptimal status (interval 2), in case of VE supplementation we hypothesize that he will
benefit from the VE supplementation as his blood/tissue VE concentration can be expected to
reach interval 3. A second example is a subject who is low responders (LR), in case of VE
supplementation we hypothesize that he will not optimally benefit from the the
supplementation because his VE status will not increase enough to reach interval 3. A third
example with a subject who is high responder (HR) and who has an initial VE status close to
interval 4. In that case there is a possibility that he might undergo adverse effect of VE
supplementation because his blood/tissue VE concentration will reach the interval 4.
LIST OF ABBREVIATIONS
ABCG1 (ATP-binding cassette, sub-family G (WHITE), member 1); AUC (area under the
curve); CM (chylomicron); CV (coefficient of variation); HPLC (high performance liquid
chromatography); PNLIP (pancreatic lipase); PLS (partial least squares); SLC10A2 (solute
carrier family 10 (sodium/bile acid cotransporter), member 2); SNPs (single nucleotide
polymorphisms); SREBF2 (sterol regulatory element binding transcription factor 2); TOL
23
REFERENCES
1. Asleh R, and Levy AP. Divergent effects of alpha-tocopherol and vitamin C on the generation of dysfunctional HDL associated with diabetes and the Hp 2-2 genotype.
Antioxid Redox Signal 12: 209-17, 2010.
2. Bjelakovic G, Nikolova D, and Gluud C. Antioxidant supplements to prevent mortality. JAMA 310: 1178-9, 2013.
3. Desmarchelier C, Martin JC, Planells R, Gastaldi M, Nowicki M, Goncalves A, Valero R, Lairon D, and Borel P. The postprandial chylomicron triacylglycerol response to dietary fat in healthy male adults is significantly explained by a combination of single nucleotide polymorphisms in genes involved in triacylglycerol metabolism. J Clin Endocr Metab 99: E484-E488, 2014.
4. Jeanes YM, Hall WL, and Lodge JK. Comparative (2)H-labelled alpha-tocopherol biokinetics in plasma, lipoproteins, erythrocytes, platelets and lymphocytes in normolipidaemic males. Br J Nutr 94: 92-9, 2005.
5. Major JM, Yu K, Chung CC, Weinstein SJ, Yeager M, Wheeler W, Snyder K, Wright ME, Virtamo J, Chanock S and others. Genome-wide association study identifies three common variants associated with serologic response to vitamin E supplementation in men. J Nutr 142: 866-71, 2012.
6. Mocchegiani E, Costarelli L, Giacconi R, Malavolta M, Basso A, Piacenza F, Ostan R, Cevenini E, Gonos ES, Franceschi C and others. Vitamin E-gene interactions in aging and inflammatory age-related diseases: implications for treatment. A systematic review. Ageing Res Rev 14: 81-101, 2014.
7. Parks E, and Traber MG. Mechanisms of vitamin E regulation: research over the past decade and focus on the future. Antioxid Redox Signal 2: 405-12, 2000.
8. Traber MG, and Arai H. Molecular mechanisms of vitamin E transport. Annu Rev Nutr 19: 343-55, 1999.
9. Zingg JM, Azzi A, and Meydani M. Genetic polymorphisms as determinants for disease-preventive effects of vitamin E. Nutr Rev 66: 406-14, 2008.
24
NOTES
Subject number and characteristics
Forty healthy, non-obese, non-smoking men were recruited for the study. This group
of subjects included the individuals who were initially recruited to determine if a combination
of SNPs significantly explained the postprandial CM triacylglycerol response to dietary fat.
Subjects reported normal energy consumption (i.e. 2500 kcal/d) with <2% alcohol as total
energy intake on a kcalorie basis. Subjects had no history of chronic disease, hyperlipidemia,
or hyperglycemia and were not taking any medication known to affect VE absorption or lipid
metabolism, e.g. tetrahydrolipstatin, ezetimibe, phytosterols, cholestyramine, fibrates…,
during the month before the study or during the study period. Because of the relatively large
volume of blood that was drawn during the study, blood hemoglobin concentration >1.3 g/L
was an inclusion criteria. The study was approved by the regional committee on human
experimentation (N°2008-A01354-51, Comité de Protection des Personnes Sud Méditerranée
I, France). Procedures followed were in accordance with the Declaration of Helsinki of 1975
as revised in 1983. Objectives and requirements of the study were fully explained to all
participants before beginning the study, and written informed consent was obtained from each
subject. Two subjects left the study for personal reasons before they participated in the
postprandial experiment, which left 38 subjects whose baseline characteristics are reported in
Table 1.
DNA preparation and genotyping methods
An average of 25 µg of DNA was isolated from a saliva sample from each subject
using the Oragene kit (DNA Genotek Inc., Kanata, ON, Canada). DNA concentration and
25
sur Yvette, France) at 260 nm and 280 nm. All genotyping procedures were carried out by the
Integragen company (Evry, France). The whole-genome was genotyped as follows: 200 ng of
DNA was hybridized overnight to HumanOmniExpress BeadChips (Illumina, San Diego, CA,
USA), which allowed for the analysis of approximately ~ 7.33 x 10⁵ SNPs/DNA sample.
Unhybridized and non-specifically hybridized DNA was then washed away. Afterward, the
BeadChips were stained and scanned on an Illumina iScan scanner (Illumina). Detailed
methods are provided in the Infinium HD Assay Ultra Protocol Guide (Illumina). Eleven additional SNPs were genotyped as previously described (refer to “Choice of candidate
genes” below).
Postprandial experiment
Subjects were asked to refrain from the consumption of vitamin supplements and
VE-rich foods (an exclusion list was provided by a dietitian) 48 h before the postprandial visit. In
addition, the subjects were asked to eat dinner between 1900 and 2000 the day before the
postprandial visit and to abstain from alcohol and any food or beverage other than water until
they arrived at the clinic. After the overnight fast, subjects arrived at the local Center for
Clinical Investigation (la Conception Hospital, Marseille, France) and consumed a meal
including a VE supplement. The meal consisted of semolina (70 g) cooked in 200 mL of hot
water, white bread (40 g), cooked egg whites (60 g), peanut oil (50 g), and mineral water (330
mL). The VE supplement was provided as a capsule containing 67 mg α-tocopherol (TOL)
equivalent (100 IU) of d-α-tocopheryl acetate (Holland & Barrett, Nuneaton, Warwickshire,
England). The pill also contained gelatin, glycerin and soy bean oil. Subjects were asked to
consume the meal at a steady pace, with one-half of the meal consumed in 5 min and the
remainder of the meal consumed within 10 min (to diminish the variability due to different
26
Subjects were only allowed to consume any remaining bottled water from the meal. A
baseline blood sample was drawn before administration of the meal (i.e. in the fasted state) as
well as at 2, 3, 4, 5, 6 and 8 h after meal consumption. Blood was taken up into evacuated
tubes containing K-EDTA. Tubes were immediately placed into an ice-water bath and
covered with aluminum foil to avoid light exposure. Plasma was isolated by centrifugation
(10 min at 4 °C and 878 g) < 2 h after collection.
CM preparation
Plasma (6 mL) was overlaid with 0.9% NaCl solution (4.5 mL) and centrifuged for 28
min at 130,000 g at 10 °C using a SW41Ti rotor (Beckman Coulter, Villepinte, France) in a
Thermo Sorvall WX100 ultracentrifuge (Thermo Scientific, Saint Herblain, France). The
upper phase, containing primarily chylomicrons (CM) and large CM remnants, was collected.
Immediately after recovery, CM were stored at -80 °C before TOL analysis.
Plasma and CM TOL extraction and analysis
All extractions were performed at room temperature under yellow light to minimize
light-induced damage. Samples (0.5 mL for plasma or < 2 mL for CM) were deproteinated by
adding one volume of ethanol containing tocopheryl nicotinate as an internal standard. After
the addition of 2 volumes of hexane, the mixture was vortexed for 5 min and centrifuged at
1200g for 10 min at 4 °C. The upper phase (containing TOL) was collected, and the sample
was extracted a second time with hexane following the same procedure. The hexane phases
were pooled and evaporated to dryness using nitrogen gas. The dried extract was redissolved
in 200 µL of methanol. A volume of 90 µL was injected into the HPLC system, which
consisted of a separation module (P680 HPLC Pump and ASI-100 Automated Sample
27
(Dionex SA). Separation was achieved using a 10 mm x 4.0 mm Modulo-Cart guard column,
with 2 µm particle size, (Interchim, Montluçon, France) followed by a 250 mm x 4.6 mm ,
5-µm particle size C18 Zorbax Uptisphere column (Interchim). The isocratic mobile phase was
composed of 100 % HPLC-grade methanol (Carlo Erba – SDS, Peypin, France) maintained at
35° C with a flow rate of 1.5 mL/min. TOL was detected at 290 nm and identified via spectra
and a retention time coincident with authentic standard (Sigma-Aldrich, Saint Quentin
Fallavier, France). Peaks were integrated using Chromeleon software (version 6.80, Dionex
SA). Quantitation was performed using external calibration curves normalized to internal
standard.
Calculations
Trapezoidal approximation was used to calculate the AUC of the postprandial plasma
CM TOL concentration over 8 hours.
Choice of candidate genes
Candidate genes included those for which the encoded protein has been shown in vitro
to be involved in TOL uptake by the enterocyte [i.e. scavenger receptor class B, member 1
and Niemann-Pick disease, type C1, gene-like 1]. They also included genes that have been
suggested to be involved, directly or indirectly, in enterocyte TOL metabolism, e.g. liver-fatty
acid binding protein, intestinal-fatty acid binding protein, and microsomal triglyceride transfer
protein. Finally, they included genes that have been associated with circulating TOL
concentration in genome-wide association studies or candidate gene association studies. This
choice resulted in the selection of 59 genes (see Notes Table 1 below), representing 4474
SNPs. In addition, we added 29 SNPs in 15 genes that were shown to be associated with the
28
the main carrier of newly absorbed VE in the blood, and we hypothesized that genetic variants
that affect the secretion and clearance of CMs in the postprandial period can also likely affect
the postprandial blood response of VE. We also added 11 SNPs that have been previously
associated with lipid metabolism and which were not genotyped on the BeadChips (see Notes
Table 2 below). After the genotyping of the subjects (see DNA preparation and genotyping
methods), SNPs for which the genotype call rate was <95%, or SNPs that presented a
significant departure from the Hardy-Weinberg equilibrium (P < 0.05; Chi-squared test), were
excluded from all subsequent analysis [745 SNPs excluded, leaving 3769 SNPs for the PLS
regression analysis].
Notes Table 1. Candidate genes selected
Gene name Gene symbol
Genes that are assumed to play a role in α-tocopherol metabolism or that have been
associated with blood α-tocopherol concentrationa
ATP-binding cassette, sub-family A (ABC1), member 1 ABCA1*
Apolipoprotein A-I APOA1*
Apolipoprotein A-IV APOA4
Apolipoprotein A-V APOA5*
Apolipoprotein B APOB*
Apolipoprotein C-I APOC1
Apolipoprotein C-II APOC2
Apolipoprotein C-III APOC3
Apolipoprotein C-IV APOC4
Apolipoprotein E APOE
ATP-binding cassette, sub-family B (MDR/TAP), member 1 (PGP,
MDR1) ABCB1
ATP-binding cassette, sub-family G (WHITE), member 1 ABCG1
ATP-binding cassette, sub-family G (WHITE), member 2 ABCG2
ATP-binding cassette, sub-family G (WHITE), member 5 ABCG5
ATP-binding cassette, sub-family G (WHITE), member 8 ABCG8
Bile acid CoA: amino acid acyltransferase (glycine
N-choloyltransferase) BAAT
BUD13 homolog (S. cerevisiae) BUD13
Carboxyl ester lipase CEL
CD36 molecule (thrombospondin receptor) CD36*
Colipase, pancreatic CLPS
29
Cytochrome P450, family 3, subfamily A, polypeptide 5 CYP3A5
Cytochrome P450, family 4, subfamily F, polypeptide 2 CYP4F2
Fatty acid binding protein 1, liver FABP1
Fatty acid binding protein 2, intestinal FABP2
Fatty acid binding protein 6, ileal (I-BABP) FABP6
Intestine Specific Homebox ISX
Lipase, gastric LIPF
Lipase, hepatic LIPC*
Lipoprotein lipase LPL*
Microsomal Triglyceride Transfer Protein MTTP
Na+/K+ transporting ATPase interacting 3 NKAIN3
Niemann-Pick disease, type C1 NPC1
Niemann-Pick disease, type C2 NPC2
NPC1-like 1 NPC1L1
Nuclear receptor subfamily 1, group H, member 2 (LXRβ) NR1H2
Nuclear receptor subfamily 1, group H, member 3 (LXRα) NR1H3
Nuclear receptor subfamily 1, group H, member 4 (FXR) NR1H4
Nuclear receptor subfamily 1, group I, member 2 (PXR) NR1I2
Pancreatic lipase PNLIP
Pancreatic lipase-related protein 2 PNLIPRP2
Peroxisome proliferator-activated receptor alpha PPARA
SAR1 homolog B (S. cerevisiae) SAR1B
Scavenger receptor class B, member 1 SCARB1
SEC14-like 2 (S. cerevisiae) SEC14L2
SEC14-like 3 (S. cerevisiae) SEC14L3
SEC14-like 4 (S. cerevisiae) SEC14L4
Solute carrier family 10 (sodium/bile acid cotransporter), member 2
(ASBT, IBAT) SLC10A2
Solute carrier family 27 (fatty acid transporter), member 5 SLC27A5*
Solute carrier family 51, alpha subunit SLC51A
Solute carrier family 51, beta subunit SLC51B
Solute carrier organic anion transporter family, member 1A2
(OATP)(Na+-independent) SLCO1A2
Sterol carrier protein 2 SCP2
Sterol regulatory element binding transcription factor 2 SREBF2
Tocopherol (alpha) transfer protein TTPA
Transmembrane 6 superfamily member 2 TM6SF2
UDP glucuronosyltransferase 1 family, polypeptide A1 UGT1A1
UDP glucuronosyltransferase 1 family, polypeptide A10 UGT1A10
Zinc finger protein 259 ZNF259
a
The candidate genes included those whose encoded proteins have been shown by in vitro
methods to be involved in α-tocopherol uptake by the enterocyte, genes that are suspected to
30
metabolism or transcription factors involved in the expression of proteins involved in
α-tocopherol metabolism, and genes that have been associated in genome-wide association
studies or candidate gene association studies with blood α-tocopherol concentration.* genes
that have been involved in postprandial chylomicron triacylglycerol response in the same
group of subjects (3).
Note Table 2: Additional candidate SNPs selected1.
Gene name Gene
symbol SNP
ATP-binding cassette, sub-family A (ABC1), member 1 ABCA1 rs2066718* rs2230805* rs2230806* rs2230808* rs2472458* rs4149313* rs7862756* ATP-binding cassette, sub-family G, member 2 ABCG2 rs2231142
rs4148152*
ATP-binding cassette, sub-family G (WHITE), member 5 ABCG5 rs17031672*
rs6720173*
ATP-binding cassette, sub-family G (WHITE), member 8 ABCG8 rs11887534*
rs147194762* rs4148211* rs41448217* rs6544718* CD36 molecule (thrombospondin receptor) CD36 rs13230419*
rs1527479 rs1527483 rs1761667 rs1984112 rs3211805 Fatty acid binding protein 1, liver FABP1 rs1545223*
rs1545224* rs2197076 rs224188* rs2919871 Microsomal Triglyceride Transfer Protein MTTP rs1800591 rs2255119* rs745075* rs881980*
31
NPC1 (Niemann-Pick disease, type C1, gene)-like 1 NPC1L1 rs17655652* rs217428 rs217434* Scavenger receptor class B, member 1 SCARB1 rs4238001*
rs5888* rs61932577
1
These SNPs have been selected because previous publications have shown that these SNPs,
or SNPs in linkage disequilibrium with some of them, have a phenotypic effect on lipid
metabolism. * SNPs excluded from all statistical analysis because either their genotype call
rate was <95%, or they presented a significant departure from Hardy-Weinberg equilibrium
(P<0.05 following the Chi-squared test), or only one genotype for the SNP was present in the
studied population, or they were already genotyped on the HumanOmniExpress BeadChips.
Selection of the SNPs used in the statistical analysis
32
Statistics: PLS regression
To identify SNPs associated with the variability observed in the TOL response, we used PLS
regression using previously published rationale and model assumptions. SIMCA-P12 software
(Umetrics, Umeå, Sweden) was used for all multivariate data analyses and modeling. PLS
regression was chosen to identify SNPs (of the 3769 candidate SNPs) that were predictive of
the postprandial CM TOL response according to their VIP value. A general genetic model
was assumed (i.e. the 3 genotypes of each SNP were treated as separate categories with no
assumption made about the effect conferred by the variant allele for homozygotes or
heterozygotes on the postprandial CM TOL response). Different PLS regression models were
built using increasing VIP threshold values. The validated model presenting the highest Spearman’s Rho between the measured and the predicted postprandial CM TOL response was
33
the phenotypic variation (R2Y) (prediction value Q2= 73.6% after cross-validation). Four
procedures of validation were applied to validate the model :
1. Permutation technique
This procedure 1) assesses the risk that the PLS regression model is spurious, i.e. the
model fits the current data set well but does not predict Y well for new observations, and 2)
tests for overfitting. For this, the accuracy of fit (R2 and Q2) of the original model was
compared with the accuracy of fit of 100 models based on data where the order of the Y
matrix for the subjects (postprandial CM TOL response) was randomly permuted, while the X
matrix (the genotype for the selected SNPs of each subjects) was kept intact. Thus, a robust
model (where the fit between X and Y is high) should be unable to predict the permuted Y
variables with the intact X variables. We considered a PLS regression model as validated
when the average of the R² values of the 100 permuted models was less than half the R² value
of the original model, indicating that more than half of the explained variability was not due
to chance. Note Figure 1 (below) shows the results of these permutations for the selected
34
Note Figure 1. The horizontal axis represents the correlation between the permuted
Y’s and the original Y’s. The vertical axis represents the R2
(solid line and triangles) and Q2
(dashed line and squares) values obtained in the permuted models. Values of the original
model are on the far right (at correlation = 1), values of the 100 Y-permuted models are
further to the left. Note that all the R² and Q2 values of the permuted models are lower than
the R² and Q2 values of the original non permuted model. This strongly supports the
conclusion that the ability of the original, non-permuted model to predict the phenotype was
not due to chance.
2. Single cross-validation
In this second validation procedure, 4-5 subjects were kept out of model development, their
postprandial CM TOL response was then predicted by the model and subsequently compared
with their measured postprandial CM TOL response. In this test, the predicted response
35
close to the measured values (R2), with predicted values Q2>0.5 (50%). This validation was
repeated until all subjects were left out once and only once. P-values after cross-validation
ANOVA were calculated.
3. Leave-k-out
In this third validation procedure, we challenged our PLS regression model by randomly
taking out k subjects (k = {1, 2, 3, 4}) from the original dataset, thus leaving a training
dataset. The k subjects taken out were then reintroduced into this training set to assess
whether the training models built without these k subjects were able to predict their
postprandial CM TOL response accurately. This test was performed thirty eight times for k=1 and eight times for k = {2, 3, 4}. The Spearman’s Rho between the measured and the
predicted AUC of the postprandial plasma CM TOL concentration of the left out subjects is
shown in Notes Table 2. The correlation coefficient was >80%, even when up to four
subjects were left out of the model.
Notes Table 3. Relative prediction error following the leave-k-out procedure Number of subjects left out
0 1 2 3 4
Relative prediction error (%) 85.2 81.0 86.2 84.4 84.0
4. VIP stability following the leave-k-out procedure
In this last procedure, we checked that the top 10 SNPs (top 10 VIP values in Table 3)
remained unchanged following the leave-k-out procedure described above. Notes Figure 2
(below) shows good stability of the selected model with this validation (no variables missing across the validation rounds, similar ‘weight’ in the response).
36
Statistics: univariate analyses
In a second approach, we performed univariate analyses to compare the postprandial
CM TOL response between subgroups of subjects who bore different genotypes for SNPs
selected from the PLS regression model. Differences obtained in the different genotype
subgroups were analyzed using a Student’s t test with the Benjamini-Hochberg correction
with QVALUE software (version 1.0, designed by researcher) and R software (version 3.0.2,
R foundation of statistical computing). For all tests, a false discovery rate q < 0.05 was
37
ACKNOWLEDGEMENTS
We are grateful to Dr Rachel Kopec for critical comments on the manuscript.
Patrick Borel and Charles Desmarchelier had full access to all of the data in the study and take
responsibility for the integrity of the data and the accuracy of the data analysis.
Author Disclosure Statement: None of the authors have a conflict of interest to declare.
Funding: The present work has received research funding from the European Community’s
Sixth Framework Programme. The funding was attributed to the Lycocard project (n°016213) which was an Integrated Project within the framework of the “Food Quality and Safety”
program. This publication reflects only the view of the authors. The Lycocard community is
not liable for any use that may be made of the results.
AUTHORS' CONTRIBUTIONS TO MANUSCRIPT:
PB (UMR INRA 1260 NORT) designed the research; MN (UMR INRA 1260 NORT)
conducted the clinical research; RB (UMR INRA 1260 NORT) and FT (UMR INRA 1260
NORT) analysed α-tocopherol by HPLC; CD (UMR INRA 1260 NORT) and PB analyzed
data; CD performed statistical analyses; PB and CD wrote the paper and had primary