Development of Adsorption-based Atmospheric
Water Harvesting and Thermal Energy Storage
Technologies
by
Hyunho Kim
MASCUJ'SMFS IN TMTUTEFEB
09 2018
LIBRARIES
B.S., University of Illinois at Urbana-Champaign (2011)
S.M., Massachusetts Institute of Technology (2014)
Submitted to the Department of Mechanical Engineering
in partial fulfillment of the requirements for the degree of
Doctor of Philosophy in Mechanical Engineering
at the
MASSACHUSETTS INSTITUTE OF TECHNOLOGY
ARCHIIVES
February 2018
@
Massachusetts Institute of Technology 2018. All rights reserved.
Signature redacted
A uth or ...
...
Department of Mechanical Engineering
January 15, 2018
C ertified by ...
Evelyn N. Wang
Gail E. Kendall Professor
Thesis Supervisor
A ccepted by ...
...
Rohan Abeyaratne
Chairman, Department Committee on Graduate Theses
Development of Adsorption-based Atmospheric Water
Harvesting and Thermal Energy Storage Technologies
by
Hyunho Kim
Submitted to the Department of Mechanical Engineering on January 15, 2018, in partial fulfillment of the
requirements for the degree of
Doctor of Philosophy in Mechanical Engineering
Abstract
Sorption-based energy technologies can be used to efficiently harvest fresh water from the atmosphere and to store thermal energy for climate control. Recent ad-vances in porous adsorbents such as metal-organic frameworks (MOFs), with high sorption capacity and low regeneration temperature requirements, allow us to
ef-ficiently utilize them for these applications. However, detailed experimental and
theoretical frameworks for the use of advanced sorbents have not considered several important aspects (e.g., inter/intracrystalline diffusion kinetics). This thesis provides a generalized framework to select the materials, design, and develop sorption-based energy and water systems.
First, this thesis presents the design and demonstration of a device based on porous
MOF-801 [Zr6O4(OH)4(fumarate)6j powered by natural sunlight (solar-thermal) that
captures water from the atmosphere at ambient conditions, down to 20% RH. Under these conditions, operation of competing technologies, such as dew-based atmospheric water generators (AWGs), is infeasible. Laboratory experiments and computational simulations were used to optimize the device based on this MOF to maximize water delivery capacity in arid climates. We subsequently tested an optimized device in an exceptionally arid climate with 10-40% RH and sub-zero dew points. With a solar flux with 1.8x concentration for desorption, we demonstrated the operation of our device with a thermal efficiency ~14%. Finally, we quantitatively analyzed the water quality and showed that the MOF compound was stable to water, and the metal ions and organic linkers did not leach from the framework into the harvested water. Our demonstration indicates that passive operation of sorption-based AWGs with high efficiencies (> 20%) is possible and can be operated with abundant low-grade heat
sources (-100'C) under exceptionally dry climates of RH < 40%.
Second, the high enthalpy of adsorption/evaporation for a sorbent-water pair pro-vides a promising combination for high energy density thermal storage application. We examined use of commercial zeolite 13X-water pair for adsorption storage-based climate control. We designed, optimized, and demonstrated compact
adsorption-extend the driving range of electric vehicles.
The detailed experimental and theoretical work presented in this thesis will serve as a general framework for sorption-based technologies, including thermal manage-ment, heating and cooling, and water harvesting.
Thesis Supervisor: Evelyn N. Wang Title: Gail E. Kendall Professor
Acknowledgments
I would like to first acknowledge my thesis advisor, Professor Evelyn N. Wang, for her valuable contribution and guidance towards my Ph.D. thesis. She has provided me supportive and engaging environment for me to pursue Ph.D. but also offered me freedom in pursuing my own ideas for the research. Her remarkable leadership gave me lessons on how to become an expert, leader, and respectful person. I would also like to thank my Ph.D. thesis committee members: Professor John Lienhard and Professor Rohit Karnik. Their insightful suggestions and ideas provided to me during thesis committee meetings led me to complete the work presented in this thesis.
Much of the work presented in this thesis would not have been possible without all of collaborators who I worked with. I thank Dr. Sameer R. Rao, Dr. Shankar Narayanan, Dr. Sungwoo Yang, Dr. Jeremy Cho, Dr. Xiansen Li, Ari S. Umans, and Ian S. McKay of Device Research Laboratory at MIT. I thank Professor Omar M. Yaghi, Dr. Hiroyasu Furukawa, Eugene A. Kapustin, and Juncong Jiang of University of California-Berkeley, Professor Carlos H. Hidrovo, Dr. Carlos A. Rios Perez, and Arjun Venkataramanan of Northeastern University, and Ford motor company. I also thank Professor Patrick Phelan, Sami M. Ali, and Jon Sherbeck of Arizona State Uni-versity for assistance with experiments presented in chapter 4 of this thesis. I thank Institute for Soldier Nanotechnologies at MIT for allow me to use crucial instruments (thermogravimetric analyzer, differential scanning calorimeter, and scanning electron microscope) for work presented in this thesis. I thank all of the past and present mem-bers of Device Research Laboratory and Rohsenow Kendall heat transfer laboratory at MIT.
Thank you to my friends at MIT, Youngsuk Jo, Jongwon Choi, Eugene N. Cho, Seonghoon Woo, Hyundo Lee, Kyungsuk Han, Ki-Tae Kim, Taekeun Kim, Keunhwan Pack, Sung Kwan Lee, and Jongwoo Lee who made my Ph.D. journey more enjoyable. This thesis would not have been possible without funding sources. I thank gener-ous support from Samsung scholarship and funding from Advanced Research Projects
Agency - Energy (ARPA-E) High Energy Advanced Thermal Storage (HEATS)
pro-gram.
Finally, I thank my parents, Ki-Chang Kim and Kyungsoon Lee, and my brother, Hanho Kim. Without their sacrifices, unconditional loves, and supports, I would not had the opportunity to pursue and complete my undergraduate and graduate degrees in the United States.
Contents
1 Introduction 27
1.1 M otivation . . . . 27
1.2 Background: Adsorption and its applications . . . . 29
1.3 Background: Metal-organic frameworks (MOFs) . . . . 31
1.3.1 Water adsorption in MOFs . . . . 31
1.4 T hesis outline . . . . 34
2 Characterization of adsorption enthalpy of novel water-stable zeo-lites and metal-organic frameworks 35 2.1 Introduction and Clausius-Clapeyron relation . . . . 36
2.2 DSC and TGA experiments . . . . 38
2.3 Thermodynamic modeling . . . . 40
2.3.1 Enthalpy of adsorption as function of uptake . . . . 43
2.4 Direct calorimetric measurements of 13X and MgY zeolites . . . . 46
2.5 Summary and discussion . . . . 47
3 Adsorption-based atmospheric water harvesting: Laboratory, theo-retical, and proof-of-concept investigation 49 3.1 Background: Atmospheric water harvesting . . . ... 50
3.2 Characteristics and working principles of MOFs for atmospheric water harvesting . . . . 52
3.3 Synthesis and characterization of MOF-801 . . . . 54
3.3.1 Synthesis of MOF-801 . . . . 54
3.3.2 Hydrothermal stability of MOF-801 . . . . 55
3.3.3 Packing density and intercrystalline diffusivities . . . . 56
3.3.4 Adsorption isotherms and intracrystalline diffusivities . . . . . 58
3.4 Theoretical modeling framework . . . . 60
3.5 Sample fabrication and laboratory experiments . . . . 62
3.5.1 Sample fabrication and experimental methodology . . . . 62
3.5.2 Laboratory experiments and theoretical validation . . . . 64
3.6 Optimization of water harvesting processes . . . . 67
3.7 Proof-of-concept demonstration . . . . 70
3.7.1 Fabrication of proof-of-concept prototype . . . . 70
4 Adsorption-based atmospheric water harvesting: Demonstration of
an optimized device in arid climates 75
4.1 Device design and operation . . . . 76
4.2 Characterization and optimization of MOF layer . . . . 80
4.2.1 MOF-801 characterizations and device optimizations . . . . . 80
4.2.2 Estimation of intercrystalline diffusivities . . . . 80
4.2.3 Adsorption isotherms and estimation of intracrystalline diffu-sivities of M OF-801 . . . . 81
4.2.4 Optimization of MOF layer . . . . 83
4.2.5 Synthesis and optical characterization of OTTI aerogel . . . . 84
4.3 Device fabrication and experimental procedure . . . . 85
4.3.1 Device fabrication . . . . 85
4.3.2 Experimental procedure . . . . 85
4.4 Representative water harvesting cycles . . . . 87
4.4.1 Prediction of harvested water . . . . 90
4.5 Water harvesting cycles and prediction details . . . . 91
4.6 W ater quality analysis . . . . 95
4.6.1 Water collection apparatus . . . . 95
4.6.2 ICP-MS and FT-IR analysis of collected water . . . . 96
4.7 Thermal analysis for passive operation . . . . 99
4.8 Summary and discussion . . . . 100
5 Adsorption-based thermophysical battery for storage-based climate control: Generation 1, proof-of-concept 101 5.1 Background: Thermal energy storage . . . . 102
5.2 Working principles of thermophysical battery for climate control . . . 103
5.3 Design and operation of thermophysical battery . . . 106
5.4 Fabrication of thermophysical battery . . . . 108
5.4.1 Fabrication of ABU Stacks . . . . 108
5.4.2 Design and construction of thermophysical battery for experi-mental characterization . . . 110
5.5 Experimental characterization . . . . 112
5.5.1 Characterization of sorption properties of zeolite 13X-water . . 112
5.5.2 Initial charging of thermophysical battery prototype . . . . 113
5.5.3 Performance characterization of thermophysical battery proto-type ... ... 114
5.6 Sum m ary . . . . 118
6 Adsorption-based thermophysical battery for storage-based climate control: Generation 2 119 6.1 Design and material improvements for generation 2 thermophysical battery prototype . . . .. ... ... .. . . . . 120
6.1.1 Material of construction . . . . 120
6.1.2 Adsorption enclosure design . . . . 120
6.1.4 Zeolite infiltration and structural binder . . . . 124
6.1.5 Coolant tube and enclosure integration . . . . 124
6.2 System integration and characterization . . . . 125
6.2.1 System test platform . . . . 125
6.2.2 Systematic characterization (Cooling and regeneration modes) 127 6.2.3 Systematic characterization (Heating mode) . . . . 131
6.2.4 Computational prediction . . . . 132
6.3 Sum m ary . . . 134
7 Conclusions and future work 135 7.1 Conclusions and contribution . . . . 135
7.2 Future work . . . 137
7.2.1 Adsorption-based atmospheric water harvesting . . . . 137
List of figures
1-1 Types of vapor physisorption isotherms (amount adsorbed) as
a function of relative pressure (Pa/Psat). Irreversible
adsorption-desorption hysteresis due to capillary condensation are shown in II b,
IV a, and V type isotherms. Other types are classified as reversible (no
hysteresis). This figure is from
[171.
Reprinted with permission fromE lsevier. . . . . 30
1-2 Examples of (A) inorganic secondary building units and (B)
organic linkers. This figure is from H. Furukawa et al. Science, 2013.
[20]. Reprinted with permission from AAAS. . . . . 32
1-3 Examples of MOF structures. MOFs based on (A) Zn40(CO2)6
cluster with three different tritopic linkers, (B) Cu2(CO2)4 cluster with
three different tritopic linkers, (C) Cu2(CO2)4 cluster with three
dif-ferent hexatopic linkers, and (D) Mg30 3(CO2)3 with three different
tetratopic linkers. This figure illustrates that expansion of MOF struc-tures by factor of 2 to 17 with different organic linker combinations without changing its underlying topology. (A) qom, (B) tbo, (C) ntt, and (D) etb topologies. Yellow and green spheres represent the largest sphere that can fit within the MOF structures. This figure is from H.
Furukawa et al. Science, 2013.
[20].
Reprinted with permission fromAAAS... ... 33
2-1 Adsorption isotherms and isosteric enthalpy of adsorption.
(A) Adsorption isotherms (vapor uptake in weight percent vs. relative
pressure, absolute pressure normalized by saturation pressure) of 13X and MgY zeolites, and MOF-801 with water pairs characterized with dynamic vapor sorption analyzer (DVS Vacuum, Surface Measurement Systems Ltd., London, UK). Adsorbents were regenerated with high vacuum (< 1Pa) with a temperature greater than 100*C (B) Isosteric enthalpy of adsorption calculated using equation 2.1 and isotherms shown in (A) for MOF-801 and water pair with the linear interpolation
2-2 (A) DSC and (B) TGA results of 13X and MgY zeolites, and MOF-801 with water pairs. Data shown in this plot is obtained
with 1"C min- temperature ramp. Weights of saturated samples used in DSC experiments are 5.84 mg, 4.56 mg, and 9.37 mg for 13X, MgY, and MOF-801, respectively. Magnitude of heat flow is not important in DSC measurements as only relative heat flow between ramps 1 and
2 is considered in the calculation [24]. . . . . 39
2-3 TGA results of 13X and MgY zeolites, and MOF-801 at var-ious ramp rates Only the first ramp is shown [24]. . . . . 39
2-4 Thermodynamic cycle plotted in uptake vs. temperature. (a) Thermodynamic cycle representing an adsorbent undergoing desorp-tion (process a to b), cooling down (process b to c), adsorpdesorp-tion (pro-cess c to a) pro(pro-cesses between temperatures T and Tc. (B) to (D): Subcycles within the cycle shown in (A) with various evaluation tem-peratures, Teva. Path 1 to 2 (desorption) is carried out with DSC and
TGA experiments [24]. . . . . 41
2-5 Characterized enthalpies of adsorption. (A) integral adsorption
enthalpies and (B) adsorption enthalpies as function of vapor uptake, using Eqns (7) and (17), for 13X and MgY zeolites, and MOF-801 with water pairs at 30*C. Integral enthalpies are averaged over 31-32 wt.%,
35-36 wt.%, and 19-20 wt.% vapor uptakes for 13X and MgY zeolites,
and MOF-801, respectively. Errors reported herein are 95% confidence interval estimated from calculated adsorption enthalpies from all mea-surements [52, 53]. Previous calorimetric study of 13X (open black square [541) and isosteric enthalpy of MOF-801 (open red triangle) from figure 2-1 B are also shown. (Latent heat of evaporation of water,
hf9, at 30"C is 2430 kJ/kg). . . . . 42
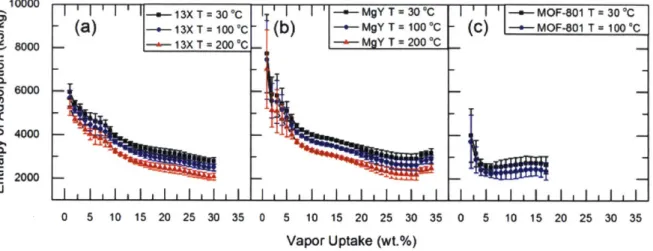
2-6 Enthalpies of adsorption as function of vapor uptake at
vari-ous temperatures for (A) 13X and (B) MgY zeolites, and (C) MOF-801 calculated using model present in figure 2-4. Errors reported herein
are 95% confidence interval estimated from calculated adsorption
en-thalpies from all measurements [52, 531. . . . . 45
2-7 Enthalpy of adsorption as a function of uptake calculated using
equation 2.17 by varying internal energy of adsorbed vapor at 30 C. Errors reported herein are 95% confidence interval estimated from
3-1 First-order performance estimate of an RAWG at different operating conditions with wet-coil/dry-coil analysis. (A)
First-order thermal efficiencies of an RAWG at various operating conditions (ambient temperatures and RHs). A compact heat exchanger from [57] [finned circular tube surface 8.0-3/8T with fin thickness of 0.33 mm and pitch of 3.18 mm, and frontal width and height of heat exchanger are 0.2 m and 0.26 m, respectively] was adopted with an assumption of
100% fin efficiency. Chilled water was assumed to be supplied at 2*C
with a flow rate of 0.25 kg s-1 and pump efficiency (?Jpump) of 50% [con-suming -60 W of electricity (Wpump)] The air speed was fixed at 1.3
m s-1 with a blower efficiency (Than) of 75% [negligible power
consump-tion (Wfan)I. The entire system was assumed to be photovoltaic-driven
with conversion efficiency (CONV) of 20% and a cooling coefficient of performance (COP) of 5. Thermal efficiency of the chosen sys-tem was evaluated as 1
lthermal mwater ' hfg . CONV/(Qcooiing/COP + Wpump/77pump + Wfan/77fan), where mwater, hfg, and Qcooling are harvest-ed/condensed water, latent heat, and cooling power provided by the refrigeration cycle, respectively. Each line represents the estimated ef-ficiency at different ambient temperatures. (B) Qualitative operating regime map of RAWGs based on the first-order analysis shown in (A) plotted on a psychrometric chart. Unshaded regions represent condi-tions where operation of RAWGs are infeasible. Note that sorption-based AWGs can operate across all regimes shown in this plot. . . 51
3-2 Working principle of water harvesting with MOFs. (A)
Water-adsorption isotherms of Zr-based MOFs (MOF-801, MOF-841, UiO-66, and PIZOF-2) at 25'C, showing a rapid increase in adsorption capaci-ties (in kilograms of water per kilogram of MOF) with a relatively small change in the relative humidity (RH) (PP,-, vapor pressure over satu-ration pressure) (10). The background color map shows the minimum difference between the temperatures of the ambient air (Tamb) and the condenser (Tdew) required for dew collection with active cooling. (B) Water-adsorption isotherms of MOF-801, measured at 25*and 65'C, illustrating that the temperature swing can harvest greater than 0.25
kg kg-1 at >0.6 kPa vapor pressure (20% RH at 25-C). (C) A MOF
water-harvesting system, composed of a MOF layer and a condenser, undergoing solar-assisted water-harvesting and adsorption processes. During water harvesting (left), the desorbed vapor is condensed at the ambient temperature and delivered through a passive heat sink, re-quiring no additional energy input. During water capture, the vapor is adsorbed on the MOF layer, transferring the heat to the ambient surroundings (right). Ads. and cond., adsorption and condensation, respectively. (D) Zr6O4(OH)4(-COO)12 secondary building units are
linked together with fumarates to form MOF-801. The large yellow, orange, and green spheres are three different pores. Black, C; red, 0;
3-3 N2 (red) and Ar (blue) isotherms of MOF-801 at 77 K and 87 K as
functions of relative pressure, respectively. Courtesy of E.A. Kapustin
of University of California at Berkeley. . . . . 54
3-4 Experimentally characterized harvested water from multiple water harvesting cycles using MOF-801. (A) Amount of har-vested water from the first five water harvesting cycles with a simu-lated solar flux of 1 kW m-2 (blue circles). Amount of harvested water of powdered MOF-801 characterized with the adsorption analyzer at
35*C and 1.2 kPa for adsorption, and 85'C and 1.2 kPa for desorption
(red circles) averaged over three different runs with error bar
repre-senting SD. (B) XRD patterns of MOF-801 before and after 10
adsorption-desorption cycles. . . . . 55
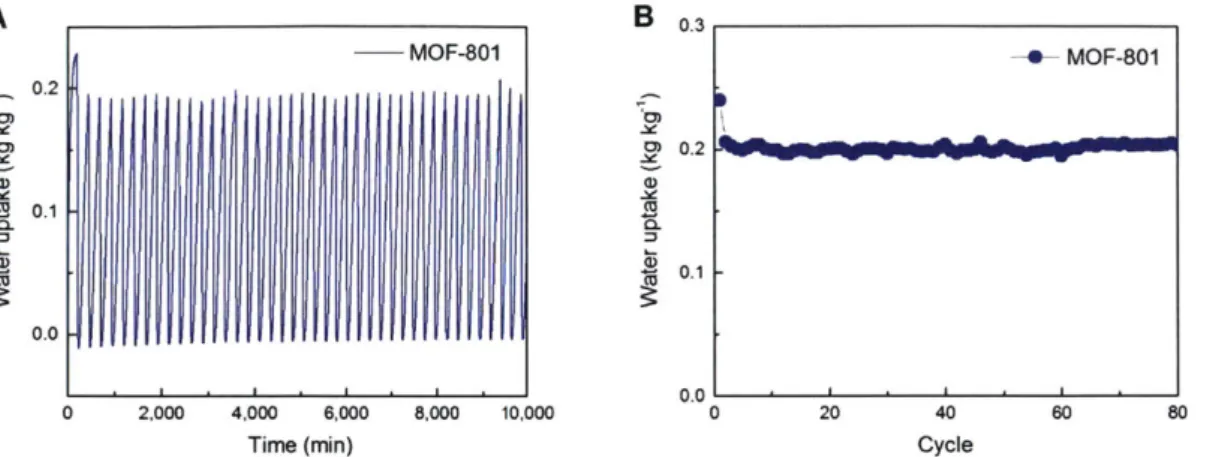
3-5 Hydrothermal stability of MOF-801. (A) Dynamic
adsorption-desorption behavior of MOF-801 over 80 cycles. For each cycle, room temperature adsorption for 200 min and 85*C desorption for 30 min (with 5YC min-' ramp rate) under a continuous flow of nitrogen-vapor mixture at ~30% RH. (B) Water uptake as a function of cycle number. 56
3-6 Intercrystalline vapor diffusivities of packed MOF-801 in air. (A) Characteristic void size as a function of packed adsorbent porosity
and adsorbent crystal radius. (B) Effective intercrystalline diffusivities of vapor as functions of porosity and temperature estimated for
MOF-801, crystal diameter of ~0.6 pm, at atmospheric pressure . . . . 57 3-7 SEM images of powdered MOF-801 used in laboratory and
proof-of-concept experiments. Crystal diameter of MOF-801 is
-0.6 m . . . .
.57
3-8 Adsorption isotherms of MOF-801 used in laboratory and
proof-of-concept experiments. measured in a (A) pure vapor and (B) nitrogen- vapor mixture at atmospheric pressure at various
tem-peratures ... ... 59
3-9 Intracrystalline vapor diffusivities of MOF-801 used in
labora-tory and proof-of-concept experiments. Fractional water uptake
(kg kg-1) as a function of time for MOF-801 in (A) pure vapor and in
(B) nitrogen-vapor mixture characterized at 25"C and 20% RH. The dy-namic responses are recorded during the isotherm measurements shown in 3-8. (C) Estimated intracrystalline diffusivities using equation 3.6
as functions of relative humidity and temperature . . . . 59
3-10 Schematic of vacuum chamber system used for water
harvest-ing experiments. Degassed vapor was provided from a primary water reservoir and simulated solar flux was provided through a glass view port. The chamber temperature was controlled with a heating cable and variac power supply. A data acquisition system was used to mea-sure the MOF-801 layer, vapor, and condenser temperatures, and the heat flux readings. A power supply was used to control the condenser tem perature... .... .... ... . ... . . ... 63
3-11 Experimental characterization of harvested water from an adsorption-desorption cycle for 801. (A) Image of MOF-801 layer and condenser. (B) Schematic illustrates the vapor
adsorp-tion and desorpadsorp-tion experiments carried out under isobaric condiadsorp-tions. Vapor adsorbed through the sample surface by diffusion. Desorption was achieved by applying an incident solar flux on an absorber with a solar absorptance of 0.91, and the desorbed vapor was condensed simultaneously in the condenser to harvest water. The condensation heat was monitored using a heat flux sensor (HFS) with active cool-ing through thermoelectric (TE) cooler. Ads. and Cond. represent adsorption and condensation, respectively. (C) Layer temperature and chamber vapor pressure as functions of time during the water harvest-ing cycle. The background color map represents the estimated RH from the chamber pressure and the layer temperature, and the upper abscissa represents the predicted overall water uptake using the
theo-retical model as a function of time, lower abscissa . (D)
Experimen-tally characterized water harvesting rate (L kg-1 s1) and cumulative
harvested water (L kg-1) during desorption. The shaded region
repre-sents the error based on uncertainties of the heat flux and MOF-801 weight measurements. The predicted temperature profile and cumula-tive water harvested are also included in (C) and (D), showing good agreement. The activated MOF-801 weight is 1.79 g with a layer thick-ness of 0.41 cm and a packing porosity (E) of -0.85. Subscripts sim
and exp denote simulated and experimental results, respectively. . . . 65
3-12 Predicted desorption dynamics of MOF-801 in air. Predicted
desorption water uptake (kg kg-1) and harvestable water (L m-2) with solar flux of 1 kW m-2. (A) porosity, E, of 0.9 with layer thickness of 3, 5, 10 mm, (B) E of 0.7 with layer thickness of 1, 3, 5 mm, and (C) e of 0.5
with layer thickness of 1, 3, 5 mm. MOF-801 was initially equilibrated at 20% RH, at 25"C, and the vapor partial pressure rapidly increased to 100% RH at 25"C during desorption for vapor condensation. Mass transfer resistance is predominantly due to Knudsen diffusion at E of
3-13 Adsorption-desorption dynamics of MOF-801 in ambient air .with 1 sun flux. Predicted adsorption-desorption dynamics with a
packing porosity (E) of 0.7, solar flux of 1 kW m-2, and various
thick-nesses (1 to 5 mm). MOF-801 was initially equilibrated at 20% RH at
25'C and the partial vapor pressure rapidly increased to 100% RH at 25'C during desorption for vapor condensation. After desorption, the
surrounding air-vapor mixture reverted to 20% RH. The duration of solar exposure for thicknesses of 1, 3, and 5 mm were 1, 2.3, and 4.2 hours, respectively. Note that only the duration of solar exposure for the 5-mm thick sample (red dotted line) is plotted for simplicity. The 1 mm, 3 mm, and 5 mm layers can harvest 0.08, 0.24, and 0.4 L m-2 of water per complete water harvesting cycle, respectively. More than
90% of the initially adsorbed water could be harvested under these
conditions. Inset shows a predicted temperature profile of the 5 mm thick layer during the adsorption-desorption processes. Black-body
so-lar absorber was assumed. . . . . 69
3-14 Proof-of-concept water harvesting prototype. (A) Image of a water harvesting prototype with activated MOF-801 of weight of ~1.34
g and a packing porosity (e) of -0.85 with outer dimensions of 7 cm by 7 cm x 4.5 cm. (B) Formation and growth of droplets of water as a
function of MOF temperatures (TMOF) and time of day. (C) Represen-tative temperature profiles for MOF-801 layer (experimental, red line; predicted, red dash), ambient air (grey line), condenser (blue line), and ambient dew point (green line), and solar flux (purple line) as functions of time of day (September 14, 2016). The background color map rep-resents the estimated RH from the condenser saturation pressure and the layer temperature, and the upper abscissa represents the predicted water uptake using the theoretical model as a function of time, lower
abscissa . Because of losses from the absorber solar absorptance (a,
0.91) and the glass plate solar transmittance (-r, 0.92), 84% of the solar
flux shown in (C) was used for desorption. The layer temperature and full water harvesting potential based on complete desorption was pre-dicted using the solar flux and environmental conditions at the end of the experiment (dash lines). The fluctuations of the solar flux during time 10:20 to 11:00 were due to the presence of clouds. Subscripts sim
and exp denote simulated and experimental results, respectively. . . . 72
4-1 Weather station data near testing location (Phoenix, Arizona,
United States on May 18, 2017). Ambient and dew point
temper-atures and relative humidity (RH) are shown. Night-time RH varies between 20-40% and day-time RH varies between 10-20%. Dew point temperature is as low as -10*C. Data was obtained from Pheonix Sky
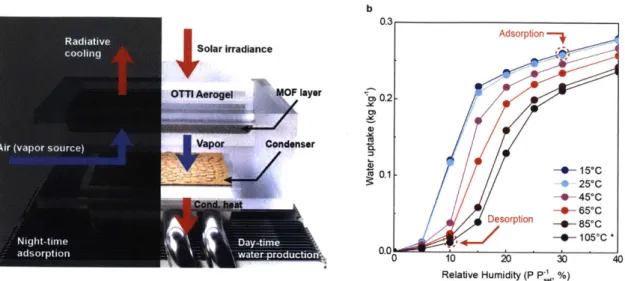
4-2 Working principle of MOF-801 based water harvesting device and adsorption isotherms. (A) Illustrative schematic of the
wa-ter harvesting device undergoing adsorption (night-time, left half) and solar-assisted water production (day-time, right half) processes. Dur-ing adsorption, air is circulated around the MOF layer and water from air is adsorbed. Passive radiative cooling lowers the MOF layer tem-perature below ambient by dissipating thermal radiation to clear cold sky to increase the effective RH for adsorption. During water produc-tion, optically transparent and thermally insulating (OTTI) aerogel is stacked on top of the MOF layer to suppress convective heat loss from the solar absorber. The desorbed vapor is condensed on a condenser and heat of condensation is rejected to the ambient by a heat pipe heat sink. (B) Water adsorption isotherms of MOF-801 in kg kg- (kg of water per kg of MOF-801) as a function of relative humidity (PPaj,
vapor pressure over saturation pressure) at temperatures of 15 0C, 25'C,
450C, 650
C, and 85'C measured using a sorption analyzer (Q5000 SA, TA Instruments). *Isotherm at 105"C was predicted using the
charac-teristic curve based on the isotherm at 850C [311. Dotted red circles
indicate representative conditions achieved during night-time
adsorp-tion and day-time water producadsorp-tion in Arizona, United States. . . . . 77
4-3 Photo of experimental setup during night-time adsorption.
The MOF layer with its acrylic frame was mounted into cover of an air-tight plastic storage container with the pyromark coated side up for
night-time radiative cooling. A -5 kg metal block was placed inside to
secure the apparatus against wind damage. The sides of the air-tight container were modified to fit a fan (0.9 W; 12 VDC) and enable cross flow of ambient air (vapor source). Initially, the black absorber side was covered with aluminum foil to reach thermal equilibrium with the ambient. At the start of the adsorption experiment, the aluminum foil was removed and a temperature drop due to the passive radiative
cooling was observed. . . . . 79
4-4 Water harvesting device test apparatus. (A) Photo of the device
test apparatus during the solar-assisted water production with 1.8x optical concentration. Test location: Tempe, Arizona, United States.
(b) Photo of the water harvesting device showing the MOF layer (5 cm by 5 cm base, porosity of 0.67 or packing density of 464 kg m-3 with 2.57
mm thickness), condenser (4 cm by 4 cm), and thermocouples through the view port. OTTI aerogel, heat pipe heat sink, and insulation are
also show n. . . . . 79
4-5 SEM images of powdered MOF-801 used in climate testing.
Crystal diameter of MOF-801 is 1 0.15 pm, mean value and error
4-6 Effective intercrystalline vapor diffusivity of packed MOF-801 in air (black) as a function of temperature for the porosity of 0.67 and crystal diameter of 1 pm. Vapor diffusivity in air (red) as a function
of temperature is also shown for comparison. . . . . 81
4-7 Vapor adsorption isotherms and intracrystalline diffusivities
(A) Vapor adsorption isotherms of MOF-801 at 15, 25, 45, 65, and 85'C. *Isotherm at 105"C was predicted from the characteristic curve [31] based on the 850C isotherm. (B) Vapor adsorption isotherms of MOF-801 at 25'C before (red) and after climate testing (black). (C)
and (D) Fractional water uptake (kg kg-1) as a function of time for
MOF-801 characterized at 25 and 65*C at 25% RH, respectively. . . . 82
4-8 Adsorption-desorption dynamics of MOF-801 in ambient air
at 30% RH. Predicted adsorption-desorption dynamics with a pack-ing porosity of 0.67, desorption heat flux of 1 kW m-2, natural con-vective heat transfer coefficient of 10 W m-2 K-1, ambient temperature of 25C, and thicknesses of 1, 3, and 5 mm. MOF-801 is initially equilibrated at 30% RH (25'C), and the partial vapor pressure rapidly increased from 30% RH to 100% RH (at 25"C) for condensation/water
harvesting at 25'C with a desorption heat flux of 1 kW m2. Durations
of solar exposure for 1, 3, and 5 mm thick MOF layer are 0.8, 2.1, and 4 hours, respectively. After desorption, solar exposure is stopped and the surrounding RH reverted to 30% RH for water adsorption from air. The temperature profile of a 5 mm thick MOF layer is also shown. Based on the predicted performance for the porosity of 0.67, the MOF layer thickness should be -3 mm to enable complete saturation under the limited time window for adsorption (approximately under 8 hours in 20-40% RH environment). For simplicity, constant intracrystalline diffusion coefficient of 3E-17 m2
S-1 is used for the simulation (Figure 4-7 C) and sufficiently fast air freestream velocity is assumed to keep
the RH of 30% at the MOF layer . . . . 83
4-9 Optical and thermophysical properties of OTTI aerogel. (a)
Measured transmittance of an 8 mm thick aerogel sample using UV-Vis-NIR spectrophotometer (Cary 5000, Agilent). The AM1.5 solar spectrum is shown for comparison (red line). The orange area rep-resents the transmitted spectrum by the aerogel. The solar weighted transmission of the sample is 94.5%. (b) Predicted thermal conduc-tivity of an 8 mm thick aerogel sample. Contributions from radiation, solid conduction, and gas convection are also shown. Courtesy of L.
4-10 Representative water harvesting test results (cycles 2 and
5). (A)-(B) Representative temperature profiles (environmental, MOF
layer, dew point, and condenser) and solar flux (global horizontal ir-radiance (GHI) or direct normal irir-radiance (DNI)) as a function of local time for representative non-concentrated (Cycle 2, May 14-15,
2017) and concentrated with 1.8x (Cycle 5, May 17-18, 2017) cycles,
respectively. (C)-(D) Representative photos illustrating droplet con-densation on the copper plate condenser (4 cm by 4 cm) during the water harvesting process as a function of local time for representative non-concentrated (cycle 2) and concentrated (cycle 5) cycles, respec-tively. Shortly after the solar exposure, the view port fogged up due to condensation of desorbed vapor for both cycles. Thermocouples (TCs) measuring the condenser, air gap, and the MOF layer temperatures are also shown. Due to the higher solar flux with the concentration, the rate of temperature increase of the MOF layer was significantly faster than the non-concentrated cycle, reducing the time required for des-orption. The temperature slope change at -11:45 local time indicates near completion of desorption. The predicted amount of harvested wa-ter for the non-concentrated (cycle 2) and concentrated (cycle 5) cycles were ~0.12 L and -0.28 L per kg of MOF, respectively. Scale bars are
1 cm . . . . 89
4-11 Water harvesting cycles 1, 3, and 4. (A) Representative
temper-ature profiles (environmental, MOF layer, dew point, and condenser) and solar flux (global horizontal irradiance (GHI)) as a function of lo-cal time for the cycle 1. (B) Representative photos illustrating droplet condensation on the copper condenser (4 cm by 4 cm) during desorp-tion process as a funcdesorp-tion of local time for the cycle 1. (C) and (D), and
(E) and (F) represent temperature profiles, solar flux (GHI for cycle 3 and direct normal irradiance (DNI) for cycle 4), and representative
photos of droplet condensation for cycle number 3 and 4, respectively. Cycle 4 was carried out under DNI with optical concentration of 1.8x.
Scale bars are 1 cm . . . . 92
4-12 Computational predictions of non-concentrated water
har-vesting cycles. (A)-(C) Temperature profiles [Experimental (red
solid line); predicted (red dotted line)], heat flux for desorption [(so-lar flux)*(optical and absorptance loss)], and predicted vapor uptake during the water harvesting as a function of time of day for cycles 1, 2, and 3, respectively. For cycle 1, an initial equilibrium RH of 55%, and for cycles 2 and 3, an initial RH of 40% was assumed based on the RH and radiative cooling measurements shown in figures 4-10 and 4-11. For simplicity, a constant intracrystalline diffusion coefficient of
4-13 Computational predictions of concentrated water harvesting cycles. (a)-(b) Temperature profiles [Experimental (red solid line);
predicted (red dotted line)], heat flux for desorption Rsolar flux)*(optical and absorptance loss)*(optical concentration)], and predicted vapor uptake during water harvesting as a function of time of day for cy-cles 4 and 5, respectively. For both cycy-cles, an initial equilibrium RH of 40% was assumed based on the RH and radiative cooling measurements shown in figures 4-10 and 4-11. For simplicity, a constant intracrys-talline diffusion coefficient of 1.2E-16 m2
S1 was used for the simulation
(figure 4-7 D ) . . . . 94
4-14 Water collection apparatus. (A) Schematic of water collection ap-paratus with MOF-801 layer. (B) Representative temperature (MOF chamber and condenser chamber) and pressure profile (MOF chamber)
for a desorption-adsorption cycle as a function of time. . . . . 96
4-15 ICP-MS analysis of control water (HPLC) and water collected
from MOF-801 (MOF). Iron (Fe; 56), copper (Cu; 63), zirconium
(Zr; 90 and 91), silver (Ag; 107), and indium (In; 115) concentrations were analyzed. Zirconium, silver, and indium concentrations in both HPLC and MOF samples were found to be less than 1 ppb (part per billion), indicating that the compositions from MOF-801 did not con-taminate the harvested water. Iron concentrations in the harvested water (MOF) and control water (HPLC) were -3 ppb and less than 1
ppb, respectively. . . . . 97
4-16 Comparison of FT-IR spectra (transmittance as a function of wavenumber) for solid fumaric acid, HPLC grade water (HPLC), and water -collected from MOF-801 (MOF). Courtesy of E.A. Kapustin at
U C Berkeley. . . . . 98
5-1 Working principle of adsorption-based thermophysical
bat-tery. To provide cooling or heating, the thermophysical battery is operated by cycling the ABU between the thermodynamic states 1 and 2, and the ECU between states 3 and 4. A fully-charged thermo-physical battery consists of the ABU at thermodynamic state 1 and the refrigerant-filled ECU at state 3. Discharging process takes place with the ABU undergoing adsorption, and the ECU undergoing evap-oration, until the ABU is saturated with the refrigerant at state 2, and the ECU is empty at state 4. The recharging is done by providing ther-mal energy or heat to ABU, causing refrigerant desorption. Desorbed refrigerant is then condenses in the ECU. The condensation heat in
ECU during recharge can be rejected to the ambient. As a result, the ABU and ECU transition back from thermodynamic states 2 and 4 to
5-2 Thermodynamic cycle of an adsorption-based
thermophysi-cal battery. Where Tevrp, Pevap, Tcond, and Pcond are the evaporator temperature and pressure, and condenser temperature and pressure, respectively. During the system operation, the temperature of the ad-sorbent varies between Ta and Td (e.g., 60 to 100'C) and the pressure is set by the evaporator saturation temperature, unless there is a large pressure drop between the adsorbent and evaporator. During the
sys-tem regeneration, the sys-temperature of the adsorbent varies between T
and T, (e.g., 100 to 250"C) and the pressure is set by the condenser
sat-uration temperature. Qevap denotes the heat input to the evaporator
(cooling) during the operation, and Qcond is the heat output from the
condenser during the regeneration process. Qadsorb is the heat released via adsorption process (heating), and Qdesorb is the heat input into the adsorbent during the regeneration process. . . . . 105
5-3 Schematic of adsorption-based thermophysical battery. (A)
Discharge mode. Heat is absorbed in the ECU due to refrigerant evap-oration and generated in the ABU due to adsorption of gaseous refrig-erant. (B) Recharge mode. Heat is provided to the ABU for refrigerant desorption and heat is rejected from the ECU due to refrigerant con-densation. (C) The ABU consists of multiple adsorbent stacks inter-faced with coolant lines and heaters for desorption. The ECU consists of helical copper tube evaporator and condenser for evaporation/con-densation processes. Detailed ABU and ECU geometry is shown in cross-sectional views (section A-A). (D) Geometric characteristics of
ABU stacks are shown. . . . . 107
5-4 The experimental test bed constructed to demonstrate the
concept of the thermophysical battery. Location of temperature
(T), pressure (P), and flow (M) sensors are labeled. A recirculating temperature bath was used as a temperature controller to provide coolant at desired temperature to the ECU. An air-cooled heat ex-changer was used to dissipate generated heat from the ABU to the am bient. . . . . 108
5-5 ABU stack fabrication process: (A) copper foam (160 mm x 80
mm x 2 mm) with coolant cavities (12 mm diameter), (B) aluminum fin (160 mm x 80 mm x 0.5 mm) with coolant cavities (10 mm di-ameter), (C) adhesive bonding of copper layers with aluminum fin at elevated temperature using a thermal epoxy, (D) treatment of bonded stacks with 2 wt.% nitric acid to increase hydrophilicity prior to adsor-bent infiltration, and (E) fabricated double-sided adsoradsor-bent stack after zeolite 13X infiltration in water suspension. Average packing density (dehydrated) was characterized to be around 500-600 kg m-3. The crystal density of zeolite 13X is 1470 kg m-3 [961 . . . . 109
5-7 CAD design of ABU. A computer-aided design (CAD) showing the
internal structure of the ABU and the external connectors to interface with the coolant lines, temperature and pressure sensors. The top cover of the ABU, which seals the ABU from the ambient is not shown for clarity. Courtesy of A.S. Umans of MIT. . . . .111
5-8 Photos and schematic of integrated ABU and ECU. Helical
copper coils serve as condenser (top) and evaporator (bottom) for the
ECU. In the ABU, flexible bellows tubings are used to connect ABU
coolant lines to liquid feedthroughs. Each ABU block consists of
-100
double-sided adsorbent stacks, each interfaced with eight coolant lines. Mass of specific components in the thermophysical battery prototype: zeolite 13X (-5 kg), copper foam binder (4.5 kg), aluminum fin (2.4
kg), water (1.8 kg), Copper coolant tubings (ABU, 4.6 kg; ECU, 1.7 kg). Volume: Zeolite 13X stacks (10.9 L), water (1.8 L) . . . .111 5-9 Adsorption and desorption isotherm of zeolite 13X-water pair
at 25*C. Measured using an adsorption analyzer (DVS Vacuum).
Courtesy of Dr. X. Li of MIT. . . . . 112
5-10 Scanning electron microscope (SEM) image of zeolite 13X infiltrated in porous copper foam. SEM images were taken using
6010LA SEM , JEOL. . . . . 113 5-11 Schematic illustrating initial charging of thermophysical
bat-tery using vacuum pump and liquid nitrogen cold trap. . . . 114
5-12 Representative unit cells for ECU and ABU for computational prediction. . . . . 115 5-13 Performance characterization of thermophysical battery.
Va-por pressure (A) and vaVa-por density (B) as a function of time in the
ABU and ECU. (C) Temperature profiles of ABU and ECU. Solid lines
represent spatially averaged predicted temperatures. (D) Predicted evaporation rate and net evaporation with computational model. Inlet and outlet temperatures of the coolant loops in the (E) ABU and (F)
ECU. Solid or dashed lines represents predictions. Courtesy of Dr. S.
Narayanan, currently at Rensselaer Polytechnic Institute. For more
details, see [25]. . . . . 116
5-14 Performance characterization of thermophysical battery. Power
profiles of the ABU and ECU as a function of time. Solid lines rep-resents computational predictions. Courtesy of Dr. S. Narayanan, currently at Rensselaer Polytechnic Institute. For more details, see [25]. 117
6-1 Exploded view of the adsorption enclosure. The lapped seam will
allow for the stacks to be pressed tight against the enclosure walls prior to the welding of the lap joint. This measure will ensure a conformal contact line across the fin-enclosure interface. Courtesy of Dr. S. R.
6-2 Schematic representation of the proposed scheme for the in-tegration of the adsorption stacks into the enclosure. The fins
act as a heat spreader by allowing a conformal contact interface with the heated enclosure walls. R represents thermal contact resistance.
Courtesy of Dr. S. R. Rao of MIT. . . . . 122
6-3 Photo of brazed copper foam binder with fin. (A) Top view
of the foam-fin-foam composite layer. (B) Side view of the adsorption stack showing the clean interface produced after the brazing operation.
Courtesy of Dr. S. R. Rao of MIT. . . . . 123
6-4 Highlights of the current design of the adsorption enclosure.
The light weight sheet metal geometry has grooved top and bottom faces, that allow of a robust welded seal, as well as a gap for unimpeded
vapor transport. . . . . 125
6-5 Photo of integrated thermophysical battery generation 2 pro-totype test platform. 1,2: adsorption beds (ABU), 3: vapor
man-ifold, 4: ECU, 5: radiator, 6: climate core, and 7: desorption control panel. The pictured vacuum hose is used for initial charging the system
on ly. . . . . 126
6-6 Schematic of the heating and cooling modes of the
thermo-physical battery generation 2 prototype test platform. A vapor
manifold connects the evaporator and adsorption bed units, allowing
vapor transport from the evaporator to the adsorption bed. . . . . 126
6-7 Experimental characterization of generation 2 thermophysi-cal battery prototype (cooling mode). (A) Schematic
illustrat-ing thermophysical battery dischargillustrat-ing. (B) Vapor pressure profiles in ABU and ECU during characterization. (C) Heating (ABU) and cooling (ECU) power profiles. (D) Temperature (ABU) and predicted water uptake profiles. exp and model denote experimental data and
prediction, respectively . . . . . . . . . . 128
6-8 Experimental characterization of generation 2 thermophysical
battery prototype (cooling mode). Coolant in and out
tempera-tures (A) ABU and (B) ECU. . . . . 129
6-9 Experimental characterization of generation 2 thermophysical
battery prototype (regeneration/charging mode). (A) Schematic
illustrating thermophysical battery regeneration/charging. (B) Vapor pressure profiles in ABU and ECU during regeneration/charging. (C) Temperature (ABU) and predicted water uptake profiles. exp and
model denote experimental data and prediction, respectively. . . . . . 130
6-10 Experimental characterization of generation 2 thermophysical battery prototype (heating mode). (A) Vapor pressure profiles in ABU and ECU during characterization (heating mode). (B) Heating (ABU) and cooling (ECU) power profiles. (C) Temperature (ABU)
6-11 Simplified unit cell from figure 5-12 for computational mod-eling. (A) Schematic of ABU single stack. (B) Simplified unit cell
(enclosed red box) for computational prediction of ABU. Red arrow represents a boundary for heat transfer to the ambient. Remaining boundaries are adiabatic. Blue arrow represents a boundary for vapor transport. (C) Thermal resistance circuit connecting ABU and ECU to ambient via overall heat transfer coefficient (UA). Predicted adsorption rate as a function of time was used to model the ECU cooling power. 133
Chapter 1
Introduction
1.1
Motivation
Water and thermal energy systems are tightly coupled. About 96% of primary energy
is converted to heat for end use
[1],
and more than 90% of the generated energyworld-wide is consumed and wasted thermally
[2].
In order to extract, purify, andtreat the water, energy in a form of heat is often required (e.g., thermal distillation and multi-stage flashing desalination). For water purification with work (electrical energy)-driven processes (e.g., reverse osmosis), most electricity produced world-wide is generated from heat sources via heat engines. For electricity generation via solar-photovoltaic, it is essentially a solid-state heat engine operated with a heat source at -5800 K (temperature of the sun). On the other hand, water is used in various energy production processes, such as Rankine cycle power plants which produces electricity with phase-change and sensible cooling of water. In fact, -50% of fresh
water consumption is drawn for power generation cycles in the United States
11].
Inaddition, vast amount of energy is available and wasted as a form of low-grade heat
around 100'C [3, 4, 51. Utilizing these low-grade heat sources for energy and water
applications can significantly reduce emissions of greenhouse gases and pollutants, and mitigate global problems in energy and water security.
While we are expecting severe global problems in energy and water security in the coming decades [61, two-thirds of the world's population is already experiencing
water shortages
17].
Mekonnen and Hoekstra [7] analyzed the global water scarcityby estimating the regional monthly withdrawal of water and shown that nearly 4
billion people live in the regions that experience severe water scarcity at least 1 month of the year. This water scarcity is a particularly severe challenge in arid and desert climates. Water in the form of vapor and droplets in the atmosphere, estimated to be about 13 thousand trillion liters
[8],
is a natural resource that could address the global water problem. However, harvesting this water by dewing, i.e., cooling air below the dew point and facilitating condensation, can be extremely energy(Pap) over saturation vapor pressure (Psat)] is low (i.e., below -40%). In contrast, porous materials, such as zeolites, silica gels, and metal-organic frameworks (MOFs),
can harvest water from air by adsorption over a wide range of humidity values
19,
10, 11], even under RHs below 40% where the state-of-art dewing is impractical
[121. Furthermore, thermally-driven adsorption-based AWGs can operated with grade heat sources. High-efficiency adsorption-based water harvesting utilizing low-grade heat sources will enable significant increases in distributed and portable water generation and mitigate global water crisis.
In addition to needs for water, there are significant demands for energy in the form of heating and cooling. While state-of-the-art energy storage systems are mainly based on electrochemical technology [131, thermally-driven sorption-based thermal energy storage systems can provide heating and cooling in buildings and transportation sec-tors. Climate control in residential, industrial, and commercial buildings account for more than 75% of the total energy utilization [141. The buildings sector alone accounts for almost one-third of the global energy consumption [14]. Furthermore, petroleum consumption in the transportation sector due to climate control is also significant, posing global problems in oil security [15], and emission of greenhouse gases and pollutants [16]. For mobile applications, compact, light-weight, and high energy density climate control is desirable. The development of thermally-driven and high energy density heating and cooling climate control will play a significant role in addressing the aforementioned global issues.
In both atmospheric water harvesting and climate control applications, sorption-based systems have several advantages over the conventional work-driven systems.
(i) Simple operation, unlike vapor compression cycles, sorption-based approaches
do not rely on compressor work and operates by adsorption and desorption driven
by chemical potential difference. (ii) Low-maintenance due to simplicity of
op-eration and lesser moving parts. (iii) Possible utilization of low-grade heat
sources, if the entire system is constrained to be low-grade heat-driven, the
con-ventional work-driven systems suffer from inherently low heat to work (electricity) conversion efficiency. In this regard, sorption-based approaches provide superior ad-vantages over the conventional systems. This thesis aims to contribute towards the development of thermally-driven adsorption-based atmospheric water harvesting and compact thermal energy storage technologies. To enhance the efficiency and compact-ness, detailed computational and experimental studies were carried out to optimize geometry of these systems for chosen adsorbents.
1.2
Background: Adsorption and its applications
Adsorption phenomena occurs when a solid surface (adsorbent) is exposed to a fluid or mixture of fluids (gas or liquid) known as adsorbate (at adsorbed state) or adsorptive (at fluid state) [17]. It is defined as an increase in adsorbate concentration and density at the interface, where interfacial area plays a crucial role. Typical adsorbents are
highly porous and have Brunauer-Emmett-Teller (BET) [181 surface area, typically
characterized with nitrogen or argon gas, greater than 100 m2 g'. Hydrophilic zeolites
have BET surface area around 600 m2 g-1 [19]. Recent MOFs exhibit BET surface area
range from 1,000 to 10,000 m2 g1 [20], exceeding conventional adsorbents. Adsorption
is used in various applications, including desiccant/dehumidification and atmospheric water harvesting (adsorption of vapor from air), catalysis (with high surface area of porous adsorbents), gas separation and storage (selective gas adsorption and storage), climate control (evaporation/adsorption-assisted cooling and heating), desalination (evaporation/adsorption of seawater), and gas detection (selective gas adsorption and sensing).
The adsorption process can be classified as (i) chemisorption and (ii) physisorp-tion. Chemisorption process exhibits high interaction between the adsorbate and adsorbent due to chemical bonding (e.g., hydrogen bond). Physisorption process has weaker surface interaction and do not involve chemical bonding formation (e.g., van der waals force). Physisorption is always exothermic where the energy release is higher but the same order of magnitude as the condensation energy of adsorbate. For the chemisorption, the energy change is on the same order of magnitude as energy change in similar chemical reaction process. The process of returning the physisorbed species in its original form is desorption and energy (heat, endothermic) is required to sepa-rate the adsorbate and adsorbent. Because the desorption of the chemisorbed species requires high energy (also usually high temperatures) or may not be recoverable, physisorption is more widely applicable in adsorption-based applications. Physisorp-tion is described as reversible and continuous pore filling within porous adsorbents. Similar mechanism includes capillary condensation which occurs at relatively high RH conditions and with pore size of adsorbent greater than the critical diameter of adsorbate (see chapter 1.3.1).
The amount of adsorbed adsorbate depends on the pressure and temperature of an adsorbate-adsorbent system [17]. Under the equilibrium pressure and temperature, this characteristic is adsorption isotherm and is used to classify types of physisorbents. Different types of adsorption isotherms are shown in figure 1-1. These adsorbents can be used to capture and harvest water from air. However, type I adsorbents (e.g., zeolites) require high regeneration temperature to release and condense water, typically in excess of 200C. For the type II isotherm (e.g., silica gels), adsorbents can only adsorb limited amount of vapor in low RH conditions. Meanwhile, type IV and V (step-wise) isotherms can capture large amount of vapor from air as long as the ambient RH is higher than the position of the adsorption step. Furthermore, step-wise isotherm adsorbents can be regenerated at significantly lower temperatures compared to the type I adsorbents. Due to the synthetic flexibility of MOF structures
which makes them an ideal candidate for the adsorption-based atmospheric water harvesting.
For the climate control application, where both heating and cooling powers are desired, the type I adsorbent is well-suited. This is due to the type I adsorbents can adsorb large amount of adsorbate at low pressure (i.e., low cooling temperature) and high adsorbent temperature (i.e., high heating temperature). Water is often preferred as an adsorbate due to its high enthalpies of adsorption and evaporation
[23, 24], a promising combination for the high energy density thermal energy storage. Typical type I zeolites have vapor adsorption capacity around 0.3-0.4 kg kg-1 [19, 24]
at RH below 1%. However, as stated above, the regeneration temperatures excess of
200'C is typically required [24, 25]. Based on aforementioned reasons, physisorptions
of water in MOFs (step-wise) and zeolites (type I) are investigated in this thesis for the atmospheric water harvesting and storage-based climate control applications, respectively.
E
CD
Relative pressure p p*
Figure 1-1: Types of vapor physisorption isotherms (amount adsorbed) as a function of relative pressure (Pa,/Psat). Irreversible adsorption-desorption hys-teresis due to capillary condensation are shown in II b, IV a, and V type isotherms. Other types are classified as reversible (no hysteresis). This figure is from [17]. Reprinted with permission from Elsevier.
la Ib Ila lib
l IVa lVb
VI
Classification of vapour physisorplon isotherms with addition of types
I , 1 b and IV b to te
six types proposed by
1.3
Background: Metal-organic frameworks (MOFs)
Since the first discovery of metal-organic frameworks (MOFs), MOF-5 [26] and
HKUST-1 [27HKUST-1, great interest and research have strongly contributed to the development of
MOFs. They are a new class of porous material that can exhibit ultra high BET surface area (1,000 to 10,000 m2 g1) and porosity greater than 50% of MOF crystal volume [20]. MOFs are made by linking metal clusters (secondary building units) and organic linkers with strong bonds [20, 26, 28]. A few examples of inorganic metal clusters (secondary building units) and organic linkers are shown in figure 1-2. Due to the flexibility of cluster and linker combinations, more than 20,000 different MOF structures has been reported within the past 10 years [20]. Several examples of MOF structures are shown in figure 1-3. This figure also illustrates that the expan-sion of MOF structures is possible with different organic linker combinations without changing underlying topology. Due to this possibility of unique modification of MOF structures, MOs can specifically designed to ideally fit various applications includ-ing atmospheric water harvestinclud-ing [21, 22]; climate control [29, 30, 31]; gas storage, separation, and catalysis [20, 32, 33, 34]; and dehumidification [35].
1.3.1
Water adsorption in MOFs
This thesis examines water adsorption properties of MOFs for atmospheric water har-vesting. There are three main mechanisms of water adsorption in porous adsorbents: (i) water adsorption on metal clusters within MOF structures, (ii) reversible pore filling, and (iii) irreversible capillary condensation [9]. Irreversible capillary conden-sation leads to hysteresis loop in adsorption isotherm during adsorption and desorp-tion processes (e.g., type IVa isotherm shown in figure 1-1). For designing MOs for water adsorption, it is important to consider several aspects: hydrothermal stability, hydrophilicity, and critical pore diameter. Studies [9, 36, 37, 38] have shown that the critical pore diameter of MOFs around 2 nm revealed maximum internal volume for water adsorption while avoiding irreversible capillary condensation. This critical
diameter, D., is given by the following equation: D, = 4uTc/(Tc - T) where -, Tc,
and T are van der Waals diameter and critical temperature of water, and adsorption temperature, respectively. The precise control of the critical diameter and its depen-dence in water adsorption are well illustrated in [36]. In this study, the initial pore
diameter of 2.2 nm MOF material (Co2Cl2BTDD) reduces down to 2 nm upon initial
water adsorption leading to a record high reversible water uptake (-1 kg kg-1) at RH
around 30%. For adsorbents with pore diameter larger than 2 nm leads to capillary condensation that have hysteresis loop.
A
M2)C02)4 Zn40(CO2)8 MAM) (M = Cu, Zn, Fe,
(M Zn, Cr, MorCo, and In, and Ga) Ru)
ln(CsHO4N2)4 Na(OH)2(SO)3
ZreO4(OH)4
-(CO2)12 Zreoe(CO2)
{LI~ ~M 303(C02)3
Co, Ni, Mn, Cu2(CNS)4 Zn(C3H3N2)4 NI4(C3H2N2)s Fe, and Cu)
8
O OOHH
0X
Oxalic acid Fumaric H2BDC H2BDC-X
acid (X = Br, OH, NO2, and NH2) H4ATC HOOC OOH HOOC -OOH H4ADB HO H4D0T H2BDC-(X)2 (X = Me. C1, COOH, 0C3Hs, and OC7H7) H OS H3THBTS H31mDC TIPA H3BTP H H2NYN COOH 0T Gly-Ala HOOC ADP HeBTETCA HOOZ ev XZOOH X C1 HOAOOH HeTPBTM (X = CONH) C1 H8BTEI (X = C=C) H6BTPI (X = CeH4) H6BHEI (X - CaC-CCC) H6BTTI (X -(C8H4)2) I
HOPTEI (X = CeH4-CaC) HeTTEI (X -C=C-C6H4-C5C) H6BNETPI (X = CEC-CaH4-CaC-CC) H6BHEHPI (X = (CEH4-C2C)2) CDPBN COO A BPP34C1ODA x H3BTE (X = C=C) H2BTC H3BBC (X = C6H4) HOOCk0C 'c OOH H3BTB (X = CH) H3TATB (X = N) OOH HO H4DH11PhDC OOH lr(H2DPBPyDC)(PPy)2+ H OOH H4DH9PhDC
Figure 1-2: Examples of (A) inorganic secondary building units and
ganic linkers. This figure is from H. Furukawa et al. Science, 2013. [201. F
with permission from AAAS.


![Figure 2-3: TGA results of 13X and MgY zeolites, and MOF-801 at various ramp rates Only the first ramp is shown [24].](https://thumb-eu.123doks.com/thumbv2/123doknet/14733098.573495/39.917.118.746.585.815/figure-tga-results-mgy-zeolites-various-rates-shown.webp)