HAL Id: hal-00296870
https://hal.archives-ouvertes.fr/hal-00296870
Submitted on 20 Feb 2006
HAL is a multi-disciplinary open access
archive for the deposit and dissemination of
sci-entific research documents, whether they are
pub-lished or not. The documents may come from
teaching and research institutions in France or
abroad, or from public or private research centers.
L’archive ouverte pluridisciplinaire HAL, est
destinée au dépôt et à la diffusion de documents
scientifiques de niveau recherche, publiés ou non,
émanant des établissements d’enseignement et de
recherche français ou étrangers, des laboratoires
publics ou privés.
Kinematic characteristics of hailstorms in Northern
Greece
D. V. Foris, T. S. Karacostas, A. A. Flocas, T. I. Makrogiannis
To cite this version:
D. V. Foris, T. S. Karacostas, A. A. Flocas, T. I. Makrogiannis. Kinematic characteristics of hailstorms
in Northern Greece. Advances in Geosciences, European Geosciences Union, 2006, 7, pp.147-151.
�hal-00296870�
European Geosciences Union
© 2006 Author(s). This work is licensed under a Creative Commons License.
Geosciences
Kinematic characteristics of hailstorms in Northern Greece
D. V. Foris1, T. S. Karacostas2, A. A. Flocas2, and T. I. Makrogiannis21Meteorological Applications Center, Greek Agricultural Insurance Organization (EL.G.A.), “Macedonia” Airport, 551 03
Thessaloniki, Greece
2Aristotelian University of Thessaloniki, School of Geology, Department of Meteorology and Climatology, 540 06
Thessaloniki, Greece
Received: 7 October 2005 – Revised: 6 December 2005 – Accepted: 7 December 2005 – Published: 20 February 2006
Abstract. The purpose of this study is the analysis of radar
data, digitally recorded, during an operational hail suppres-sion program in the region of Central Macedonia, Greece, for the warm period of the years 1997–2001. Kinematic charac-teristics, such as lifetime and distance traveled by hailstorms, as well as direction of motion and speed, have been related to type of storms and season.
It has been found that singlecells are short-lived and travel short distances, while multicells are long-lived and travel long distances. On the contrary, their corresponding speed distributions are similar. The deviation of the direction of motion from mean wind is smaller for singlecells than for multicells. September and July exhibit the maximum and minimum average storm speeds as a direct implication of synoptic disturbances passage and convection, prevailing re-spectively. Finally, storms overcoming orographic barriers decelerate in general on the windward side and accelerate on the lee side of mountains.
1 Introduction
Hail constitutes a major threat for agriculture in Northern Greece during the warm season of the year, producing ex-tensive damage to crops. In order to minimize the damage and the corresponding payouts, the Greek National Hail Sup-pression Program (NHSP) was designed (Karacostas, 1984), running since 1984 almost continuously. Hail suppression operations are conducted with the aid of an S-band (10 cm) weather radar, located at Thessaloniki’s airport. This is equipped, since 1997, with a radar recording system based on TITAN software (Dixon and Wiener, 1993). A hailpad network is also installed in the region consisting of about 140 pads regularly spaced.
Correspondence to: D. V. Foris
(dforis@the.forthnet.gr)
2 Data and quality control
The Radar Data Acquisition System (RDAS) is a system of acquiring and processing radar data, which also controls radar antenna. A volumetric scan comprises 14 successive scans at different elevations spaced apart at an appropriate angle, taking into account the radar beamwidth of 2◦. Data
is then transferred to TITAN in digital form every 3.5 min (the time elapsing between two successive volume scans). Radar images recorded this way constitute the primary data for this study and were collected during summertime (April to September) of the period 1997–2001. Radar and hailpad data, combined together, lead to the identification of the par-ticular storm that produced hailfall on a specific site.
The experimental unit of this study is the thunderstorm ”cell” (more accurately “cluster of cells”), which represents the elementary structural unit of a storm. All cells that ex-hibit reflectivities greater than 30 dBZ above the −5◦C level were recorded. A total of 787 such cells were tracked and studied during the five operational seasons mentioned above. The cells were subsequently divided into four categories, ac-cording to whether they were seeded or not and whether they gave hail on ground or not. A quality control of the data was performed in order to undoubtedly distinguish seeded from unseeded storms, by filtering out bias inadvertently accepted, which might be introduced through several procedures, such as data contamination resulting from seeding agent diffusion, transport of seeding material to the downwind side of the storm or to other cells not been directly treated, seeding ma-terial persistence due to a preceding seeding procedure, etc. The present study, based on the Lagrangian consideration, is focused on the 158 cells that produced hail on ground and which were not previously seeded, that is on those cells unaf-fected by external factors, aiming at the explanation of their behavior. The storms’ kinematic parameters examined are the distance traveled, the lifetime and their direction of mo-tion and speed. The distribumo-tion of these parameters is stud-ied in relation to the type of storms and the season (monthly distributions).
148 D. V. Foris et al.: Kinematic characteristics of hailstorms in Northern Greece
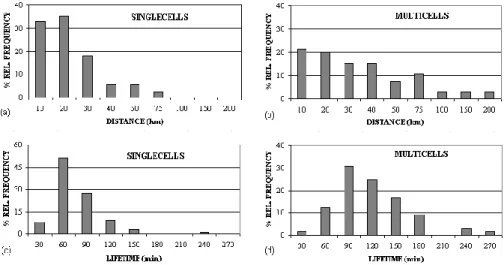
Fig. 1. Distance traveled by singlecells (a), multicells (b), and lifetime of singlecells (c), multicells (d).
3 Comparison of kinematic features of various storm types
Several storm classifications have been proposed so far. The classical scheme is followed here, in which three different storm types are identified: singlecell storms, multicell storms and supercell storms, with the addition of squall lines as a special case. The sample examined (158 cells) consisted of singlecells (56%), multicells (41%), supercells (2%) and squall lines (1%).
First the distance traveled by storms during their lifetime was examined. A 12% of the total storm cases were almost stationary, orographic storms. A storm is considered station-ary if successive volume scans show it almost at the same position and the total distance traveled during its lifetime does not exceed 5 km. It was found that singlecells, being air-mass thunderstorms, travel a distance of up to 30 km in a percentage of 85%, while multicells, which present a dis-crete propagation with new “daughter cells” developing in their right flank, travel a distance of up to 75 km in a per-centage of 91% (Fig. 1). This is explained by examining the distribution of the corresponding lifetimes: singlecells, in agreement with their conceptual model, exhibit a lifetime up to 1.5 h in a percentage of 86%, while multicells a life-time longer than one and shorter than three hours in a per-centage of 82% (Fig. 1). It has to be noted that lifetime is defined as the time elapsed between the first appearance and the disappearance of the 30 dBZ reflectivity above the −5◦C
level. These results are statistically significant at a signifi-cance level of α=0.05, using the non-parametric median test, giving a p-value of 5.35×10⁻³ and 2.97×10⁻⁸for the dis-tance and lifetime, respectively.
Next, the distribution of the average speeds (distance trav-eled divided by lifetime) was examined. Both singlecells and multicells exhibit similar distributions of both their average speeds and the ratio of their average speed to the correspond-ing mean wind (Fig. 2). This explains why short-lived sin-glecell storms travel a shorter distance than longer-lived
mul-ticell storms during their lifetime. These results are also sta-tistically significant at α=0.05. The mean wind was found to be a good approximation of cells’ steering wind (Weisman and Klemp, 1984). Mean wind is calculated by the sound-ing analysis program SHARP (Hart and Korotky, 1991) as a density-weighted mean wind in the lowest 6 km of the tro-posphere as an estimate of Cell Motion (CM). The sound-ing used is the 06:00 or 12:00 UTC for Thessaloniki, which can be considered quite representative for the area of study. When a cell initiates in the morning hours the 06:00 sounding is used; when it initiates in the afternoon or evening hours the 12:00 UTC sounding is used. Thus the actual environment is better represented. Earlier studies (Sioutas and Flocas, 1996) showed that this mean wind substantially underestimates cell speed, which is also evident from Fig. 2. Figure 3 shows the ratio of the average cell speed Vav to the mean wind speed
(CM) for two cases: when mean wind is light, then the av-erage cell speed is much greater than the mean wind; when mean wind is strong (CM>5 kt) the two speeds are compara-ble. The two cases behave differently and this result is statis-tically significant at α=0.05. The second case is the classical steering of cells by the mean wind, while for the first case storm motion (the vector sum of cell motion and propaga-tion vector) is considered more representative as the steering wind.
In the above analysis, cell speed is the actual speed of the cell, recorded by radar and its mean value over its lifetime is the average cell speed, while mean wind speed or cell motion (CM) is an estimate, calculated by means of the sounding, based on environmental data. Storm motion (SM) is also an estimate, based on cell motion and propagation.
The deviation of cells’ actual direction of motion (the di-rection cells move to) from the mean wind (CM) (also de-fined as the direction it blows to) was examined next. A mean direction is considered between the birthplace and the dissi-pation place of a cell, without taking into account small vari-ations due to complex terrain (blocking, channeling, etc.). From Fig. 4 it is apparent that about 66% of singlecells
Fig. 2. Average speed of singlecells (a), multicells (b), and ratio of average speed to mean wind (CM) for singlecell (c), multicell (d) storms.
Fig. 3. Ratio of the average speed of cells to the mean wind (CM), when CM<5 kt (a) and CM>5 kt (b).
presents a small deviation up to 15◦ to the right or left of
CM, which shows that CM can be considered a good ap-proximation of their direction of motion. As for multicells, the actual motion being essentially propagation, a deviation of 15 to 45◦to the right of CM was found in about 63% of the cases. This deviation, quite characteristic of multicells, expresses the propagation speed of the storm (storm motion, SM) and has been elsewhere found to be between 20◦in Al-berta storms (Browning and Ludlam, 1960) and 30◦in Cen-tral U.S. storms (more vertical directional wind shear). The greater the deviation, the higher the wind’s directional shear is present in the storm environment. Storm organization is the result of an interplay of several factors, such as vertical wind shear, storm inflow and storm-relative directional shear. Weak vertical shear supports limited convective organization, while increasing shear favors progressively better organiza-tion (Lazarus and Droegemeier, 1990).
4 Monthly variation of kinematic characteristics
The monthly distributions of distance traveled and storm life-time, divided into three classes (short, medium and long) as a percent relative frequency of occurrence appear in Ta-ble 1. It is observed that during May and July smaller dis-tances are traveled in longer times (e.g. in May <30 km 89%,
<60 min only 57%), while very long distances are traveled
Fig. 4. Deviation of the actual storm direction of motion from that
of the mean wind (CM) for singlecells (a) and multicells (b).
in relatively short times during September (>70 km 26%,
>120 min 22%).
Table 2 presents a mean speed and direction of motion for each month. In almost all cases a mean motion from NW to SE is revealed, with the exception of September, when a WSW to ENE motion is predominant. It has to be noted that the greatest average speed occurs during September. Seven synoptic circulation patterns are operationally iden-tified: closed low (CLOSED), cut-off low (CUT), longwave trough (LW), northwest flow (NW), southwest flow (SW), shortwave trough (SWT) and zonal flow (ZONAL) (Sioutas and Flocas, 2003). This scheme, though subjective, is con-venient for use on an operational basis, requiring routinely
150 D. V. Foris et al.: Kinematic characteristics of hailstorms in Northern Greece
Table 1. Monthly relative distribution of distance traveled 1S and lifetime 1T.
1S (km) APR (%) MAY (%) JUN (%) JUL (%) AUG (%) SEP (%)
<30 78 89 70 87 78 36
30–70 22 9 23 9 18 38
>70 0 2 7 4 4 26
1T (min) APR (%) MAY (%) JUN (%) JUL (%) AUG (%) SEP (%)
<60 78 57 52 60 52 40
60–120 11 36 37 32 38 38
>120 11 7 11 8 10 22
Table 2. Mean monthly speed and direction of motion.
APR MAY JUN JUL AUG SEP
Mean speed (km/h) 24.9 17.2 23.2 15.9 18.8 41.9
Mean direction (degrees) 152.4 150.7 119.6 167.4 156.3 86.2
used weather maps. The results of Table 2 are explained as a consequence of the relative frequency of circulation types for storm days per month and the average speed of storms for each type: CUT type with medium speeds is predominant during April, SW type with high speeds governs September, June is controlled by SW and NW types with high speeds, while LW with low and SWT with medium speeds dominate July. During May and August no prevailing type can be es-tablished.
5 Hailstorm speed and orography
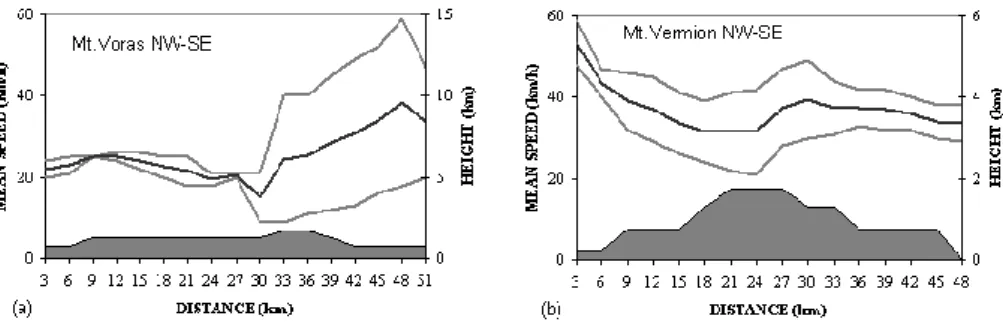
With the aid of “instantaneous” hailstorm speeds (every 3.5 min) graphs like those appearing in Fig. 5 were produced, presenting the variation of hailstorm speed (minimum, mean and maximum) as the storm crosses an underlying mountain. Such graphs were constructed for all mountains in the area of interest and for all crossing directions. The temporal scale was transformed into spatial with the aid of TITAN system and a GIS system. A substantial storm deceleration on the upwind side of mountains was observed, while a pronounced acceleration occurred on the lee side. This effect is more ev-ident in lower speeds.
Airflow over a barrier depends on the vertical wind profile, stability and the shape of the barrier. An important parame-ter in this context is Froude number (Fr), which can be inparame-ter- inter-preted as the ratio of kinetic energy of the air encountering a barrier to the potential energy necessary to surmount the barrier. When the flow is supercritical (Fr>1) it thickens as it passes over the windward side of the ridge, accumulating potential energy and losing kinetic energy, thinning on the lee side, where potential energy transforms into kinetic energy. In the subcritical case (Fr<1) the airflow thins and
acceler-ates over the barrier. In most of the examined cases the flow was supercritical. It seems that this distinction mostly de-pends on the flow direction with respect to the mountain than on the particular mountain.
The spatial and temporal distribution of storms’ birthplace and time of onset respectively revealed that favorable places for storm development are mountainous areas, preferably on their windward side when the wind is light and on their lee-ward side when the wind is strong. Channeling between mountain chains favors also storm development. Moreover, the majority of storms develops during the time of daily max-imum heating.
6 Discussion
The sample of 158 storms on which this study was based is undoubtedly small, so special care should be taken in the in-terpretation of the results. An indication that the results will not change significantly with a much larger sample comes from the examination of the total number of storms (787 cases), which reveals quite similar results. The detailed in-vestigation of the birthplace of all storms, as well as of the first detected cell (of reflectivity greater than 30 dBZ) of each storm day showed that in their vast majority storms initi-ate over mountainous areas. Thunderstorm initiation in the vicinity of mountainous terrain is caused (Banta, 1990) by three main effects: (1) orographic lifting, (2) obstacle ef-fects, such as mountain blocking, flow deflection, produc-tion of lee-side flow disturbances, and (3) thermal forcing, since mountains are considered elevated heat and moisture sources.
Fig. 5. Storm speed variation during the crossing of orographic barriers for the cases of two mountains: (a) Mt. Voras in a NW-SE direction
and (b) Mt. Vermion in a NW-SE direction. The motion on the graphs is from left to right. The shaded area represents the mountain barrier. The black line indicates mean storm speed, while grey lines indicate maximum and minimum speeds.
7 Conclusions
The present study, based exclusively on radar data, inves-tigated the hailstorm kinematic characteristics in northern Greece. The main findings are as follows:
1. Multicell storms, which are longer-lived, travel a dis-tance twice as long as the shorter-lived singlecells. On the contrary, their average speeds exhibit a similar dis-tribution.
2. When the mean wind in the layer 0–6 km is light (CM<5 kt), storms move faster than the environmental wind, their movement is better represented as propaga-tion. When the mean wind in the layer 0–6 km is strong (CM>5 kt), storms acquire speeds comparable with it, carried away by the environmental wind.
3. Singlecell storms present a small deviation (15◦)to ei-ther side of the mean wind, while multicell storms a greater deviation (15◦to 45◦)to the right of the mean wind. This result agrees both in direction and magni-tude with results found elsewhere (USA, Canada). 4. The maximum average storm speed occurs in
Septem-ber, while the minimum in July. A preferred average direction of motion from northwest to southeast is man-ifested during all months, but September. It seems that September’s behavior is due to the passage of synoptic-scale disturbances with a general west-to-east propaga-tion, while July’s storms are primarily a result of con-vection.
5. Storms overcoming underlying orographic barriers usu-ally decelerate on the windward side of mountains and accelerate as they approach lower terrain (over plains) to the lee side and the flow regime is characterized as supercritical.
Edited by: V. Kotroni and K. Lagouvardos Reviewed by: anonymous referee
References
Banta, R. M.: The role of mountain flows in making clouds, in: Atmospheric Processes over Complex Terrain, edited by: Blu-men, W., Meteor. Monogr., No. 45, Amer. Meteor. Soc., Boston, 229–284, 1990.
Browning, K. A. and Ludlam, F. H.: Radar Analysis of a Hailstorm. Tech. Note No. 5, Dept. Meteorol., Imperial College, London, 1960.
Dixon, M. and Wiener, G.: TITAN: Thunderstorm Identification, Tracking, Analysis and Nowcasting: A Radar-based Methodol-ogy, J. Atmos. Oceanic Technol., 10, 6, 785–797, 1993. Hart, J. A. and Korotky, W.: The SHARP Workstation v1.50 users’
guide, National Weather Service, NOAA, US Dept. of Com-merce, 30 p., 1991.
Karacostas, T. S.: The design of the Greek National Hail Suppres-sion Program, 9th Conf. on Wea. Mod., AMS, Park City, UT, 1984.
Lazarus, S. M. and Droegemeier, K. K.: The influence of helicity on the stability and morphology of numerically simulated storms, Preprints, 16th Conf. on Severe Local Storms, Kananaskis Park, Alberta, AMS, 269–274, 1990.
Sioutas, M. V. and Flocas, H. A.: Influence of environmental winds on propagation and motion of thunderstorms in Northern Greece, J. Geophys. Res., 101(D21), 26 255–26 265, 1996.
Sioutas, M. V. and Flocas, H. A.: Hailstorms in Northern Greece: synoptic patterns and thermodynamic environment, Theor. Appl. Climatol., 75, 189–202, 2003.
Weisman, M. L. and Klemp, J. B.: The structure and classification of numerically simulated convective storms in directionally vary-ing wind shears, Mon. Wea. Rev., 112, 2479–2498, 1984.