The effect of patent litigation and patent
assertion entities on entrepreneurial activity
The MIT Faculty has made this article openly available.
Please share
how this access benefits you. Your story matters.
Citation
Kiebzak, Stephen et al. “The Effect of Patent Litigation and Patent
Assertion Entities on Entrepreneurial Activity.” Research Policy 45, 1
(February 2016): 218–231 © 2015 Elsevier B.V.
As Published
http://dx.doi.org/10.1016/J.RESPOL.2015.07.002
Publisher
Elsevier BV
Version
Original manuscript
Citable link
http://hdl.handle.net/1721.1/120600
Terms of Use
Creative Commons Attribution-NonCommercial-NoDerivs License
The Effect of Patent Litigation and Patent Assertion Entities on
Entrepreneurial Activity
Stephen Kiebzak, Greg Rafert and Catherine E. Tucker∗ June 16, 2015
Abstract
This paper empirically investigates the statistical relationship between levels of patent lit-igation and venture capital (“VC”) investment in the U.S. We find that VC investment, a major funding source for entrepreneurial activity, initially increases with the number of lit-igated patents. However, there is a “tipping point” where further increases in the number of patents litigated are associated with decreased VC investment, which suggests an inverted U-shaped relation between patent litigation and VC investment. This appears strongest for technology patents, and negligible for products such as pharmaceuticals. Strikingly, we find evidence that litigation by frequent patent litigators, a proxy for litigation by patent assertion entities (”PAEs”), is directly associated with decreased VC investment, with no positive effects initially.
∗
Funding for this research was provided by the Computer and Communications Industry Association, whose members can be found at http://www.ccianet.org/about/members/. We thank Jim Bessen and Hal Varian for useful
1
Introduction
From 2004 through 2012, patent lawsuits in the U.S. more than doubled, from around 2,500 to over 5,000 annually1 and these lawsuits affected more than 12,600 defendants in 2012 (Pistorino, 2014). However, it is not clear what this increase in patent litigation means for the innovation economy. During this same time period, patent litigation brought by frequent litigators, who provide a proxy for patent litigation brought by patent assertion entities (“PAEs”), also increased from less than 500 patent lawsuits in 2004 to over 2,000 patent lawsuits in 2012. This rise in patent litigation brought by frequent litigators has been documented by others, such as Chien (2009) and Bessen et al. (2012), who both find large increases over the last decade.
This paper empirically investigates the statistical relationship between levels of patent litigation and venture capital (“VC”) investment in each industry in each district court. As described by Samila and Sorenson (2011), VC investment is positively correlated with firm starts, employment, and aggregate income in the region in which it occurs. Therefore, it is a comprehensive measure of both entrepreneurial activity and the positive benefits of entrepreneurial activity for the economy. Importantly, venture capitalists, on deciding whether to make investments in a startup, learn whether or not the startup is the target of patent litigation. This means that the decision of venture capitals to invest or not in a startup is a potentially useful barometer of how the entrepreneurship economy treats this increase in patent litigation.
We set out conceptually factors that might be expected to explain shifts in the level of patent litigation. These span baseline changes in patents granted, changes in the economic importance of protecting intellectual property, and factors relating to legal opportunism which are not related to changes in economic fundamentals. We use these factors to lay out a conceptual model which suggests that we would expect a positive relationship between VC and patent litigation initially, but that if there are excessive levels of patent litigation which may be related to opportunistic litigation, then at high levels of litigation there can be a negative relationship between VC funding and patent litigation.
We find statistical evidence that the relationship between VC investment and patent litigation
1
is indeed non-linear; our parameter estimates suggest that there is an inverted-U-shaped relation between the extent of patent litigation and entrepreneurial activity. At low levels of patent litiga-tion, an increase in patent litigation is associated with more VC investment, while at high levels of patent litigation, an increase in patent litigation is associated with decreased VC investment. This result is robust to multiple functional forms and to exclusions of potential outliers such as the East-ern District Court of Texas and the District Court of .2 It is also robust to using an instrumental variables approach where we exploit exogenous variation in patent litigation levels that stems from perceived court bias and expertise.
This finding, that low levels of patent litigation are associated with more entrepreneurial activity, while high levels of patent litigation are associated with lower levels of entrepreneurial activity, echoes an existing literature on intellectual property rights. Prior research has shown that at low levels of intellectual property rights protection, an increase in the level of protection encourages innovation because it provides incentives to research and to disclose information (Gallini, 2002). However, at high levels of intellectual property protection, stronger intellectual property rights may discourage subsequent research on valuable, but potentially infringing, inventions (Gallini, 2002; Bessen and Maskin, 2009; Qian, 2007; Lerner, 2009).
We extend our analysis to account for the fact that not all types of patent litigation have similar effects. We first show that patent litigation in the technology sector and the software sector exhibit this inverted-U-shaped relation with VC funding most strongly. Patent litigation in the pharmaceutical and industrial sectors does not exhibit this pattern. These are sectors where the fuzzy boundaries of patents have led to more opportunistic patent litigation (Bessen and Meurer, 2008a). We then distinguish between all patent litigation and only patent litigation brought by frequent litigators, the measure we use to proxy for the activity of PAEs. PAEs themselves do not make anything and obtain revenues simply from enforcing patents, meaning that there are asymmetries in the potential costs and risks of patent litigation. We find that unlike for regular patent litigation, litigation launched by frequent litigators has a universally negative effect on VC
2
The Eastern District Court of Texas is well known for its handling of large numbers of patent cases, regardless of whether or not the parties to the suit are based there. Based on our data, the District Court of Delaware also appears to handle a large volume of patent litigation.
funding with no initial positive relationship.
The remainder of the article is organized as follows: Section 2 discusses the underlying concep-tual model that motivates our statistical analysis. Section 3 describes the data that we use in our empirical analysis. Section 4 presents our empirical methodology. Section 5 presents the results of our analysis. Section 6 summarizes our estimated impacts on VC funding and other costs. Section 7 presents our conclusions and thoughts on the policy implications of our study.
2
Conceptual Model
This section describes why it is plausible to expect that there would be a relationship between observed patent litigation and VC funding of entrepreneurial activity.
2.1 What Drives Patent Litigation
The extent of patent litigation cannot and should not be treated as an exogenous factor which varies at random. Instead, the extent of patent litigation a particular region or sector experiences is an interplay of a complex series of intertwined economic and legal incentives. In this section, we lay out a simplified and stylized conceptual model of various factors that drive patent litigation and then relate these factors to venture capital funding.
The extent of patent litigation is a function of how likely patent holders are to take a potentially infringing party to court. We break this down into three factors. First, patent litigation might increase simply as a function of patents that are granted - in other words, there is a shift in the denominator or the number of patents which potentially could be litigated. Second, patent litigation may increase because there are higher rewards in that sector from protecting intellectual property rights - in other words, there is a shift in the payoff of litigation due to changing underlying economic fundamentals. Third, patent litigation may increase because of a shift in incentives inherent in the legal system which makes opportunistic prosecution of patents more attractive, even without any change in economic fundamentals.
2.2 What is the Conceptual Relationship between Patent Litigation and Ven-ture Capital Funding?
We now relate these three factors to their expected effect on VC funding at different levels of patent litigation.
2.2.1 Patent litigation that can be explained by changes in the baseline number of patents granted
Patent litigation is likely to be influenced by the number of patents granted because this increases the pool of potential patents to litigate. It seems likely that there would be a positive correlation between VC funding and the number of patents granted in a particular region in a particular sector. This is largely because the number of patents granted is likely to reflect underlying innovation in that sector, which in turn will affect the attractiveness of that sector for VCs deciding whether to invest. This is not a causal relation per se; instead, the relationship between venture capital, the number of patents granted, and the increase in patent litigation that results from this increase in patents granted reflects underlying market conditions proxying for innovation in that product sector. This statistical relationship seems likely to increase monotonically between the two variables.
2.2.2 Patent litigation that can be explained by changes in the underlying stakes of litigation
Patent litigation is likely to be influenced by the potential economic benefits of litigating a patent and protecting the underlying intellectual property in a particular sector in a particular region. As a sector becomes more profitable, firms potentially have a larger upside from aggressively protecting their intellectual property. This reflects previous work by Meurer (1989); Bessen and Meurer (2006) who stylize patent litigation as reflecting the ‘stakes’ in a particular industry at a particular time. In general, we would expect this to lead to a positive correlation between patent litigation and measures of a sector’s economic health or attractiveness, such as venture capital funding. This, again, is not a causal relation per se; instead, patent litigation and venture capital funding both reflect underlying market conditions for that product in that district. Again, it is also a statistical
relationship that seems likely to increase monotonically between the two variables.
A stronger version of this argument is that venture capitalists may view higher levels of patent litigation in that region or product sector as evidence of a well-functioning patent system that will protect their investment when the economic stakes in that sector are higher.3 This would imply a causal relationship between patent litigation and venture capital that reflects the importance of a well functioning patent system.
However, it is not clear that such a positive relationship will extend uniformly across all levels of patent litigation. Instead, it seems more likely to apply in initial early shifts upwards in patent litigation which would be ‘proof’ that the courts were an active forum for upholding entrepreneur’s intellectual property rights, but that the strength of proof that the court system is available to protect would not increase monotonically with an increase in litigation from these initial early levels. If this stronger version of the relationship between the economic stakes in a sector and patent litigation holds, it would favor a positive initial relationship between patent litigation and VC funding until the point is reached where the level of patent litigation is sufficient to ‘prove’ the ability of the courts in protecting that sector, and then there would be smaller, if any, incremental effects as patent litigation extends beyond that level.
2.2.3 Patent litigation that can be explained by opportunistic patent litigation unre-lated to underlying economic conditions
Patent litigation could also increase because of incentives not directly related to underlying eco-nomic conditions. Instead, patent litigation may increase only because of a shift in incentives inherent in the legal system which make opportunistic prosecution of patents more attractive ab-sent any change in economic fundamentals.
Previous academic work has emphasized that one source of such opportunistic behavior may be a change in the fuzziness of the boundaries of patents (Bessen and Meurer, 2008a; Miller,
3As discussed by Lemus and Temnyalov (2013), there is also the possibility that some startups will have greater
incentives to invest in R&D to try to preempt patent litigation, which may in turn attract R&D funding. This possibility reflects a stronger interpretation of a positive relationship between patent litigation and innovation, which is that an increase in patent litigation reflects a better-functioning patent system which offers better protection to inventors and those involved with research and development, which in turn leads to greater entrepreneurial activity. However, this paper does not have the data to provide direct empirical evidence of such a relationship.
2014) that are being enforced. This literature emphasizes that such fuzziness may lead to more inadvertent infringement and more legal uncertainty about the outcome of patent litigation. The latter consequence is important because of the legal literature on ‘holdup’ in patents. Lemley and Shapiro (2007) point out how legal uncertainty makes it more likely that there may be ‘holdup’, where the alleged infringer has made specific investments in the disputed technology and where it would be costly to abandon those investments. Even if a patent is weak, a plaintiff firm may have to incur specific costs in the technology and have to wait for a decision from the court to settle the validity of the patent. Briefly, the idea is that the patent holder may be able to charge a royalty in excess of what would be set if there had been bargaining ex ante because of these technology investments which would be costly to abandon. The prospect of this kind of excessive royalty, enforced through litigation, may be exactly what deters VC investment, as it reduces the chance of the startup making attractive profits. Furthermore, such patent litigation may halt the kind of innovative research and development that attracts VC investment (Smeets, 2014). As documented by Tucker (2012) in a case study of the medical imaging industry, firms can halt product R&D during patent litigation if they risk being found guilty of willful infringement and consequently being liable for treble damages.
Venture capital firms will be well aware of such litigation risk. When a startup applies for VC funding, they have to list all ongoing litigation. Some investors may prefer not to lend money to a startup if they perceive a litigation risk or the potential for endless demands for license fees for their particular product or service, limiting the stream of potential future revenues. Further, there is evidence that ongoing litigation risk can lower the potential value of a firm’s initial public offering (Lowry and Shu, 2002; Hanley and Hoberg, 2012), again deterring VC funding. This is supported by a survey by Feldman (2013) of 200 venture capitalists who found that 100% of respondents indicated that an existing patent demand against a potential portfolio company could be a major investment deterrent, as well as being deterred by more obvious direct litigation costs (Bessen and Meurer, 2008b).
Such opportunistic litigation is unlikely to be present at lower levels of patent litigation. It is at levels of patent litigation in excess of what might be expected from a linear extrapolation that such
negative effects may be expected. To capture this possibility, we use a quadratic specification in our regressions which specifically allows for a generally positive linear relationship but also means that areas or sectors with unusually high levels of patent litigation may experience a negative effect from this unusually high level of patent activity.
2.3 Asymmetric Effects by Sector
Though we cannot test ‘excessive’ litigation due to holdup and fuzzy patent boundaries directly, we do investigate this possibility in our empirical work by exploring which sectors are most affected by negative effects from patent litigation at higher levels of patent litigation. In particular, we contrast the technology sector, where patent boundaries tend to be fuzzier, making inadvertent infringement more likely (Bessen and Meurer, 2008a; Miller, 2014), with the pharmaceuticals and chemicals sector, where patents are more clearly defined.4
2.4 Asymmetric Effects from Frequent Patent Litigators
The negative effects associated with holdup may be more pronounced if the plaintiff faces asym-metric litigation costs relative to the defendant. PAEs themselves do not make anything and obtain revenues simply from enforcing patents, meaning that there are asymmetries in the potential costs and risks of patent litigation. PAEs, as compared to practicing entities, have few reputational costs, few discovery costs, are not vulnerable to countersuit, and do not risk their business model if one of their patents is found invalid (Yeh, 2013; Brill, 2014).
Research such as Turner (2011); Bessen et al. (2012); Bessen and Meurer (2014) has identified PAE litigation as having potentially negative effects. In particular, Chien (2014) provides evidence that entrepreneurial activity is negatively affected by PAEs; she finds that at least 55% of unique defendants in PAE suits make $10M per year or less. It is precisely these small and entrepreneurial firms that are the focus of this study. She also finds evidence that 40% of small companies that received a demand reported a “significant operational impact”: for example, the company delayed hiring or achievement of another milestone, changed their product, pivoted their business strategy,
4
shut down a business line, or reported a loss in potential perceived value among investors. There is also evidence that PAE litigation is opportunistic and not necessarily reflective of the actual technology the patent covers (Cohen et al., 2014). This means that as well as the increase in the potential for negative consequences due to demands for ‘excessive royalties’, there is less potential for a positive correlation between patent litigation and VC funding that would merely reflect the underlying attractiveness of an economic sector.
Given that there is little positive upside, from a venture capitalist’s perspective, from litigation brought by a PAE, it may be the case that litigation launched by frequent litigators has a universally negative effect on VC funding with no initial positive relation, as one might expect for regular patent litigation.
There is also the potential for asymmetric effects of patent litigation on the innovation process depending on whether the innovator is the target or the instigator of patent litigation. Simply looking at who the plaintiff and defendant are is often not that revealing because of the prevalence of counter-suits in patent litigation. We note, however, that our frequent patent litigator measure is likely to predominantly capture litigation where the startup was the defendant rather than the plaintiff.
Litigation involving a frequent litigator is less likely to have been instigated by the startup simply because by definition their short lifespan means they are less likely to have had the opportunity to launch multiple lawsuits. It seems likely there will be asymmetric effects on venture capital funding depending on whether the startup is the plaintiff or not. From the litigants’ perspective, litigation is a choice rather than a chance event. Accordingly, the entrepreneur will not litigate unless the expected benefits outweigh the expected costs. Moreover, entrepreneurs will likely take into account how launching litigation will affect their chances of attracting VC funding into this calculus. For defendants, however, litigation is not a choice, meaning that litigation may have negative effects. Indeed, given the absence of fee-shifting in the U.S., litigation costs can become very high (AIPLA, 2013) and the benefit confined to proceeding with using the same technology as had been previously planned.5 This suggests that the proposed negative relationship between litigation and
5
VC investment is more likely to occur if the litigation is not instigated by the entrepreneur. By studying litigation involving a frequent litigator, we also focus on litigation which is less likely to been instigated by the startup trying to attract VC funding.
3
Data
3.1 Patent Litigation Data
We obtained data on patent litigation from CourtLink.6 This data tracks each intellectual property suit filed in each of the 94 U.S. Federal District Courts. (Note that as robustness checks on our results, we exclude both the Eastern District of Texas and the District Court of Delaware.) For each litigation observation, we retrieved the name of the court in which the case was filed,7 the filing date, the case description which includes the plaintiff’s name and the defendant’s name, the docket number, the patent number for each patent at issue in the case,8 and the USPTO’s U.S. patent class for each patent at issue in the case. We matched this patent class with 24 industry sectors using NAICS 2-digit codes. The data we obtained spanned 1995-2012. If a case is transferred to multiple districts, we allocate it to the initial district court in which the case was filed.
We convert the U.S. patent classes to NAICS industry classifications using a series of concor-dances. Specifically, we first use a concordance to translate the U.S. patent class to the International Patent Class (“IPC”).9 Individual U.S. patent classes are generally associated with multiple IPCs. In these instances, we apportion patents equally amongst potential IPCs.10 We then use a con-cordance to map each IPC into industrial classifications. Patent to industry mapping is not a straightforward exercise. We use the method developed by Lybbert and Zolas (2012) which assigns
6LexisNexis CourtLink, LexisNexis, available at
http://www.lexisnexis.com/en-us/products/ courtlink-for-corporate-or-professionals.page.
7We exclude data from the Court of Federal Claims and the District of Puerto Rico. 8
We run our analyses based on a sum of the number of patents litigated in each suit, rather than the number of unique suits. Suits often have several patents at issue, not all of which are in the same U.S. patent classes and will therefore be assigned to different industries. Results are consistent if we instead measure the number of patent suits, but doing this requires that suits be apportioned to various industries based on the classes of the patents at issue.
9
Office of Patent Classification, U.S. Patent and Trademark Office, available at http://www.uspto.gov/web/ patents/classification/.
10For example, if a patent is assigned to a U.S. patent class which is associated with four IPCs, 0.25 of a patent is
probability weights for translating individual IPCs into International Standard Industrial Classi-fications (“ISICs”). Results are consistent if we instead map each IPC represented in our data directly to the ISIC with the highest probability weight determined by Lybbert and Zolas (2012).11 Finally, we convert the ISIC to the NAICS industry classification.12
As our key explanatory variable, we use “Total instances of a patent being litigated.” Many patent litigation cases involve more than one patent (on average, each case involves 2.01 patents), and those different patents may have different industry origins. Our measure allows us to obtain counts of patents litigated at the industry level, as opposed to arbitrarily dividing cases between industries. Consequently, if two patents are asserted in one case, then in our measure, this case would count as two patents litigated. Our use of this measure, which is necessitated by our division of data into different industry sectors, means that our measure of patent litigation is somewhat higher in magnitude than other research which simply counts instances of patent litigation. Also, other studies have used the number of defendants sued. Prior to the enactment of the America Invents Act (“AIA”) in September of 2011, PAEs often filed suit against multiple defendants in a single suit. Absent a manual review of the filing documents for each patent suit from 1995 through 2012, our data do not allow us to identify the name of each defendant involved in a suit, or even the number of defendants involved in each suit. We note that the bulk of our litigation data are from prior to the enactment and subsequent implementation of the AIA. Further, our results, particularly with regard to the costs of PAE litigation estimated later, would likely be stronger if we were able to identify the number of defendants involved in each suit.
The growth of the number of instances in which a patent is litigated is immediately noticeable in our data; Figure 1 plots this growth from 1995-2012. Figure 1 also shows that the average number of patents involved in each lawsuit has increased over time as well. This growing complexity of the typical patent lawsuit provides external motivation for our measure. To check, though, that our decision to reflect the number of patents per lawsuit rather than simply the number of lawsuits did not drive our results, we also repeated our estimation at the court-level (and thus not at the
11
We have also used a non-weighted measure as a specification check with similar results.
12North American Industry Classification System, U.S. Census Bureau, available at http://www.census.gov/eos/
industry-level), and obtained qualitatively similar results.
Figure 1: Total Patent Litigation and Frequent Litigator Patent Litigation, 1995 to 2012
1 2 3 4
Average patents per suit
0 1000 2000 3000 4000 5000 6000 7000
Instances of a patent being litigated
1995 1997 1999 2001 2003 2005 2007 2009 2011
Litigated by non−frequent litigators Litigated by frequent litigators Average patents per suit
Source: “LexisNexis CourtLink,”, available at
http: // www. lexisnexis. com/ en-us/ products/ courtlink-for-corporate-or-professionals. page , downloaded on Apr. 8, 2013.
One caveat that is worth mentioning is that we only use data on actual observed patent liti-gation. As discussed by Seigle (2013) in his testimony to Congress on the subject of “The Impact of Patent Assertion Entities on Innovation and the Economy,” patent litigation may be only the tip of the iceberg when it comes to understanding the extent of legal proceedings and discussions that surround a firm’s patent portfolio. In particular, there may be many occasions where patent litigation is threatened through a demand letter and a company chooses to settle rather than face the risks and expense of litigation. Indeed, evidence provided by RPX (2012) suggests that in a sample of 900 litigations, for the majority of them, legal costs exceed the settlement. Seigle (2013) suggests that demand letters often contain vaguely worded threats like “Plaintiff is prepared for
full-scale litigation to enforce rights. This includes all motion practice as well as protracted dis-covery.” These threats discourage targeted firms from engaging in litigation due to fears about costs.13 Given this, the best way of interpreting our results is that we are using patent litigation that reaches courts as a proxy measure for underlying patent litigation activity. In the particular case CISCO Systems Inc. et al v. Innovatio IP Ventures LLC,14which involved a patent assertion entity, the court evidence suggests that there were 8,000 letters and only 26 cases that reached the court. Therefore, this paper should be read as only trying to estimate one part of the potential relationship between patent assertion activity and entrepreneurial funding.
3.2 Frequent Patent Litigators
The definition of a PAE is somewhat controversial (FTC, 2011). For example, many definitions make it hard to distinguish between a university and what is commonly understood to be a patent troll (Lemley, 2007). Furthermore, because PAEs often hide under multiple shell companies and names, and act instead as large-scale patent aggregators, it is often hard to identify them precisely by name (Hagiu and Yoffie, 2013).
Therefore, rather than trying to identify PAEs by name, we take an empirical approach to identifying something analogous to a PAE in our data, and look for companies that are “frequent litigators.” We define a frequent litigator as an entity that has filed twenty or more patent law-suits.15 This may be a somewhat conservative threshold - Chien (2012) suggests that 61% of all defendants were sued by a PAE that had sued eight or more times, compared to 16% that were sued by a PAE that had sued less than eight times. As discussed in Section 2.4, this also captures litigation where the startup was more likely to be the defendant rather than plaintiff.
We realize that this is an imperfect measure of what is commonly thought of as PAEs, as it could potentially cover firms that make products but who for whatever reason are litigious towards others infringing on their patents; our definition would also exclude PAEs that are somewhat selective about the litigation they pursue. However, we find it reassuring that using our measure of frequent
13http://democrats.energycommerce.house.gov/sites/default/files/documents/
Testimony-Seigle-OI-Patent-Assertion-Entities-Economy-2013-11-14.pdf.
14Illinois Northern District Court, Case No. 1:11-cv-09309. 15
litigators, the number of suits associated with these frequent litigators over time corresponds to the number of suits by PAEs measured by Patent Freedom, a non-profit that tracks the actions of PAEs.16
To investigate how directly our frequent litigation measure correlates with what has been identi-fied as a PAE in prior research, we matched the plaintiff name to a list of the major PAEs published by Patent Freedom. As discussed above, PAEs often deliberately conceal their name when pursuing litigation, so we recognize that we were only able to identify a subset of PAEs through this proce-dure. For example, we were able to identify 238 PAE cases in 2012 compared to Patent Freedom’s count of about 2,100. It is reassuring that our measure of frequent litigators generally picks up those entities that we are able to directly identify as PAEs using this methodology. The correlation between this measure of patent trolls and our frequent litigation measure was 0.41.
It is worth reiterating again that this simple split of our data does not reflect the highly nuanced debate about exactly what is and what is not a ‘patent troll.’ In recent work, Cotropia et al. (2014) pointed out that patent holders involved in lawsuits could be classified into 1) universities; 2) individual inventors; 3) large patent aggregators; 4) failed operating or start-up companies; 5) patent holding companies; 6) operating companies; 7) IP holding companies owned by an operating company; and 8) technology development companies. Our classification, by contrast, does not focus on the identity of the patent owner, but instead only on their frequency of litigation.
3.3 Data on Entrepreneurial Activity
Our principal measure of entrepreneurial activity is VC investment. As described by Samila and Sorenson (2011), VC investment is positively correlated with firm starts, employment, and aggregate income in the region in which it occurs. Therefore, it is a useful and comprehensive measure of both entrepreneurial activity and the positive benefits of entrepreneurial activity for the economy. Our VC data come from Thomson One, which is the most comprehensive data source for VC investment available in the U.S. and was also the source of data for Samila and Sorenson (2011). We collected data on the amount of VC investment obtained by each startup from 1995 through 2012. This data
included the name of the firm receiving the funding, the level of funding, the date the funding was received, the firm’s state and county, and the NAICS industry classification. We then aggregated the data to the district court and two-digit NAICS industry level for each year. When combined with the CourtLink litigation data, the resulting VC panel dataset contained 37,260 observations. One caveat with this approach is that we are assuming there is a relation between the district where the patent lawsuit was filed and the region where VC investment is received by entrepreneurial startups. However, there may be occasions where the patent litigation is launched in a different region from where the VC investment is received. One particular issue is that many patent lawsuits are launched in the Eastern District Court of Texas, regardless of the location of the parties being sued, due to a perception that this forum is favorable to the patent holder (Leychkis, 2006). We address this by running an additional robustness check where we exclude the Eastern District Court of Texas and find similar results. We also conservatively exclude the Eastern District Court of Texas from our estimates of economic effects of the impacts of both frequent patent litigation and non-frequent patent litigation.
T able 1: Summary statistics Mean S td Dev Min Max Observ ation s V en ture Capital(USD Mil) 13.4 139.8 0 9891.6 37260 Firms < 100 Empl. (00) 25.9 44.6 0 558.8 35190 Firms ≥ 100 Empl. (00) -25.6 44.2 -553.2 0.00060 35190 T otal instances of a P aten t b e in g litigated 2.36 14.3 0 740.2 37260 T otal instances of a P aten t b e in g litigated b y freq litigator (> 15) 0.83 8.15 0 576.9 37260 T otal instances of a P aten t b e in g litigated b y non-f re q litigator( < 15) 1.53 7.56 0 367.5 37260 T otal instances of a P aten t b e in g litigated b y freq litigator (> 20) 0.71 7.43 0 576.9 37260 T otal instances of a P aten t b e in g litigated b y non-fr e q litigator( < 20) 1.65 8.41 0 395.1 37260 T otal instances of a P aten t b e in g litigated b y freq litigator (> 25) 0.59 6.69 0 576.9 37260 T otal instances of a P aten t b e in g litigated b y non-fr e q litigator( < 25) 1.76 9.44 0 560.4 37260 T otal instances of a P aten t b ein g litigated (NPE) 0.081 1.58 0 118.0 37260 T otal instances of a P aten t b ein g litigated (Non-NPE, F req) 0.67 7.09 0 576.9 37260 Cases Mo v ed from Cour t 0.0011 0.011 0 0.28 37260 Cases Mo v ed to Court 0.0014 0.023 0 0.87 37260 Industry-District P a yroll 2112.0 3613.5 2.58 99309.2 31050 P aten ts Issued 0.38 1.43 0 68.8 37260 Note: Each observation is for a court-industry-ye ar
4
Methodology
We use a simple econometric panel framework to measure the statistical relation between patent litigation and two proxy measures for innovation. Specifically, we allow our dependent variable EntrepreneurialActivityit, in region i in industry sector j at time t, to be a function of:
EntrepreneurialActivityijt= β1P atentLitigationijt+ β2P atentLitigation2ijt+ γi+ ωj+ δt (1)
In this specification, β1 and β2 capture our main effect of interest, that is, the relation between
the level of patent litigation in that region for that industry in that time period and entrepreneurial activity. β1 captures the linear relation between the two. β2 allows the relation to be non-linear,
and in particular, could potentially capture any negative effects from patent litigation that can be explained by excess litigation that occurs because of opportunistic legal behavior rather than eco-nomic fundamentals above a certain threshold. δtis a set of fixed effects for each time period which
capture differences in the economy-wide time trend of entrepreneurial activity, ωj is a series of fixed
effects for each industry sector which capture different baseline levels of entrepreneurial activity for that industry, and γi is a series of fixed effects which capture different levels of entrepreneurial
activity in different regions.
This specification means that identification comes through changes in the level of patent liti-gation in a particular region or product category that do not follow the national trend. If such changes come from exogenous factors, such as changes in district court policies, changes in person-nel, or changes in the perceptions among litigators about the likely success of their cases, then we can think of β1 and β2 as capturing a causal relation between patent litigation and entrepreneurial
activity. We recognize there is the potential for there to be some degree of endogeneity or even reverse causality, which is why we provide multiple robustness checks and specifications.
We also want to determine the effect of the type of plaintiff on innovation. If litigation brought by one of our proxy definitions for a PAE had an incremental effect on innovation beyond that observed for the overall level of litigation, we can study this by accounting for plaintiff type in Equation 1. We therefore estimate separate regressions splitting the patent counts into those not
litigated by a PAE and those litigated by a PAE in our later analysis. We estimate separate regressions using counts based on each of our proxy variables for the number of lawsuits that could be attributed to a PAE.
EntrepreneurialActivityijt= β1N onP AELitigationijt+ β2N onP AELitigation2ijt (2)
+β3P AELitigationijt+ β4P AELitigation2ijt+ γi+ ωj + δt
5
Results
5.1 Effect of Patent Litigation on Entrepreneurial Activity
Following the specification described by equation (1), we regress the amount of VC investment in each NAICS two-digit industry code in each federal court district in each year from 1995 to 2012 on the number of patents litigated, the number of patents litigated squared, and fixed effects for year, industry, and district court.
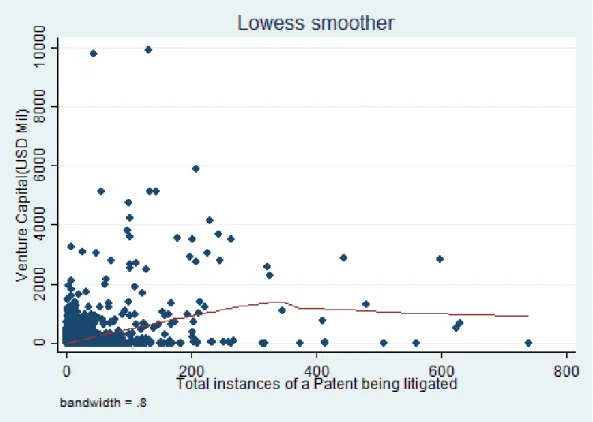
Table 2 provides results for our initial specification. Column (1) shows the results for the simple linear relationship between patent litigation and venture capital investment. Column (2) simply examines the effects for regions and sectors with above average patent litigation. This non-parametric specification suggests, unlike Column (1), that at higher levels of patent litigation there may be negative effects. To capture this more fully, Column (3) adds a square term. In Columns (4) through (6), we incrementally add fixed effects to build up to the final specification provided in equation (1). Column (7) presents results from a more saturated specification which allows for fixed effects at the court-product pair level. Across all columns, we see a similar pattern for the effect of patent litigation on VC investment. Specifically, the positive term on the linear term for patent litigation suggests that VC investment initially increases as patent litigation increases. However, the negative term for the square of patent litigation suggests that this increasing relation is not permanent, but instead is subject to diminishing and eventually negative returns. This is reflected in a plot of the raw data shown in Figure 2. (It is important to note that a relatively small number
T able 2: The relation b et w een V C in v estmen t and paten t litigation (1) (2) (3) (4) (5) (6) (7) T otal instances of a P aten t b eing litigated 3.743 ∗∗∗ 6.648 ∗∗∗ 6.753 ∗∗∗ 6.399 ∗∗∗ 6.341 ∗∗∗ 1.003 ∗ (0.573) (0.781) (0.789) (0.754) (0.800) (0.536) Ab o v e a v erage paten t litigation that y e ar -2.665 ∗∗∗ (1.023) T otal instances 2 of a P aten t b eing litigated -0.00864 ∗∗∗ -0.00880 ∗∗∗ -0.00835 ∗∗∗ -0.00831 ∗∗∗ -0.00192 ∗∗ (0.00154) (0.00155) (0.00146) (0.00153) (0.000842) Y ear Fixed Effects No Y es No Y es Y es Y es Y es District Court Fixed Effects No Y es No No Y es Y es No Industry Sector F ixed Effects No Y es No No No Y es No Court-Industry Fixed Effects No No No No No No Y es Observ ations 37260 37260 37260 37260 37260 37260 37260 R-Squared 0.146 0.150 0.186 0.192 0.251 0.270 0.705 Ordinary Least S quares Estimates. The dep enden t v ariable is total V C in v estmen t ($M) in a region-industry-y ear. The dat a spans 1995-2012. Robust standard errors rep orted in paren theses b elo w . * p < 0 .10, ** p < 0 .05, *** p < 0 .01
of observations appear to be driving the relation shown in Figure 2.)
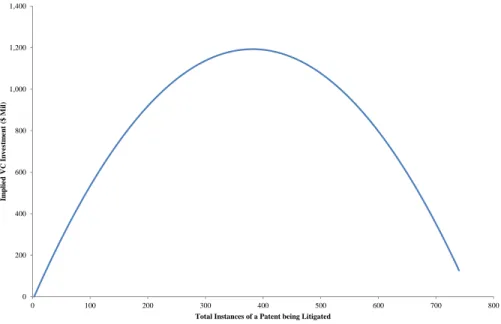
Figure 3 plots out graphically the implications of the parameter estimates in Table 2 for the range of values found in our data. This illustrates clearly the inverted U-shaped nature of the relationship.
Figure 2: Raw Data: Inverted U-shaped relation between patent litigation and VC funding
Figure uses raw data and reports results of Lowess smoothing and locally weighted regression of patents on VC funding
Figure 3: Plot using Parameter Estimates from Table 2 0 200 400 600 800 1,000 1,200 1,400 0 100 200 300 400 500 600 700 800 Im pli ed VC Inv estm ent ( $ M il)
Total Instances of a Patent being Litigated
Note: Implied VC investment is calculated by first identifying the smallest and largest number of patents involved in litigation in a district court - industry pair from 1995 through 2012. Implied VC investment is calculated for each number of instances of patents being litigated in this range by using the results of a regression of VC investment on total instances of a patent being litigated and total instances of a patent being litigated squared, with fixed effects for the industry, district court,
5.2 Robustness Checks
Since the results of Table 2 suggest an important and newly identified relation between VC in-vestment and excess levels of patent litigation, we investigated the extent to which the statistical relationship was causal or reflected an omitted variable. The first set of concerns is that our results could simply be omitting some time-varying variable at the product-district court level. An obvious possibility given the discussion in section 2 is that litigation naturally reflects the number of patents granted, and that as a consequence we are measuring something about the relationship between the granting of patents rather than patent litigation per se.17 To investigate this, we collected data on the number of patents granted in each district-industry pair. We collected this data using automated scripts from the Google Patent database.18
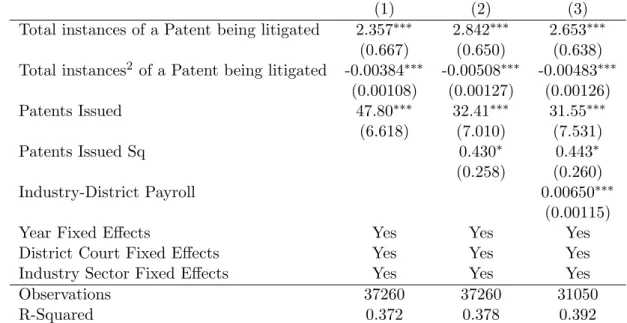
We introduced this measure of patent granting activity in Column (1) of Table 3. Our results are robust to the inclusion of this control, which suggests that we are measuring something specific to patent litigation rather than patenting activity itself. Of interest is that venture capital is positively correlated with patent grants which may reflect the economic attractiveness of a particular industry-area pairing to both innovators and venture capitalists simultaneously. This matches the conceptual model we outlined in Section 2. In Column (2) of Table 3, we introduce a non-linear squared term for patents granted. Interestingly, we measure a marginally significant convex relationship between patents granted and the amount of venture capital funding. This suggests that the concave relationship we observe for litigation is unique to litigation rather than the underlying granting of patents.
Another concern could be that, in district-product pairs, an increase in litigation could also be a consequence of a downturn in the local economy which suppressed VC investment. To investigate this, we collected additional data on the average payroll for firms in that district in that product
17
It is also possible that the concavity we observe between patent litigation and VC funding could then simply reflect the fact that venture capitalists are deterred if they see too many patents in a particular sector, as they are concerned that it reflects excess entry and is predictive of lower profits.
18
Data regarding the number of patent grants in each court district and industry were obtained from the USPTO’s joint project with Google, which provides weekly files containing the full text of each patent granted each week, avail-able at http://www.google.com/googlebooks/uspto-patents-grants-text.html. A Python script was developed to parse each granted patent’s USPTO patent classification and first named inventor’s city and state of residence. The first named inventor’s city and state of residence were used to map each patent grant to a U.S. court district. As described earlier, a series of concordances was used to translate USPTO patent classifications to two-digit NAICS.
sector using the Census County Business Patterns data.19 Column (3) reports a specification which adds this control. Our results remain similar in that there is a positive relationship between VC funding and payroll, which, again, may reflect the underlying economic attractiveness of a specific area-product pairing. Again our main result is robust.
Table 3: The relation between VC investment and patent litigation: Further controls
(1) (2) (3)
Total instances of a Patent being litigated 2.357∗∗∗ 2.842∗∗∗ 2.653∗∗∗ (0.667) (0.650) (0.638) Total instances2 of a Patent being litigated -0.00384∗∗∗ -0.00508∗∗∗ -0.00483∗∗∗
(0.00108) (0.00127) (0.00126) Patents Issued 47.80∗∗∗ 32.41∗∗∗ 31.55∗∗∗ (6.618) (7.010) (7.531) Patents Issued Sq 0.430∗ 0.443∗ (0.258) (0.260) Industry-District Payroll 0.00650∗∗∗ (0.00115)
Year Fixed Effects Yes Yes Yes
District Court Fixed Effects Yes Yes Yes Industry Sector Fixed Effects Yes Yes Yes
Observations 37260 37260 31050
R-Squared 0.372 0.378 0.392
Ordinary Least Squares Estimates. The dependent variable is total VC investment ($M) in a region-industry-year. The data spans 1995-2012. Robust standard errors reported in parentheses
below. * p < 0.10, ** p < 0.05, *** p < 0.01
There are fewer observations in columns (3) and (4) because the census did not give consistent estimates on payroll for four of the industry classifications.
The controls in Table 3 check that there is not an alternative story reflecting omitted variables which is driving our results.
However, given our focus on a non-linear model and a quadratic equation another natural concern is that our results are driven by a few outliers. This is particularly a concern because there may be collinearity between the linear and square term - the pairwise correlation is 0.8104.
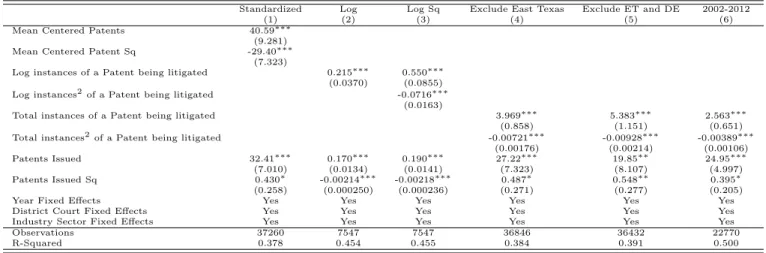
We present some reassuring evidence about this possibility in Table 4. Column (1) reports a specification where we zero-mean and standardize the patent and patent square term. This stan-dardization process should help mitigate the potential of outliers driving our results by imposing
a normal distribution on their spread. The way it should be interpreted is that each variable mea-sures the effect of an increase of one standard deviation away from the mean. Column (2) presents a specification where we use a log-log specification for the dependent and explanatory variable and show that this relationship is positive and significant, and suggests an inelastic relationship between the two on average, assuming, as implied by the log-log model, that there is a constant elasticity. This is reassuring evidence that the statistical significance we find is not driven by a few observations, though of course this specification does not directly address the question of whether there is the potential for a concave relationship between the two variables. To address this, Col-umn (3) includes a logged square term for instances of patent litigation which again has a negative coefficient, which is again reassuring evidence that it is not a few outliers driving our results. One consequence of this log-log specification we use in both Column (2) and (3) is that as the log of zero does not exist, we drop all the observations where we observe zero for the dependent variable.
Table 4: Checks for whether outliers drive the results in Table 2
Standardized Log Log Sq Exclude East Texas Exclude ET and DE 2002-2012
(1) (2) (3) (4) (5) (6)
Mean Centered Patents 40.59∗∗∗ (9.281) Mean Centered Patent Sq -29.40∗∗∗
(7.323)
Log instances of a Patent being litigated 0.215∗∗∗ 0.550∗∗∗ (0.0370) (0.0855) Log instances2of a Patent being litigated -0.0716∗∗∗
(0.0163)
Total instances of a Patent being litigated 3.969∗∗∗ 5.383∗∗∗ 2.563∗∗∗ (0.858) (1.151) (0.651) Total instances2of a Patent being litigated -0.00721∗∗∗ -0.00928∗∗∗ -0.00389∗∗∗
(0.00176) (0.00214) (0.00106) Patents Issued 32.41∗∗∗ 0.170∗∗∗ 0.190∗∗∗ 27.22∗∗∗ 19.85∗∗ 24.95∗∗∗ (7.010) (0.0134) (0.0141) (7.323) (8.107) (4.997) Patents Issued Sq 0.430∗ -0.00214∗∗∗ -0.00218∗∗∗ 0.487∗ 0.548∗∗ 0.395∗ (0.258) (0.000250) (0.000236) (0.271) (0.277) (0.205)
Year Fixed Effects Yes Yes Yes Yes Yes Yes
District Court Fixed Effects Yes Yes Yes Yes Yes Yes
Industry Sector Fixed Effects Yes Yes Yes Yes Yes Yes
Observations 37260 7547 7547 36846 36432 22770
R-Squared 0.378 0.454 0.455 0.384 0.391 0.500
Ordinary Least Squares Estimates. The dependent variable is VC investment ($M) in a region-industry-year from 1995-2012. Robust standard errors reported in parentheses. * p < 0.10, ** p < 0.05, *** p < 0.01
Another concern is that our results could be driven by specific outliers in our data. One obvious potential outlier is the Eastern District Court of Texas, which hears many patent litigation suits. An obvious concern is that our estimates could be driven by the relatively low level of VC investment in this particular region which is not known as an entrepreneurial hub. Column (4) reports the results of a specification that excludes the Eastern Court of Texas, and shows that our results are similar when this district is excluded, and Column (5) presents results from a specification that
excludes both the Eastern District Court of Texas and the District Court of Delaware. We add the District Court of Delaware to this specification as it is unusual in that because of its frequency of use as a state where companies register it hears a disproportionate number of cases, but this does not reflect the level of VC activity in that district.
Column (6) of Table 4 reports the results of a specification where we only use data from 2002-2012. This limited time window addresses the concern that our estimates could be driven by the long time span of our data and the fact that the environment surrounding VC investment may have changed substantially over 17 years; once again, our results are similar. This robustness check also ensures that our estimates are not driven by the ‘tech bubble’ of 1999-2000.
5.3 By Sector
We then re-estimated our model looking at different sectors. This is important because, as discussed by Bessen and Meurer (2006), the nature of the sector and the fuzziness of the patent boundaries and consequent interpretability within that sector may affect the level of patent litigation. As documented by the GAO (2013), cases involving software patents accounted for 89 percent of the increase in defendants over the 2000-2010 period, again suggesting that the changes in patent litigation are not uniform across sectors. Specifically, we distinguished in our data between sectors such as health, chemicals and manufacturing,20 the technology sector,21 the software sector22, and the financial sector, which has seen the most extensive patent reform.
Table 5 reports our results. Column (1) suggests that in industries where patents traditionally apply to a single molecule, as is the case in pharmaceuticals or chemical processes, there is less effect on VC investment, perhaps reflecting the lower degree of ambiguity that surrounds patents in such industries. This accords with survey evidence presented by Chien (2013) that suggests that in the “Bio and Pharma” space, venture capitalists have seen far fewer PAE demand letters. Column (2) suggests a large but imprecisely measured effect (since the point estimates are not significant)
20Specifically NAICS codes 62, 11, 21 and 22 (“Health”, “Agriculture, Forestry, Fishing and Hunting”, “Mining,
Quarrying, and Oil and Gas Extraction.”
21Specifically, NAICS codes 51,54,55 -“Information” + “Professional, Scientific, and Technical Services”
“Manage-ment of Companies and Enterprises”
22Specifically, following Chien (2008, p. 1595), we identify litigated software patents as those in U.S. Patent Classes
of patent litigation on the financial services industry. As emphasized by Lerner (2006), this is an industry which has had a large shift in potentially damaging patent litigation in this period, however, since litigation tends to be concentrated in a few geographical regions, we do not have enough cross-sectional variation to precisely measure the effect for a single sector.23
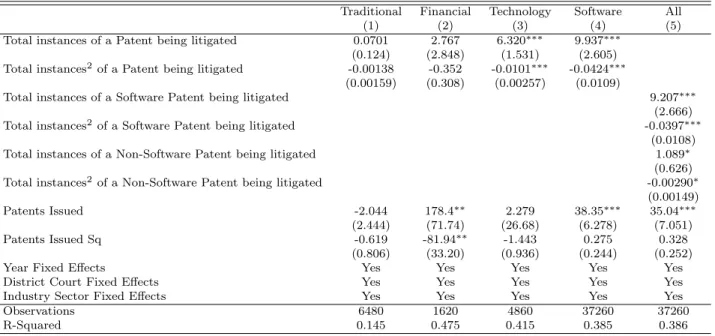
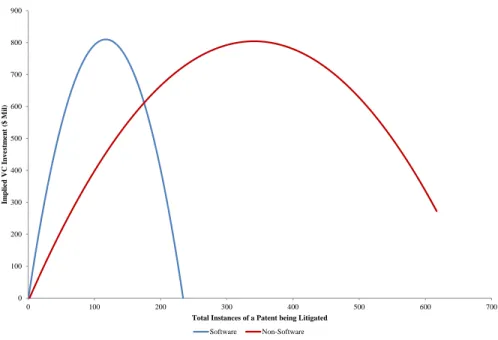
In Column (3), we display the results for the technology sector, and Column (4) displays the results for software patents alone. The most pronounced effects are in this sector. Column (5) compares software patents litigated to instances of all other types of patents litigated. These results imply that the tipping point of instances of software patents litigated, beyond which VC investment begins to decrease with additional litigation, occurs at a significantly lower level of instances of litigation than does the tipping point of instances of all other types of patents litigated. Figure 4 plots out the implied shape of the statistical relationship between patents litigated and venture capital for software patents and non-software patents.
One potential explanation of this pattern of results is that some of the patent litigation we study may reflect inadvertent infringement rather than infringement that could have been solved by efficient ex ante licensing (Lemley and Shapiro, 2007).24 As computer and software-related
patents may have fuzzier boundaries, this makes inadvertent infringement more likely (Bessen and Meurer, 2008a). As a consequence, patent ‘holdup’ in these sectors is more likely to lead to costly outcomes for the defendant.
As the time span of our data finishes in 2012, and as we focus on the product sector that the patent is initially tied to rather than the industry of the defendant in the case, we are not able to evaluate claims of harm to ‘Main Street’ businesses and service providers, a topic which has recently been featured in policy discussions. These cases span a variety of industries, though often featuring a piece of reasonably ubiquitous technology. For example, White Castle, a fast food chain, was targeted by a lawsuit over its use of Quick Response (QR) codes.25 Similarly, businesses such as
Panera Bread, Caribou Coffee, Marriott Hotels, and Dunkin’ Donuts were recently targeted by a
23
Another complication is that the Transitional Program for “Covered Business Method Patents” applies from 2012, but our data do not cover the post-implementation period.
24
We thank an anonymous reviewer for this insight
lawsuit over free provision of WiFi on their premises.26
Table 5: Investigating variation by sector
Traditional Financial Technology Software All
(1) (2) (3) (4) (5)
Total instances of a Patent being litigated 0.0701 2.767 6.320∗∗∗ 9.937∗∗∗ (0.124) (2.848) (1.531) (2.605) Total instances2of a Patent being litigated -0.00138 -0.352 -0.0101∗∗∗ -0.0424∗∗∗
(0.00159) (0.308) (0.00257) (0.0109)
Total instances of a Software Patent being litigated 9.207∗∗∗ (2.666) Total instances2of a Software Patent being litigated -0.0397∗∗∗
(0.0108) Total instances of a Non-Software Patent being litigated 1.089∗
(0.626) Total instances2of a Non-Software Patent being litigated -0.00290∗
(0.00149) Patents Issued -2.044 178.4∗∗ 2.279 38.35∗∗∗ 35.04∗∗∗
(2.444) (71.74) (26.68) (6.278) (7.051)
Patents Issued Sq -0.619 -81.94∗∗ -1.443 0.275 0.328
(0.806) (33.20) (0.936) (0.244) (0.252)
Year Fixed Effects Yes Yes Yes Yes Yes
District Court Fixed Effects Yes Yes Yes Yes Yes
Industry Sector Fixed Effects Yes Yes Yes Yes Yes
Observations 6480 1620 4860 37260 37260
R-Squared 0.145 0.475 0.415 0.385 0.386
Ordinary Least Squares Estimates. The dependent variable is VC investment ($ Mil) in a region-industry-year from 1995-2012. Robust standard errors reported in parentheses. * p < 0.10, ** p < 0.05, *** p < 0.01
Figure 4: Plot using Parameter Estimates from Table 5 0 100 200 300 400 500 600 700 800 900 0 100 200 300 400 500 600 700 Im pli ed VC Inv estm ent ( $ M il)
Total Instances of a Patent being Litigated
Software Non-Software
Note: Implied VC investment is calculated by first identifying the smallest and largest number of patents involved in litigation in a district court - industry pair from 1995 through 2012. Implied VC investment is calculated for each number of instances of patents being litigated in this range by
using the results presented in Table 5, Column (5). When predicting implied VC investment for software patent litigation, the total instances of Non-Software patents being litigated is held
5.4 Effect of Frequent Patent Litigator Litigation
Next, we investigate whether the effects of patent litigation on our measures of entrepreneurial activity vary by whether or not the litigation involved an entity which was a frequent patent litigator, our proxy measure for a PAE.
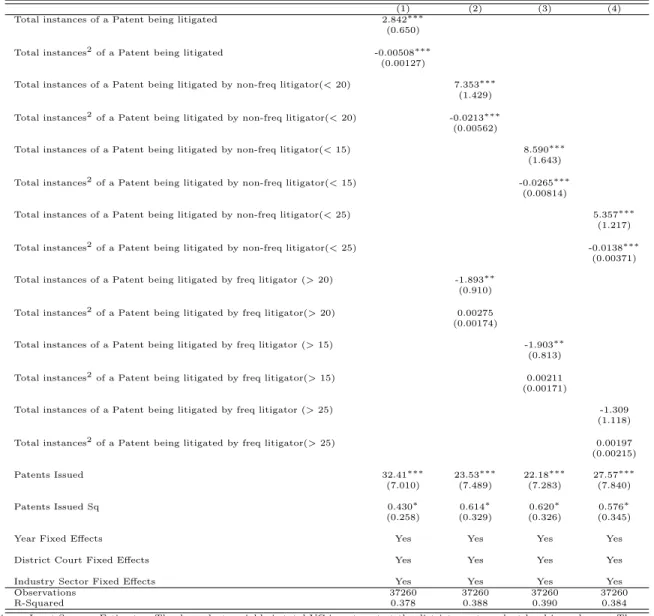
Table 6 presents results of a specification where we distinguish the effect of patent litigation that involved a frequent litigator and litigation that did not on VC investment. Column (1) repeats our earlier estimation from Table 2 Column(6) to provide a baseline for comparison. Column (2) splits this up between litigation that involves a frequent litigator plaintiff and litigation that does not. It is evident that there is a direct negative effect on VC investment from patent litigation that involved one of these frequent litigators. This contrasts with litigation that involves a non-frequent litigator, which exhibits an inverted U-shaped pattern. The coefficient on “Total instances of a patent being litigated by frequent litigator” implies that, for each patent litigated by frequent litigators in a district, holding other factors constant, VC investment in the district will decrease by $2.7 million. Columns (3) and (4) investigate the robustness of our results to different thresholds for identifying frequent litigators. In both cases our results are similar in size and in direction, though the estimates in Column (4) are no longer statistically significant - the p-value for the negative linear term is now 0.13. One explanation for this lack of precision at higher thresholds is that 76% of observations of patent litigation by frequent litigators are now zero, meaning that there is less variation to identify the estimates precisely.
Table 6: Distinguishing between the effect of frequent and non-frequent litigators on VC Funding
(1) (2) (3) (4)
Total instances of a Patent being litigated 2.842∗∗∗ (0.650) Total instances2of a Patent being litigated -0.00508∗∗∗
(0.00127)
Total instances of a Patent being litigated by non-freq litigator(< 20) 7.353∗∗∗ (1.429) Total instances2of a Patent being litigated by non-freq litigator(< 20) -0.0213∗∗∗
(0.00562)
Total instances of a Patent being litigated by non-freq litigator(< 15) 8.590∗∗∗ (1.643) Total instances2of a Patent being litigated by non-freq litigator(< 15) -0.0265∗∗∗
(0.00814)
Total instances of a Patent being litigated by non-freq litigator(< 25) 5.357∗∗∗ (1.217) Total instances2of a Patent being litigated by non-freq litigator(< 25) -0.0138∗∗∗
(0.00371) Total instances of a Patent being litigated by freq litigator (> 20) -1.893∗∗
(0.910) Total instances2of a Patent being litigated by freq litigator(> 20) 0.00275 (0.00174)
Total instances of a Patent being litigated by freq litigator (> 15) -1.903∗∗ (0.813) Total instances2of a Patent being litigated by freq litigator(> 15) 0.00211 (0.00171)
Total instances of a Patent being litigated by freq litigator (> 25) -1.309 (1.118) Total instances2of a Patent being litigated by freq litigator(> 25) 0.00197 (0.00215) Patents Issued 32.41∗∗∗ 23.53∗∗∗ 22.18∗∗∗ 27.57∗∗∗ (7.010) (7.489) (7.283) (7.840)
Patents Issued Sq 0.430∗ 0.614∗ 0.620∗ 0.576∗
(0.258) (0.329) (0.326) (0.345)
Year Fixed Effects Yes Yes Yes Yes
District Court Fixed Effects Yes Yes Yes Yes
Industry Sector Fixed Effects Yes Yes Yes Yes
Observations 37260 37260 37260 37260
R-Squared 0.378 0.388 0.390 0.384
Ordinary Least Squares Estimates. The dependent variable is total VC investment at the district court-product level in each year. The sample spans 1995-2012. Robust standard errors reported in parentheses. * p < 0.10, ** p < 0.05, *** p < 0.01
5.5 Instrumental Variable Estimates
One concern in a paper that uses panel data is that there may be unobserved time-varying hetero-geneity that can provide an alternative explanation for the finding. For example, in our setting, we may worry that a pattern of excessive patent litigation could also be linked with worsening economic conditions in that region which drives firms to try to obtain more revenues from existing assets, and in turn these worsening economic conditions may lead to decreased VC investment. Table 3 introduces the most obvious controls for such concerns such as a measure of payroll and innovation activity in each product-court pair, but there is still a concern that there could be some variable such as ‘economic optimism’ which these variables do not adequately capture.
To deal with such concerns, we turn to an instrumental variables approach. An ideal instru-mental variable in this setting will drive the volume of patents involved in court cases being heard in a court system for a particular industry each year, but not be directly related to the provision of VC investment or the motivation of those who provide VC investment, except through the channel of how it affects the volume of patent litigation.
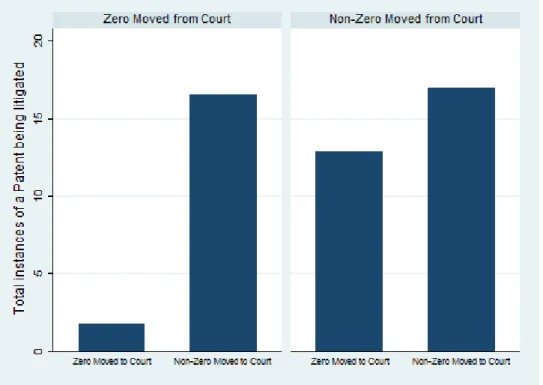
For our instrument, we use the number of patent litigation cases that were moved into that particular court in that year, and the patent court cases that were moved out of that district court in that year. If a court sees many patent cases transferred from it, then this might suggest that it has established a reputation as either being friendly to defendants or plaintiffs. This potential perceived bias leads those involved in the litigation to make efforts to move the case from that court’s jurisdiction. It also affects the volume of cases seen at the court, simply because the favored side has more incentives to bring a case to trial. However, crucially for meeting the exclusion restriction, there is no reason to think that this potential for different legal leanings should affect the VC process directly.
By contrast, if a court sees many patent cases transferred to it, this may reflect the expertise of the judges in patent law or the convenience from the legal perspective of trying the case in that jurisdiction. Again, it seems likely that this expertise or legal convenience will affect the volume of patent law cases without generally affecting the environment for VC investment.
endogenous variable. As shown by Figure 5, both variables are positively correlated with instances of patents being litigated. Though, as the figure shows, while both instruments work in a similar positive direction with a correlation of 0.12 and 0.40 respectively with the patent variable, the two instrumental variables only exhibit a 0.0078 correlation with each other. This suggests that they affect the volume of patent litigation for different reasons. The fact that the two instrumental variables are uncorrelated helps their potential statistical power in estimation.
Figure 5: No. of instances of patents being litigated for a product-court pair by whether that court had non-zero patent litigation cases transferred to it or moved from it.
Source: LexisNexis CourtLink
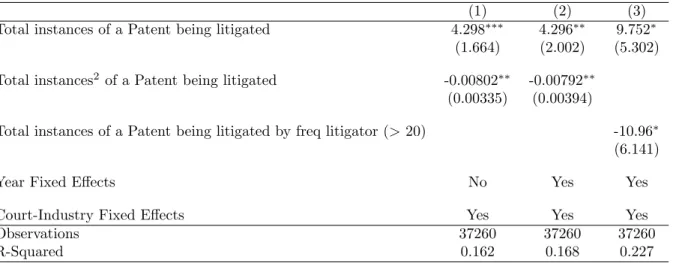
Table 7 reports results of our instrumental variable estimation. In all specifications, we use the same court-industry fixed effects as reported in Column (7) of Table 2. We use this more saturated specification as our instrumental variable at the court-level is somewhat collinear with court fixed effects. Column (1) reports our results without year fixed effects and Column (2) reports the results with year fixed effects. In both cases, our estimates are similar. We note that relative to the magnitude of the reported effect in Column (7) of Table 2, both estimates are larger, perhaps reflecting the fact that we are now estimating a local average treatment effect. This local
average treatment effect only measures the effect of patent litigation that is directly motivated by the attractiveness of that specific court system. In Column (3), we examine the robustness of the negative general slope of VC investment with patents litigated by frequent patent litigators that we observed in Table 6. As we only have two instruments, we do not have enough exogenous variation to explore the squares of the instances of a patent being litigated. However, it is noticeable that we do see a large, linear, and negative effect for patents involving a frequent litigator which supports the results we observed in Table 6.27
Table 7: Instrumental variable estimates: The relation between VC investment and patent litigation
(1) (2) (3)
Total instances of a Patent being litigated 4.298∗∗∗ 4.296∗∗ 9.752∗
(1.664) (2.002) (5.302)
Total instances2 of a Patent being litigated -0.00802∗∗ -0.00792∗∗
(0.00335) (0.00394)
Total instances of a Patent being litigated by freq litigator (> 20) -10.96∗
(6.141)
Year Fixed Effects No Yes Yes
Court-Industry Fixed Effects Yes Yes Yes
Observations 37260 37260 37260
R-Squared 0.162 0.168 0.227
Instrumental Variable Estimates. The dependent variable is total VC investment ($M) in a region-industry-year. Endogenous variables are total instances and total instances2 of patents being litigated. Instruments are the number of patents moving into and out of a court system by year. Equation is exactly identified. F -test for significance of first-stage regression is highly significant - p − value < 0.001 across all columns. The data spans 1995-2012. Standard errors reported in parentheses below. * p < 0.10,
** p < 0.05, *** p < 0.01
6
Cost Estimates of “Excess Litigation”
In this section, we provide some back-of-the-envelope calculations about the likely economic impli-cations of our various findings.
6.1 VC Investment
We use our estimates from Table 6 to provide some rough estimates of the effect of different types of patent litigation on VC investment.
When we look at patent litigation conducted by non-frequent litigators that is past the tipping point based on estimates from Column(2) of Table 6, we find that VC investment in new innovations and startups over the past five years would likely have been $109 million higher than it would have been but-for excess patent litigation.28
Since our analysis suggests a negative and linear relation between the proportion of patent cases involving frequent litigators and VC investment, our estimates from Column (2) of Table 6 suggest that VC investment would have likely been $21.772 billion higher over the course of five years but-for litigation brought by frequent litigators. This is relative to the baseline of $130.979 billion that was invested in startups and innovation over the course of these five years. Since our estimates represent a reasonably large proportion of the baseline, we also followed a bootstrap procedure to try to estimate the 95% confidence interval for this estimate, which was between $8.1 billion and $41.8 billion.29
These estimates are also supported by recent anecdotal evidence of the effect of frequently litigated patents on entrepreneurial activity. Feldman (2013) conducted a survey of 200 venture capitalists and found that 100% of respondents indicated that an existing patent demand against a potential portfolio company could be a major investment deterrent. Feldman also found that
28
This is estimated by employing a bootstrap procedure wherein we re-sample the data with replacement 1,000 times, estimate the model on the re-sampled data from each iteration, and recalculate the loss in VC investment due to litigation by non-frequent litigators that is past the tipping point using the coefficient from each iteration. These estimates exclude industries in the Eastern District of Texas and the District of Delaware.
29
This 95% interval was estimated by employing a bootstrap procedure wherein we sample the data with re-placement 1,000 times, estimate the model on the re-sampled data from each iteration, and recalculate the loss in VC investment using the coefficient from each iteration. The estimates exclude industries in the Eastern District Court of Texas and the District Court of Delaware.
the majority of venture capital firms believe that patent demands have a negative effect on the venture-backed community. Reinforcing this finding, Chien (2013) reported that venture capitalist Brad Burnham could not continue to raise capital for a portfolio company after it was hit by two successive patent lawsuits. Ultimately, Burnham’s firm chose to reduce the portfolio company to a fraction of its former size. Also profiled in Chien (2013), one venture capitalist concluded that the activities of frequent litigators are “creating friction in the acquisition process [and] buyers are warier because they are worried about buying a company and getting sued,” after having witnessed two portfolio companies become targets of frequent litigators (p. 50).
6.2 Comparison of Direct and Indirect Costs
We believe that our research sheds new light on the indirect costs of patent litigation on innovation. For purposes of comparison, in this section we use existing estimates for some of the direct costs of litigation to allow a comparison of the relative magnitudes of our estimates and those in the existing literature.
We calculate these direct costs by building on prior research which has estimated the average total cost of a patent lawsuit involving PAEs, including settlements and legal fees, at between $1.75 million per lawsuit for firms with revenues less than $1 billion and $8.79 million per lawsuit for firms with revenues greater than $1 billion (Bessen and Meurer, 2014). Reflecting their methodology, these estimates include direct legal costs as well as the value of settlements paid or damages awarded. We used the count of how many cases were brought by the frequent litigators we identified in our data (which our estimates in Table 6 suggested had a universally negative effect on VC funding) to estimate that the separate costs of litigation, as identified by Bessen and Meurer (2014), attributable to litigation brought by frequent litigators, was between $3.77 to $18.9 billion in 2012. We recognize that such litigation costs may only be a fraction of the costs imposed by patent lawsuits, but this provides an initial idea of the order of magnitude of the indirect costs of $21.772 billion that we estimate relative to more direct forms of costs that have received the focus of prior academic work. However, these numbers should also be put into the far broader context of spending in the innovation economy. For example, R&D performed in the United States totaled $424.4 billion in