Dynamic Regulation of Pathways by Down-regulating Competing Enzymes
bySue Zanne Tan
B.S. Chemical & Biological Engineering University of Wisconsin-Madison, 2011
SUBMITTED TO THE GRADUATE PROGRAM IN CHEMICAL ENGINEERING IN PARTIAL FULFILLMENT OF THE REQUIREMENTS FOR THE DEGREE OF
DOCTOR OF PHILOSOPHY
AT THE
MASSACHUSETTS INSTITUTE OF TECHNOLOGY MAD-0-7
[ono
ri2017 Massachusetts Institute of Technology. All rights reserved.
Signature of Author:
Certified by:
Signature redacted
__Sue Zanne Tan Department of Chemical Engineering May 24, 2017
Signature redacted
Accepted by: MASSACHUSETTS INSTITUTE OF TECHNOLOGYJUN 192017
LIBRARIES
Kristala L. J. Prather Professor of Chemical Engineering Thesis Supervisor__Signature redacted
Daniel Blankschtein Herman P. Meissner Professor of Chemical Engineering Chairman, Committee for Graduate Students
Dynamic Regulation of Pathways by Down-regulating Competing Enzymes
bySue Zanne Tan
Submitted to the Department of Chemical Engineering on May 24, 2017 in Partial Fulfillment of the Requirements for the Degree of
Doctor of Philosophy in Chemical Engineering ABSTRACT
Microorganisms are promising hosts for the production of valuable chemicals, such as polymer and pharmaceutical precursors, fuel alternatives, flavors and fragrances. Achieving high yields of a product is often restricted by the interconnectivity of pathways in cells and finite nature of cellular resources. To overcome these limitations, dynamic pathway regulation has emerged as a strategy to balance flux between growth and production, such that titers and yields are maximized. Here, we demonstrate that dynamic pathway regulation by down-regulating competing enzymes can successfully improve yields of products. In Saccharomyces cerevisiae, we constructed a hexokinase valve where Hxk2 and GIk1 were deleted and the only remaining Hxk1 was placed under control of the tetracycline transactivating system (tTA) that enables repression of Hxk1 up to 10-fold in activity upon addition of doxycycline. Downregulation of this competing Hxk1 enzyme resulted in a 50-fold increase in gluconic acid and a 3-fold improvement in isobutanol yields from glucose.
Extending this concept to other microorganisms, engineering downregulation of competing enzymes is dependent upon the ability to deplete a protein of interest in an inducible manner in the production host. In Pseudomonas spp., tools for specific protein depletion remain limited. Current methods involve promoter replacements and addition of degradation tags that require editing the genome, a process that can be laborious in Pseudomonas. Here, we developed a CRISPRi gene repression system by engineering the Streptococcus pasteurianus dCas9 and sgRNA. We demonstrate a robust and titratable gene depletion system, with up to 100-fold repression in -galactosidase activity in P.
aeruginosa. We performed the first in vivo characterization of PAM site preferences of S. pasteurianus
dCas9, revealing that targeting both NNGTGA and NNGCGA within the promoter can provide robust repression. Finally, the developed CRISPRi gene depletion system enabled the downregulation of competing muconate cycloisomerase in P. putida, leading to accumulation of muconic acid. In summary, we show that dynamic regulation of pathways by downregulating competing enzymes is an effective method to improve titers and yields of products. Controlling enzyme abundance at the transcriptional level proved successful with the existing tTA system in S. cerevisiae and with our developed CRISPRi system in Pseudomonas.
Thesis Supervisor: Kristala L. J. Prather Title: Professor of Chemical Engineering
Acknowledgements
I remember vividly being in Kris's office in my first year, a day before advisor selection signatures
were given out. Having showed little prior interest and crying in her office were not how I envisioned joining the lab that I would spend the next five years in. I truly believe that joining the Prather Lab was the best thing that happened to my graduate career, even though I really would've wanted to start off with a better first impression. For that, I am grateful to Kris for the opportunity and for taking a chance on me. Thank you for your support and guidance throughout the years. More importantly, thank you for always making time to meet with me and for always asking me how I'm doing. I am also thankful to my thesis committee members Prof. K. Dane Wittrup and Prof. Gerry Fink for their support and advice throughout my graduate thesis.
To past and present Prather Lab members, I probably spent more time in graduate school interacting with you than with anyone else. So, thank you for making lab enjoyable, fun, and for putting up with my occasional lab pranks. Irene Brockman, thank you for training me through boot camp and helping me get started in lab. Shawn Manchester, I owe you all my yeast skills. Micah Sheppard, I always enjoyed our science conversations and I admire how you brought our lab together. Aditya Kunjapur, thank you for always asking the difficult questions about science, entrepreneurship, and life goals. Kat Tarasova, it wouldn't have been the same without you and I am grateful that you are now one of my best friends. Stephanie Doong and Lisa Guay, thanks for dealing with my grumpiness as I became that senior graduate student and for going on coffee breaks with me. Chris Reisch, I am grateful for your mentorship in science and in running. Thank you for being one of my biggest critic.
I am grateful to my friends who made my Ph.D. journey fun, bearable, and meaningful. Karthick,
Siah Hong, Manish, Sunny, Steven, and Chibueze, I am excited to see where the future will take us. Dhina,
I am excited for our SF reunion. Daycee, I am grateful that you're only four hours away. Rosa, you always
know the right things to say. Monique, our friendship is one of the best things that happened during my time at MIT and I wouldn't have been able to do it without you. Finally, I owe it all to my family. Ma and Pa, for sending me to the other side of the world when I was only eighteen, thank you for believing in me and for giving me the opportunity to pursue a better life. My brother Yen, thank you for making me the strong and independent person I am today, it's about time teleportation becomes real.
Abbreviations ATP CRISPR CRISPRi dox E. coli Glk Hxk Hxt I PTG MRP NAD(H) ORF P. aeruginosa P. fluorescens P. putida PCR Pdc Pfk RGE S. cerevisiae S. pasteurianus sgRNA tTA Adenosine triphosphate
Clustered Regularly Interspaced Short Palindromic Repeats CRISPR interference doxycycline Escherichia coli Glucokinase Hexokinase Hexose transporter isopropyl f-D-1-thiogalactopyranoside Mitochondrial ribosomal protein
Nicotinamide adenine dinucleotide (reduced) Open reading frame
Pseudomonas aeruginosa Pseudomonas fluorescens Pseudomonas putida Polymerase chain reaction Pyruvate decarboxylase Phosphofructokinase Rapid growth element Saccharomyces cerevisiae Streptococcus pasteurianus single guide RNA
Table of Contents
Acknow ledgem ents ... 3
A b b re v ia tio n s ... ... 4
L ist o f F ig u re s ... 7
L ist o f T a b le s ... 9
Chapter 1: Introduction...10
In tro d u ctio n ... 1 1 Dynam ic Pathw ay Regulation...12
Tools to Engineer Dynam ic Regulation... 15
T h e s is S c o p e ... 1 8 Chapter 2: Controlling Central Carbon Metabolism to Improve Pathway Yields in Saccharomyces c e re v is ia e ... 2 0 In t ro d u ctio n ... 2 1 M aterials and M ethods...24
Repression of Hexokinase Activity Increases Gluconate Yields... 29
Control of Glucose Flux to Production versus Grow th... 37
Repression of Hexokinase Activity Im proves Isobutanol Yields... 39
Comparison of Hexokinase to Pyruvate Decarboxylase Valve in Improving Isobutanol Yields...48
C o n c lu sio n s ... 5 0 Chapter 3: Reengineering Transcriptional Regulation of Mitochondrial Ribosomal Proteins for Reduced Aerobic Ethanol Production ... 51
In tro d u ctio n ... 5 2 M aterials and M ethods...55
Initial w orking set of M itochondrial Ribosom al Proteins (M RP)... 57
Reporter Assay to Measure Effects of Rapid Growth Element (RGE) Insertions ... 58
YFP Reporter Assays...61
Genom ic insertions of Rapid Grow th Elem ents (RGE)... 62
D is c u s s io n ... 6 8 Chapter 4: Development of CRISPRi gene depletion system in Pseudomonas and its application for dynam ic pathw ay regulation ... 70
Introduction...
... ..
. .. ... ... 71CRISPRi targeting of non-essential genes... 79
sgRNA Design Rules for Transcriptional Repression ... 83
C R ISP R i ta rgeting in sid e O R Fs ... 8 6 CRISPRi depletion of essential gene targets in P. aeruginosa, P. putida and P. fluorescens... 89
CRISPRi multiplex targeting of endogenous genes in P. putida ... 93
Dynamic regulation of pathways using CRISPRi for improved production of cis, cis-muconic acid ... 95
Discussion ...
98
Chapter 5: Conclusions and Future Directions ... 100
Sum m ary of G oals and A chievem ents...101
Dynamic regulation of the glucaric acid pathway in S. cerevisiae...104
M uconic acid production from p-coum aric acid ... 104
Further optimization of CRISPRi system and adaptation for genome editing...105 R e fe re nce s ... ... 1 0 6
List of Figures
Figure 2-1 G lucose valve construction... 30
Figure 2-2 YFP characterization of the tTA system ... 30
Figure 2-3 Growth curve of strain with tTA system ... 31
Figure 2-4 Characterization of glucose valve and improvement in gluconate titers and yields. ... 33
Figure 2-5 Simulation of Hexokinase activity with growth mediated effects... 34
Figure 2-6 Basal Hexokinase activity of tTA construction strains... 36
Figure 2-7 Glucose dehydrogenase activity is not increased by dox addition. ... 36
Figure 2-8 Gluconate titers of Y17 strains at different growth rates. ... 37
Figure 2-9 Ethanol production of Y17 strains at different growth rates. ... 39
Figure 2-10 Isobutanol pathw ay from glucose. ... 40
Figure 2-11 Im provem ent in isobutanol titers and yields. ... 42
Figure 2-12 Ethanol yield of WT and Y115 cultures producing isobutanol. ... 43
Figure 2-13 Glucose concentrations of WT and Y115 cultures producing isobutanol. ... 44
Figure 2-14 Chemostat cultures of WT producing isobutanol... 45
Figure 2-15 Acetolactate synthase activity of WT and Y115 cultures. ... 46
Figure 2-16 Isobutanol and ethanol production of WT and Y9 (hxk2A) strains. ... 47
Figure 2-17 Comparison of isobutanol and ethanol titers of HXK and PDC valve strains ... 49
Figure 2-18 Comparison of isobutanol and ethanol yields of HXK and PDC valve strains...49
Figure 3-1 Saccharom ycotina evolutionary tree... 54
Figure 3-2 Characterization of MRP7 promoter at the TRP locus: RGE location ... 58
Figure 3-3 Characterization of MRP7 promoter at the TRP locus: RGE insertion vs mismatch. ... 60
Figure 3-4 Characterization of MRP7 promoter at the TRP locus with SFP1 overexpression...60
Figure 3-5 Characterization of MRP promoters at its native genomic location. ... 61
Figure 3-6 Characterization of MRPL39 at its genomic location: RGE location... 62
Figure 3-7 Aerobic ethanol production of Strains 1-18. ... 63
Figure 3-8 Aerobic ethanol production of Strains 19-39. ... 64
Figure 3-9 Flask cultivation of chosen strains: Growth... 66
Figure 3-10 Flask cultivation of chosen strains: Glucose consumption... 66
Figure 3-11 Flask cultivation of chosen strains: Ethanol production...67
Figure 4-1 Leaky dCas9 repression with TetR/ptet on pBBR1 plasmid. ... 77
Figure 4-2 Western blot confirms leaky dCas9 expression... 78
Figure 4-3 CRISPRi vector constructs... 79
Figure 4-4 Robust endogenous gene repression in P. aeruginosa. ... 81
Fig u re 4 -5 C R ISPR i is titratable. ... 82
Figure 4-6 Growth of P. aeruginosa is unaffected at high IPTG concentrations. ... 82
Figure 4-7 sgRNA Design Rules for Transcriptional Repression...83
Figure 4-11 Targeting PAM site NNGCGA inside ORFs. ... 88
Figure 4-12 Targeting ftsZ in P. aeruginosa, P. putida and P. fluorescens... 89
Figure 4-13 Depletion of ftsZ prevents growth on plates... 90
Figure 4-14 Depletion of ftsZ results in filamentous growth... 90
Figure 4-15 Depletion of ftsJ in P. aeruginosa. ... 91
Figure 4-16 sgRNAs designed to target flgB and trpG in P. putida... 92
Figure 4-17 Depletion of flgB reduces swimming radius in P. putida... 92
Figure 4-18 Depletion of trpG prevents growth of P. putida in the absence of tryptophan...93
Figure 4-19 Schematic of double sgRNA constructs for multiplex CRISPRi repression...94
Figure 4-20 Multiplex gene repression with double sgRNA: motility assay. ... 94
Figure 4-21 Multiplex gene repression with double sgRNA: pyoverdine production. ... 95
Figure 4-22 Muconic acid biosynthesis pathway in P. putida... 96
List of Tables
Table 3-1: Initial set of chosen strains for flask cultivation ... 64
Introduction
Microorganisms are promising hosts for the production of valuable chemicals, such as fuel
alternatives1, polymer2 and pharmaceutical 3 precursors, flavors4 and fragrances. The immense
diversity in the physiology of different microbes offers tremendous potential in using microbial cell factories given a desired product, starting material or growth conditions. For example, the yeast Saccharomyces cerevisiae's native ability to produce ethanol efficiently from glucose has
rendered it the ideal host for bioethanol production5. Pseudomonas putida that naturally
degrades aromatic acids is a suitable host for using lignocellulosic biomass as a starting material6,
while methanotroph bacteria provides a biological means to the upgrading of methane7, which
is the least expensive source of carbon. For growth at supercritical carbon dioxide conditions, an environmental strain of Bacillus megatarium has been isolated and is currently being engineered for production of 4-methyl-pentanol in our lab'. With the abundance of microbes to choose from, the limitation then lies on the availability of genomic sequence to function information of the
microorganism and molecular biology methods for DNA manipulation of the host.
Metabolic engineering of microorganisms for the production of molecules often involves pathway engineering and host engineering. Pathway engineering includes expressing the required enzymes, whether native or heterologous, for the conversion of substrate to the desired product. Host engineering, on the other hand, involves manipulation of the rest of the cell such as removing competing or native regulatory pathways to improve flux to the desired product. Often times, these two processes consist of static changes, such as constitutive overexpression of pathway enzymes and deletion of competing enzymes, both of which are also often optimized separately. Although these conventional strategies have proved to be successful in improving titers and yields in some cases, these methods are restrained by the interconnectivity of pathways in cells and finite amount of cellular resources. For example, constitutive overexpression of pathway enzymes comes at the expense of other shared cellular resources, such as ATP and reducing energy that could affect growth and productivity. Deletion of competing enzymes is limited only to non-essential enzymes and would require nutrient
Dynamic Pathway Regulation
To that end, dynamic regulation of pathways has emerged as the preferred method to better balance flux between growth of cell and production of desired molecule. Typically, an endogenous enzyme that is located where the production pathway intersects with cell metabolism is identified and placed under dynamic control, such that flux going into cell metabolism can be diverted to the production pathway at an ideal time. For the production of isopropanol in E. coli, a toggle switch was designed to simultaneously increase flux through the isopropanol pathway, decrease flux into the TCA cycle and increase pyruvate conversion to acetyl-CoA. This dynamic regulation of flux around acetyl-CoA led to a 4-fold improvement in isopropanol titers9. In yeast S. cerevisiae, native glucose responsive promoters can be used to control expression of genes as a function of growth, when growing on glucose. By characterizing the strengths of HXT and GAL promoters in response to glucose, flux around FPP was increased or decreased accordingly by controlling the expression of pathway genes with these promoters,
leading to improvements in carotenoid production10. Using the tetracycline transactivator
protein (tTA) system that functions independent of carbon source but requires exogenous addition of an inducer, control of glucose flux into glycolysis in S. cerevisiae was achieved by
down-regulating Hexokinase 1. This decrease in glucose flux improved yields of gluconic acid and
isobutanol from glucose by 50-fold and 3-fold, with simultaneous reduction in ethanol byproduction.
Although successful in improving production of molecules of interests, these examples involve addition of an inducer at a pre-determined time to enable dynamic regulation. A further extension of the system is autonomous induction, where the control of enzyme levels are turned on or off without manual addition of inducers. Autonomous induction can be engineered by utilizing promoters or engineering biosensors that are responsive to pathway metabolites or integrating quorum sensing systems that is dependent on cell density. Metabolite responsive promoters that are used to control gene expression are often derived from native promoters that are first identified by screening with the desired metabolite, followed by optimization for dynamic range by manipulating promoter strength. One advantage of using such promoters is
that it involves only a promoter replacement without the need to express an additional transcription factor. An example of using metabolite responsive promoters for pathway regulation in E. coli is in the mevalonate pathway, where levels of the intermediate farnesyl pyrophosphate (FPP) that is toxic to cells were controlled". Expression of the downstream amorpha-4,11-diene synthase was regulated by a FPP-responsive promoter, which was identified
by mining whole-genome transcript arrays, leading to improved flux to the mevalonate pathway.
In yeast, native ergosterol responsive promoters were screened and used to down-regulate expression of ERG9, diverting flux of FPP away from squalene and into amorphadiene production, leading to 5-fold improvement in titers'3. Biosensors are typically derived from transcription factors that bind DNA upon interaction with a metabolite. Depending on the host, substantial
engineering of the transcription factor and binding site on the promoter are often required to
achieve the desired dynamic range. Some examples of using biosensors for autonomous induction include using a transcriptional repressor FapR as a malonyl-CoA biosensor, where the production of fatty acids in E. coli was improved by balancing flux of malonyl-CoA production and
consumption14
. Synthetic promoters were designed to turn the upstream gene expression off and the downstream gene expression on upon binding of FapR to malonyl-coA. The FapR/malonyl-CoA biosensor has also been ported into yeast to dynamically induce expression
of a heterologous malonyl-CoA reductase for the production of 3-hydroxypropionic acid'5.
Quorum sensing systems provide another method of autonomous induction that is triggered when a certain cell mass has been achieved. The well-studied luxR system from Vibrio fischeri consists of a luxl synthase that produces acyl-homoserine lactone (AHL), which interacts with the luxR transcription factor. Placing the gene of interest under luxR control then enables cell density dependent gene expression upon AHL accumulation. The switching time when gene expression is triggered can be varied by manipulating the expression levels of luxi and luxR.
Examples of utilizing the luxR system for dynamic pathway regulation include late induction of
pathway enzymes in the production of 1,4-butanediol from xylose 16 and redirection of metabolic
flux from the TCA cycle into isopropanol production by autonomous induction of a toggle switch' in E. coli. Another quorum sensing system, the Esa QS system from Pantoea stewarti, has been
on the promoter18. Building upon the Esa QS transcriptional repression constructs enabled direct
repression of phosphofructokinase in E. coli, leading to the improvement of glucaric acid
production by dynamically diverting flux away from glycolysis'9. In yeasts, applications of quorum
sensing systems for metabolic engineering remain limited. Porting the aforementioned luxR and
Esa QS systems that consists of bacterial transcriptional repressors into yeast prove challenging due to the nature of transcriptional repression in eukaryotes that require chromatin remodelling. Thus, native quorum sensing systems such as the pheromone cell-to-cell communication in yeast
have been engineered20 and used to induce RNA interference (RNAi) to deplete pyruvate kinase.
This down-regulation diverts flux of phosphoenolpyruvate from glycolysis into the shikimate
Tools to Engineer Dynamic Regulation
Engineering dynamic regulation of a pathway involves engineering the ability to control the abundance of an enzyme in an inducible manner. Enzyme abundance can be manipulated at the transcriptional, post-transcriptional or post-translational level. Numerous methods exist to regulate protein abundance at these different levels, each with its own advantages and limitations. In general, intervention at the transcriptional level elicits a faster response but the protein of interest is still susceptible to native post-transcriptional and post-translational regulation, if any. On the other hand, regulating at the post-translational level directly controls the protein abundance but is more wasteful as resources are used to produce the protein, only to be degraded. Notably, the efficiency of the different methods is very much host dependent and the ideal method would also be application dependent.
At the transcriptional level, promoter systems such as TetR/Ptet, Lacl/Plac, and AraC/Para have been widely used in bacteria to express genes of interests in an inducible manner. These systems enable turning on of gene expression, which is useful for late induction of pathway enzymes that may be beneficial for flux balancing or stability of the enzyme. To turn gene expression off in bacteria, synthetic promoter systems such as the inverter, which combines Ptet
and Plac, has been developed and demonstrated to improve gluconate yields in E. coli by
diverting flux away from glycolysis22
. In recent years, the CRISPR interference (CRISPRi) gene repression system, developed by engineering a nuclease-null Cas9 from S. pyogenes that is recruited to the target DNA by expressing a single guide RNA (sgRNA), has served as the primary method to turn gene expression off at the transcription level in bacteria. In E. coli, the CRISPRi system has been characterized to provide up to 100-fold repression of RFP fluorescence, expressed on the genome". In dynamic regulation of pathways, the CRISPRi system has recently
been used to improve flux through the mevalonate pathway in E. coli for isoprene production. A
70% decrease in mRNA levels of ispA was achieved with CRISPRi that led to 2.6-fold increase in
isoprene titers24. In the cyanobacterium Synechococcus sp., repressing glutamine synthetase I
with CRISPRi improved lactate production, by increasing concentrations of a-ketoglutarate that
In cases where multiple genes need to be repressed simultaneously, expression vectors to construct multiple sgRNAs with repeat sequences have been developed that employ USER or
Golden Gate cloning methods26
. Up to five sgRNAs were expressed simultaneously to divert succinate semialdehyde away from the TCA cycle and into 4-hydroxybutyrate (4HB). With individual sgRNAs providing up to 90% gene repression in mRNA levels, improvements in 4HB
mol% in poly(3-hydroxybutyrate-co-4-hydroxybutyrate) were achieved7. Alternative to
expressing multiple sgRNAs to repress multiple genes is to express a trans-activating CRISPR RNA (tracrRNA) with an array of precursor crRNA (pre-crRNA) that contains spacers (targeting sequences) uniformly dispersed within repeat sequences. Characterization of this method by targeting GFP expressed on plasmid resulted in up to 10-fold repression in fluorescence. Using a crRNA array targeting three different genes, TCA cycle genes and the fadR transcriptional regulator that controls the pool of malonyl-CoA, a 2.5-fold increase in naringenin titers were
accomplished2 8. One benefit of using the CRISPRi system over promoter replacement methods is
that genome editing of the target gene is not required, enabling its application in hosts where genome editing is challenging. Although the off-target effects of Cas9 has been well characterized in mammalian systems, the extent of off-target effects are less established in bacteria.
Nonetheless, the first 12bp sequence of the target sgRNA being most important for targeting
with S. pyogenes Cas9 remains universal2
129. Additionally, off-target effects for gene repression could be less detrimental than for genome editing. The more relevant limitation of the CRISPRi system is therefore in the toxicity of dCas9 expression" that would affect growth of pathway-expressing cells that typically already suffer from growth defects.
At the post-transcriptional level, methods to down-regulate mRNA levels include anti-sense RNA (asRNA) in bacteria and RNA interference (RNAi) systems in yeast. Anti-anti-sense RNA
involve expressing short ~100bp complementary mRNA, encompassing the ribosome binding site
(RBS) and open reading frame (ORF), that hybridizes with the target mRNA to prevent translation or cause mRNA degradation. RNAi systems in eukaryotes similarly involve expressing a complementary mRNA; however, expression of Dicer and Argonaute enzymes are also required, where Dicer cleaves the dsRNA to smaller RNAs that are then recognized by Argonaute for degradation". An example of using asRNA for pathway regulation is in downregulatingfabD in E.
coli, where an 80% interference efficiency was achieved, leading to a 4.5-fold increase in intracellular malonyl-CoA concentrations32 . In yeast, the RNA interference (RNAi) system was
used to deplete pyruvate kinase to divert flux of phosphoenolpyruvate from glycolysis into the
shikimate pathway for the production of para-hydoxybenzoic acid (PHBA)21.
Controlling protein abundance at the post-translational level involves adding a signal peptide to the protein of interest and expressing the required degradation machinery. In E. coli, the native CIpXP degradation system that recognizes the SsrA signal peptide is often utilized. To
engineer inducibility, the expression of SspB that tethers the target protein to the CIpXP machinery after recognition of SsrA, can be placed under control of an inducible promoter. Variants of the SsrA peptide with different degradation rates have also been engineered,
increasing the achievable dynamic range. For a completely orthogonal system in E. coli, a protein
degradation system from Mesoplasma
florum's
tmrna system has been engineered that alsoutilizes a similar SsrA degradation tag (Pdt), but that is not recognized by E. coli's native machinery33. The application of this system was extended to Lactococcus lactis and variants of this Pdt tag with different degradation rates have also been characterized. For dynamic regulation of pathways, the SspB/CIpXP system was used to down-regulate phosphofructokinase in E. coli to divert flux of glucose-6-phosphate away from glycolysis and into glucaric acid production3 4. In yeast, the polypeptide sequence rich in proline (P), glutamic acid (E), serine (S) and threonine (T), called the PEST sequence, serve as proteolytic signals on cyclins involved in cell cycle regulation. Attaching PEST sequences to the C-terminal of otherwise stable proteins has been used as a protein degradation method; however, given that it is recognized by native proteolytic machinery, protein depletion is not inducible. Nonetheless, use of the common PEST sequence from CLN2 to degrade ERG9 in S. cerevisiae that competes for FPP for squalene production has led to the improvement of nerolidol titers3.
Thesis Scope
Based on previous work in our lab demonstrating that the dynamic down-regulation of glucokinase in E. coli can improve yields of gluconic acid", we sought to extend this concept into
S. cerevisiae. The mechanism of glucose transport into the cell of E. coli and S. cerevisiae is
markedly different. In E. coli, glucose is primarily transported into the cell through the
phosphotransferase system (PTS), where glucose is phosphorylated to glucose-6-phosphate coupled by the conversion of phosphoenolpyruvate to pyruvate. Since the production of gluconic acid requires free intracellular glucose, the PTS system had to be deleted such that glucose is only transported through galactose permease GaIP and subsequently phosphorylated by glucokinase. The expression of this glucokinase was then placed under dynamic regulation to improve flux of glucose into gluconic acid. In S. cerevisiae however, glucose is transported into the cell through a family of hexose transporters, HXT, with varying affinities to glucose and whose expression are dependent on extracellular glucose concentrations. Once transported into the cell, glucose is phosphorylated to glucose-6-phosphate by three isoenzymes: Hexokinase I, Hexokinase 2 and Glucokinase 1. Hexokinase 2 is the dominant enzyme that is also a regulatory protein involved in glucose repression. It is one of these hexokinases that will have to be placed under dynamic control to divert flux away from central carbon metabolism and into the gluconic acid pathway.
In controlling glucose flux into central carbon metabolism with the hexokinase valve, we observed significant decrease in aerobic ethanol production. The decrease in ethanol production at low glucose flux in S. cerevisiae is well established; however, previous methods to reduce glucose flux have involved using glucose feeding strategies and engineering of glucose transporters. Here, we demonstrated that controlling expression of glycolytic genes directly could also result in reduction of aerobic ethanol production. Although the hexokinase valve accomplishes this effect, the strain suffers from slow growth due to the inherent nature of reducing glucose flux. Efforts to eliminate aerobic ethanol production by deleting pyruvate decarboxylase not only leads to cells with severe growth defect, but also the inability to produce cytosolic acetyl-CoA. To explore the possibility of engineering a S. cerevisiae strain with reduced aerobic ethanol production and negligible growth defects, we looked into the genome evolution
of yeast where S. cerevisiae and its closest neighbors have evolved for fermentative growth. Comparative genomic studies have revealed the loss of a Rapid Growth Element (RGE) sequence of AATTTTT in the promoters of a class of mitochondrial ribosomal proteins of S. cerevisiae. Interestingly, this sequence is lost in S. cerevisiae, Saccharomyces paradoxus and Candida
glabrata that undergone the Whole Genome Duplication Event and have respiro-fermentative
growth. Since this sequence is retained in yeast species like Candida albicans that only have respiratory growth, the loss of this RGE sequence has been hypothesized to cause changes in the transcriptional regulation of mitochondrial ribosomal proteins that contributed to S. cerevisiae's Crab-tree positive phenotype. To explore the possibility of reverting the Crab-tree positive phenotype, we started re-inserting the RGE sequence in the promoter of a subset of
mitochondrial ribosomal proteins and measured growth and ethanol production dynamics.
After successful demonstration of dynamic pathway regulation in S. cerevisiae, we
wanted to further extend the concept to Pseudomonas. Pseudomonas putida is an interesting
host for metabolic engineering applications due to its native tolerance to alcohols and alkenes and its aromatic acid degradation pathways. However, tools to specifically deplete proteins on interest in P. putida, which is required to enable down-regulation of competing enzymes, is limited. In fact, even in P. aeruginosa, a well-studied Pseudomonas due to its medical relevance, gene depletion methods remain limited to promoter replacements and addition of degradation tags, both of which require editing the genome. In these bacteria, genome editing can be laborious due to the low efficiency of currently available methods. Therefore, we sought to develop a gene repression tool in Pseudomonas to enable inducible protein depletion. Not only would such a system enable downregulation of competing pathways for dynamic regulation applications, but also enables the study of essential genes and any application that require inducible protein depletion. To that end, we developed the CRISPRi gene depletion system for Pseudomonas using the Type 11 CRISPR/Cas9 from Streptococcus pasterianus. We show that this robust and inducible system functions across P. aeruginosa, P. putida and P. fluorescens for dynamic pathway regulation as well as depletion of essential proteins.
Chapter 2: Controlling Central Carbon Metabolism to
Improve
Pathway Yields
in
Saccharomyces
cerevisiae
(Adapted from published paper: Tan, S. Z.; Manchester, S.; Prather, K. L. J. Controlling Central Carbon Metabolism for Improved Pathway Yields in Saccharomyces Cerevisiae. ACS Synth. Biol.
Introduction
Microbial fermentation has the potential to produce valuable compounds, such as pharmaceuticals3, fragrances4, and fuel-like molecules36
, from simple and inexpensive starting materials. One of the challenges in manufacturing molecules with microbes is achieving sufficient titers and yields such that the overall process can be economically feasible. Some common
methods to improve pathway yields include overexpression of pathway enzymes3 7, deletion of
competing pathways38, and engineering redox and energy balances39. However, these methods
are not always successful due to the interconnectivity of metabolic pathways and the finite nature of cellular resources40. Deletion of competing pathways may deprive cells of essential metabolites that would have to be supplied extracellularly to support growth, which creates an undesirable added expense for the culture medium. On the other hand, simply overexpressing pathway enzymes comes at the expense of shared cellular resources, such as ATP and NAD(P)H that ultimately lead to poor growth and protein expression41, especially if these enzymes are
kinetically inferior to endogenous ones.
An alternative to these traditional approaches is to control and regulate metabolic pathways in a dynamic manner42. Here, synthetic biology offers tools such as inducible gene expression systems29 and quorum sensing circuits18
that enable the construction of pathway regulation. Although these genetic circuits are well studied, there remains a gap in effectively integrating these systems into different levels of cellular complexity. Recent efforts in utilizing synthetic biology tools in metabolic control have mainly focused on Escherichia coli as a host. Dynamic regulation of carbon flux at glycolysis using a genetic inverter2 2 and by controlled
enzyme degradation34
have been shown by our lab, while others have explored nodes further down in central carbon metabolism such as the construction of a malonyl-CoA sensor14, optimization of enzyme expression levels for fatty acid production43, and a toggle switch at the
acetyl-CoA node of the TCA cycle44. In Saccharomyces cerevisiae however, successful
implementation of synthetic regulatory circuits for metabolic control remains challenging. Most studies have involved relatively simple circuits using native promoter systems that are dependent
induction by native metabolites are limited in robustness. Metabolism of methionine during
growth has been shown to relieve repression of the gene under MET3 promoter control, leading
to a decrease in product synthesis
49. Circuits involving the GAL promoter are limited to systems
where changing carbon sources between glucose and galactose is permissible, thereby excluding
most production strains where carbon sources can significantly affect metabolic enzyme
activitiess
0and heterologous gene expression
1. More recently, dynamic regulation using native
pheromone quorum sensing has been shown to improve production of para-hydroxybenzoic acid
(PHBA)
21; however, the system was restricted to tryptophan-free media since addition of
tryptophan was used to initiate the quorum sensing system. In addition, most metabolic control
efforts in S. cerevisiae have concentrated on increasing flux through the farnesyl diphosphate
branch-point, where the MET3
46and ERG1
1 3promoters were used to improve amorphadiene
titers and the HXT1 promoter to increase a-santalene production
47. Outside of the mevalonate
pathway, little has been accomplished in controlling central carbon metabolism for pathway
improvements. Although early glycolysis and its role in glucose repressions
2and ethanol
accumulation
53are well studied, redirecting carbon flux at this node into a heterologous
pathway, when no other carbon source exists, remains unexplored.
The first committed step of glycolysis involves the conversion of glucose to
glucose-6-phosphate with the consumption of ATP. In S. cerevisiae, this step is catalyzed by three enzymes:
hexokinase 2 (Hxk2p), hexokinase 1 (Hxklp) and glucokinase 1 (Glk1p)
5 4. Hxk2p is the dominant
enzyme that is involved in glucose repression and represses the expression of Hxk1p and Glkip
in the presence of glucose
55. We hypothesized that controlling the enzyme levels responsible for
this first step of glycolysis would enable the control of carbon flux into central carbon metabolism
when glucose is the sole carbon source. In particular, knocking down hexokinase or glucokinase
levels will reduce the amount of glucose-6-phosphate available for glycolysis, thereby increasing
the availability of glucose. Here, we present a genetically encoded metabolite valve
2 2that
provides the control of central carbon metabolism and redirection of carbon flux into a
heterologous pathway. We first constructed a hxk2A g/klA strain and controlled the only
remaining Hxk1p using the tetracycline transactivator protein (tTA) systems
6. Unlike native
promoter systems, this synthetic gene repression system is repressed by the addition of
doxycycline, which is not metabolized by cells, thereby providing a more stable regulatory system. To then demonstrate the redirection of flux into a heterologous pathway, we chose production of gluconic acid, or gluconate, as a model pathway that utilizes glucose as the substrate. Gluconic acid is widely used as a bulk chemical in food, feed, and textile industries57. It is commercially made through a variety of different manufacturing processes: chemical synthesis, electrochemical catalysis, and enzymatic biocatalysis, as well as fermentation
processes using bacteria or fungi5 . Some examples of microbial fermentation of gluconic acid
are from Aspergillus niger17 and Aureobasidium pullulan ", where yields of up to 95% and 87%
on glucose were achieved at optimized conditions. Glucose can be converted to gluconic acid through an oxidation process to glucono-6-lactone, which spontaneously hydrolyzes to gluconic
acid. We expressed glucose dehydrogenase, gdh, from Bacillus subtilis for the production of
gluconic acid in our strains. The reported kcat/KM value of B. subtilis glucose dehydrogenase, 160
M/s60, is significantly lower than that of S. cerevisiae Hxk1p, 8800 M/s6
1,62. Since Hxk1p
intrinsically outcompetes glucose dehydrogenase for glucose, this pathway is an ideal model system to demonstrate the utility of a glucose valve. This proof-of-concept is one of the first demonstrations in S. cerevisiae of dynamically redirecting glucose flux away from glycolysis, resulting in superior improvement in yields (50-fold) of a heterologous pathway while simultaneously reducing ethanol by-production even in glucose excess conditions. Moreover, we extended the application of this system to improving yields of the isobutanol pathway. Even in semi-anaerobic conditions, a 30% decrease in ethanol accumulation was achieved, alongside a 3-fold increase in isobutanol yield from glucose.
Materials and Methods
Strain and Plasmid Construction
S. cerevisiae W303 and CEN.PK2 strains and plasmids used in this study are listed in Appendix
2-1. The tetracycline transactivator protein (tTA) system was cloned into the genome from plasmids
that were kindly provided by Dr. Narendra Maheshri (MIT Department of Chemical Engineering,
Cambridge, MA). Isobutanol overexpression constructs, pJA123 and pJA180
63, were kindly
provided by Dr. Gerald Fink (MIT Department of Biology and Whitehead Institute for Biomedical
Research, Cambridge, MA). Oligonucleotides used were purchased from Integrated DNA
Technologies (Coralville, IA) and Sigma-Genosys (St. Louis, MO). All molecular biology
manipulations were carried out according to standard practices
64. Yeast transformation was
performed using standard lithium acetate protocol
61and mutants were identified and isolated
by colony PCR. HXK1 promoter replacement in Y17 was further verified with sequencing. All
plasmids were cloned in
E.
coli DH5a using standard chemical transformation
66.Culture Conditions
Experimental cultures were grown at 30
0C in yeast synthetic medium (SD complete)
containing Yeast Nitrogen Base (Difco), 2% glucose, and complete amino acids. Gluconate
production experiments were performed in SD-leu (lacking leucine). Cultures were grown for 3
days in 50-mL shake flasks with a starting inoculation of OD
6oo 0.01 in the presence of 1000 ng/mL
dox. Isobutanol production experiments were performed in SD-ura (lacking uracil) containing
10% glucose, in semi-anaerobic conditions for 10 days in 10-mL tubes. Cultures were grown with
a starting inoculation of OD600
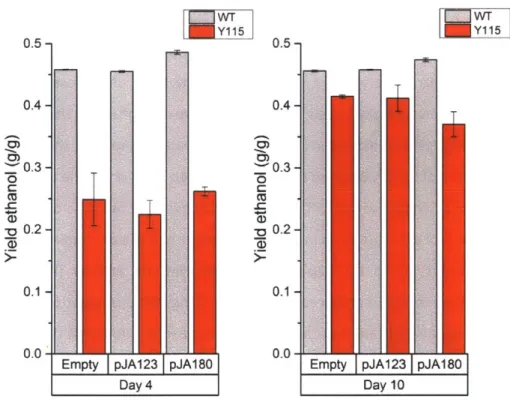
0.1 and in the presence of 1000 ng/mL dox for Y115.
Hexokinase Activity Assay
Hexokinase activity assay was performed on crude lysates by resuspending frozen pellets
in 750 uL of 10 mM Tris-HCI, 1 mM EDTA, 140 mM NaCl, 0.01% SDS, pH 7.5 and subjected to lysis
with glass beads. Supernatant was collected by centrifugation and used as follows. Hexokinase
activity was measured in a coupled enzymatic assay67. Hexokinase converts glucose to glucose-6-phosphate in the presence of ATP. Glucose-glucose-6-phosphate is then converted to 6-phospho-D-gluconate by glucose-6-phosphate dehydrogenase (G6PDH) with the generation of NADPH that is measured on the spectrophotometer at 340 nm. One unit of hexokinase activity will
phosphorylate 1.0 pmol/min of D-glucose at pH 7.5 and room temperature in the presence of
3.33 U/mL G6PDH, 60 mM Tris-HCI, 20 mM magnesium chloride, 8.0 mM ATP, 12.0 mM glucose,
and 0.9 mM NADP+. Activity measurements were normalized by total protein as measured using the Bradford assay6 8.
Metabolite Analysis
Culture supernatant was analyzed on an Agilent 1100 series HPLC instrument with an
Aminex HPX-87H column (Bio-Rad Laboratories, Hercules, CA) with 5 mM sulfuric acid as the mobile phase at 350C and a constant flow rate of 0.6 mL/min. Glucose, ethanol and isobutanol
levels were monitored using the refractive index detector (RID) while gluconate was monitored
on the diode array detector (DAD) at 230nm. Because glucose and gluconate co-elute at ~9 min
on the RID, the DAD signal was used to resolve the two species. Glucose levels were also measured with a YSI 2950D Biochemistry Analyzer (Yellow Springs, OH). Concentrations were determined from standard curves of analytes prepared from Sigma-Aldrich (St. Louis, MO).
Quantification of mRNA levels
Total RNA was extracted from frozen pellets by hot acid chloroform extraction69. Briefly, pellets were resuspended in 50 mM sodium acetate pH 5.2 and 10 mM EDTA pH 8. Cells were lysed with the addition of SDS to a final concentration of 1.6% and an equal volume of phenol chloroform isoamyl alcohol. Solutions were heated at 65*C for 10 min and cooled on ice for 5
min. Further extractions were performed with equal volumes of chloroform. RNA was then precipitated with ethanol and resuspended in water. Samples were then treated with TURBO
transcribed using the QuantiTect Reverse Transcription Kit (Qiagen, Valencia, CA) according to manufacturer's instructions. The synthesized cDNA was then amplified with HXK1 specific primers in a qPCR reaction with Brilliant 11 Sybr Green High ROX QPCR Mix (Agilent Technologies, Santa Clara, CA) on an ABI 7300 Real Time PCR System instrument (Applied Biosystems, Beverly, MA). Transcript levels were quantified in duplicate with appropriate no-template, no-RT and serial dilution controls. Reported levels are the averages of biological triplicates, each measured in technical duplicates.
MATLAB simulation parameters
The following equations were used to illustrate the magnitude of growth-mediated buffering effect on changes in mRNA abundance.
mRNA, m, balance:
dm
-- = a - (kd + Y)M
dt
Where a = mRNA transcription rate, kd = mRNA decay rate, and p = growth rate.
Protein, p, balance:
dp
~=lm- pp
Where 6 = translation rate.
The growth rate, M, was estimated by
i =
yp
+ (PWhere y and qp were estimated by the slope and intercept of experimentally obtained growth
rate vs. hexokinase activity. y = 0.0705 hr-1 and
'p
= 0.0436 mThe following parameters were used in the simulation:
HXK1 mRNA decay rate, kd = 0.02 min- 70
Turnover of Hxk1p, kcat = 1.06 s-161
Mass of protein/cell in S. cerevisiae = 4x10-12g 1
Continuous stirred tank reactor culture of WT pJA123
Continuous stirred tank reactor cultures of WT pJA123 were performed in SD ura- containing 10% glucose to mimic conditions in batch experiments, in semi-anaerobic conditions in 50mL Wheaton Celstir Spinner Double Side Arm flasks. Fresh media was constantly flowed into the reactor at the same rate as the outlet flow of cells, using Masterflex pumps. Dilution rates
achieved were 0.027, 0.03, 0.046, 0.063, 0.055, 0.053, 0.12 and 0.12 hr-1, calculated by measuring
inlet flow rates. Samples were taken at steady state and after >5 volumes of reactor have passed.
Glucose dehydrogenase Activity Assay
Glucose dehydrogenase activity was measured directly from the oxidation of glucose to gluconic
acid with the production of NADH. One unit of Gdh activity oxidizes 1.0 pimol/min of D-glucose
at pH 7.6 at room temperature in 60 mM potassium phosphate buffer and 0.67 mM NAD+.
AHAS Activity Assay
AHAS activity was measured by the colorimetric single-point method 7. The optimized assay
contained 50mM sodium pyruvate, 1mM thiamine pyrophosphate, 10mM MgC 2, 10p1M FAD, and
7.2mM ATP in 1.15M potassium phosphate buffer pH 7.0. Cell lysates were prepared using Y-PER Yeast Protein Extraction Reagent (Life Technologies, Grand Island, NY) and incubated in 5 mg/mL lyticase (Sigma Aldrich, St. Louis, MO) at 300C for 30min. Equal volumes of cell lysate and assay
mix were then incubated at 30*C for 20min and the reaction was stopped by the addition of 50% H2SO4 to a final concentration of 1%. After incubation at 60*C for 15min to convert acetolactate to acetoin, acetoin was then quantified by further incubation at 30*C for 10min in the presence
of 0.15% creatine and freshly prepared 1.5% a-naphthol (in 2.5N NaOH). The color developed was measured at 540nm and acetoin was used as a standard. One unit (U) of activity is defined as that producing 1 amol of 2-acetolactate per minute under the above conditions. Protein
Results and Discussion
Repression of Hexokinase Activity Increases Gluconate Yields
In a hxk2A gikiA strain, Y12, we constructed a glucose valve at the only remaining hexokinase, Hxk1p, to divert flux away from central carbon metabolism and into the gluconate pathway (Figure 2-1). We hypothesized that deleting the dominant and regulatory Hxk2p would disrupt native regulation of glucose, thereby allowing the valve more control over carbon flux at this node. The transcription of HXK1 and GLK1 has been shown to be up-regulated in hxk2A
mutants with glucose as the carbon source7
1; therefore, we predicted that the deletion of this dominant Hxk2p would still result in sufficient flux into glycolysis to support growth and production. The valve was constructed by controlling the transcription of HXK1 using the
tetracycline transactivator protein (tTA) system. The tTA system has been shown to repress
transcription, upon addition of doxycycline (dox), up to 100-fold using f-galactosidase as a reporter. We first tested this system in a positive feedback manner, with tTA being expressed under 7xtetO in the genome, driving the expression of YFP with 7xtetO on a centromeric plasmid. Addition of dox repressed YFP fluorescence in a dose-dependent manner and up to a maximum
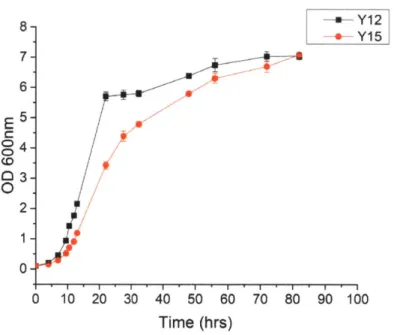
80% (Figure 2-2). In addition, we estimated the burden of expressing the tTA system by
comparing the growth of Y15 (hxk2A giklA trpl::7xtetO tTA) to Y12 (hxk2A gk1LA) and saw small effects on growth but comparable final OD6oo (Figure 2-3).
A Glucose Hxt Glucose Hxk I Hxk2 GikiV B *) Dox tTA 7xtetO tA 7xtEWO HXK1 Glucose dehydrogenase, gdh Glucose-6-phosphate Gluconate Embden-Meyerhof pathway
Figure 2-1 Glucose valve construction.
(A) In a hxk2A gIkiA strain, a glucose valve was constructed by controlling the transcription of Hxk1p in
order to divert flux into the gluconate pathway. (B) The tTA protein, which consists of TetR fused to a VP16 activating domain, was expressed with 7xtetO CYCI TATA from the TRP1 locus. The native HXK1 promoter was also replaced with 7xtetO CYC1 TATA. Upon addition of doxycycline (Dox), the binding of Dox to tTA causes a conformational change that releases tTA from the DNA, thereby repressing transcription of HXK1.
50000 -40000 -30000 -0 IL 20000 -10000 - 0-0 250 500 1000 2500 5000 Dox concentrations (ng/mL)
Figure 2-2 YFP characterization of the tTA system.
YFP fluorescence (normalized by OD6 00) of cells expressing 7xtetO tTA from the genome and PRS415
7xtetO YFP, with increasing dox concentrations (ng/mL). Dox addition was performed at inoculation, OD6 0 0
8 - -Y12 -+Y1 5 7- 6-E 5-C S4-I
03-0.
2-
0-0 10 20 30 40 50 60 70 80 90 100 Time (hrs)Figure 2-3 Growth curve of strain with tTA system.
Growth curve of strain Y15 expressing tTA (hxk2A glk1A trpl::7xtetO tTA) compared to Y12 (hxk2A
glk1A). Error bars represent standard error among three biological replicates.
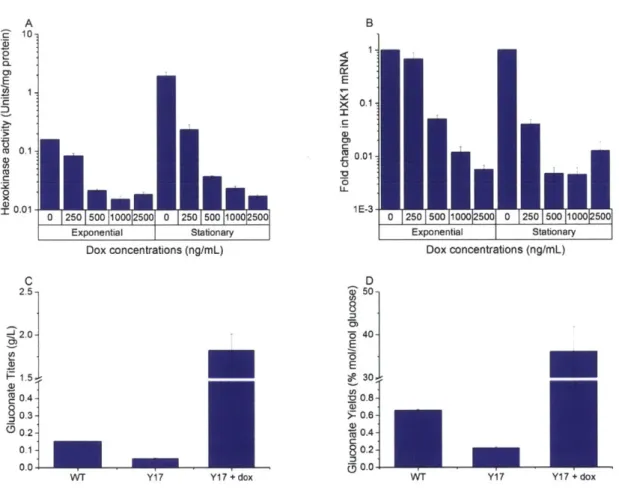
To control the transcription of HXK1 with the tTA system, we expressed 7xtetO tTA in the genome and replaced the native HXK1 promoter in Y12 with 7xtetO, creating strain Y17. Addition of dox repressed hexokinase activity up to 10-fold, as measured in cell lysates at late exponential phase (Figure 2-4). The repressed hexokinase activity of strains with 500-2500 ng/mL dox persisted into stationary phase, while those with 0-250 ng/mL dox increased when measured at stationary phase. The general increase in hexokinase activity from exponential to stationary phase is consistent with previous reports75; hexokinase activity of wild-type S. cerevisiae has been shown to increase 5-fold throughout growth. This result suggested that a minimum amount of
500-1000 ng/mL dox was needed to maintain hexokinase repression up to 72 hours and
concentrations above 1000 ng/mL provided no additional repression; therefore, subsequent experiments were performed with 1000 ng/mL dox. mRNA quantification of HXK1 confirmed that the reduction in hexokinase activity was due to reduced HXK1 mRNA levels (Figure 2-4). HXK1
mRNA levels were significantly lower in strains with dox addition, up to ~100-fold at 1000-2500
Although mRNA levels alone have been shown to be insufficient in predicting protein abundance in S. cerevisiae76,77, the decrease in HXK1 mRNA levels was consistent with the
observed trend in hexokinase activity in our experiments. In addition, it has been reported that transcription only accounts for 30% of the regulation of Hxk1p abundance7"; by measuring
glycolytic fluxes, it was determined that Hxk1p and other glycolytic enzymes were primarily regulated at post-transcriptional levels. Here, we saw that a 100-fold decrease in mRNA levels resulted in a 10-fold decrease in hexokinase activity at late exponential phase (although at stationary phase, a 100-fold decrease was observed primarily due to an increase in activity of the non-induced strain). The relationship between HXK1 mRNA levels and the observed activity of Hxk1p is also complicated by its direct effect on growth rate. Down-regulation of Hxk1p decreases growth rate that counters the effects of dilution by growth. In fact, simple modeling using
experimental growth rates and literature values of Hxk1p translation rate79, mRNA synthesis rate
and half-life70 supports this hypothesis (Figure 2-5). The model shows that an 80% reduction in mRNA synthesis rate only results in a 46% reduction in activity due to growth-mediated buffering effects of Hxk1p, while incorrectly assuming a constant growth rate predicts a higher, 79%, reduction in activity instead. This similar effect has been demonstrated in the down-regulation of glucokinase in a AptsHlcrr E. coli strain.
A 'e 10-2 0. E 1 c 0. 0.1 - 0.01 0 250 500 100012500 0 250 500 1000 500 Exponential Stationary Dox concentrations (ng/mL) C 2.5--J 2.01 1.5 0.4- 0.3-0.2 0.1 0.0 --WT Y1 7 Y17 + dox B z E X 0.1 CD 0.01 *0 L L 1 E - 3 Exponential Stationary Dox concentrations (ng/mL) D 50-8. 5 40-E 30. '00.8-.LD >- 0.6- 0.4- 80.2- 00.0-WT Y1 7
Figure 2-4 Characterization of glucose valve and improvement in gluconate titers and yields.
(A) Addition of doxycycline represses hexokinase activity in a dose dependent manner, as measured in
cell lysate at late exponential and stationary phase. (B) Fold change in HXK1 mRNA of strains in (A) compared to un-induced (0 ng/mL dox) condition, as measured at late exponential and stationary phase.
(C) Gluconate titers (g/L) and (D) gluconate yields (% mol/mol glucose) of WT and Y17, with and without 1000 ng/mL dox induction. Error bars represent standard error among three biological replicates.
X 10-3 2.5 - -- constantp _E 2 2. 00 1000 2000 3000 4000 5000 6000 7000 8000 9000 10000 time [min]
Figure 2-5 Simulation of Hexokinase activity with growth mediated effects.
MATLAB simulation of hexokinase activity (U/mg) as a result of an 80% reduction in mRNA synthesis rate, for a constant growth assumption and with growth mediated buffering effects.
After demonstrating effective hexokinase repression, the gluconate pathway was introduced into WT W303 and Y17 strains by expressing glucose dehydrogenase on a centromeric plasmid, pRS415-gdh. Gluconate titers and yields were lower in Y17 than in WT, though not substantially so (Figure 2-4). Although Hxk2p and Glklp were deleted in Y17, the measured hexokinase activity of Y17 was higher than that in Y12 (Figure 2-6). This result suggests that 7xtetO tTA, with a CYC1 TATA box, is a stronger promoter than the native HXK1 promoter in Y12, resulting in hexokinase expression levels that were more comparable to WT levels. However, upon induction of Y17 with 1000 ng/mL dox at OD600 0.01, there was a significant increase in gluconate titers from 0.15 g/L to 1.8 g/L (Figure 2-4). More importantly, a ~50-fold increase in gluconate yields from glucose was achieved, from 0.7% to 36% mol gluconate/mol glucose. This large improvement in yield is the result of both an increase in gluconate titers and a significant decrease in glucose consumption in the induced strains. In comparison to reported industrial
16
- Initial steady state
yields of 87-95%5759, this improved yield of 36% was achieved in shake flask experiments without any other strain or process optimization. The repression of hexokinase activity successfully allowed glucose flux to be redirected into the gluconate pathway, even when the reported kcat/KM of the competing native Hxk1p was more than an order of magnitude higher than the
heterologous glucose dehydrogenase60-2. In addition, the 10-fold decrease in hexokinase activity
through transcriptional control was sufficient for the redirection of glucose, even though it was
reported that transcription only accounts for 30% of the regulation of Hxk1p abundance7
1. Thus, we believe that our tTA system is generalizable to enzymes that are regulated at the transcriptional level, even if transcription may only account partially for its regulation of abundance. To confirm that the observed increase in gluconate titers is not due to an increase in
the activity of the pathway enzyme but due to repression of hexokinase activity, glucose
dehydrogenase activities were measured in Y17 at different dox concentrations (Figure 2-7). There was no increase in glucose dehydrogenase activities at high dox concentrations where significant improvement of gluconate titers and repression of hexokinase activity were observed. This experiment confirmed that the increase in gluconate titers was not simply due to higher activity of the pathway enzyme, but due to glucose redirection as designed.
T
WT Y12 Y17 Y17 + dox
Figure 2-6 Basal Hexokinase activity of tTA construction strains.
Hexokinase activity (U/mg protein), as measured in cell lysates at late-exponential phase, of WT, Y12, Y17 and Y17+dox strains. Error bars represent standard error among three biological replicates.
0.040 -0.035 -0.030 -0.025 0.020 -0.025 -0.010 - 0.005-0.000
-T
I
0 250 500 1000 Dox concentration (ng/mL) 2500Figure 2-7 Glucose dehydrogenase activity is not increased by dox addition.
Glucose dehydrogenase, Gdh, activity (U/mg protein), as measured in cell lysates at stationary phase, of Y17 at different dox concentrations (ng/mL). Error bars represent standard error among three biological replicates. 1.2- 1.0-E , 0.6- S0.4-0 x 0.2 -0.0
-4-Control of Glucose Flux to Production versus Growth
We further characterized gluconate production of Y17 under different inducer concentrations and timing of induction (Appendix 2-2). Under these various conditions, a range of different growth rates and gluconate titers was achieved, ranging from 0.05-0.10 hr' and
0.08-2.31 g/L gluconate, respectively (Figure 2-8). In general, higher dox concentrations and earlier
induction times resulted in strains with the lowest hexokinase activities. At low levels of hexokinase activities, these strains grew more slowly, presumably due to reduced flux into glycolysis. A triple null mutant of hxklA, hxk2A, and g/klA failed to grow on glucose as the sole carbon source, confirming that no other carbon utilization routes exist at these experimental conditions. Therefore, the observed changes in growth rates solely due to change in hexokinase activities in our experiments are reflective of glycolytic flux. Strains with the slowest growth rates were the highest gluconate producers; less glucose flux into glycolysis allowed more glucose to
be redirected into the gluconate pathway.
3.0 - I . 2.5- 22.0-
1.5-8
0.5 --0.0 I . I I 0.04 0.06 0.08 0.10 0.12 Growth rate (hr-)Figure 2-8 Gluconate titers of Y17 strains at different growth rates.
Each data point represents a biological triplicate of an experiment performed at a specific dox concentration, from 0 to 2500 ng/mL, and timing of induction, from OD600 0.01 to OD6 00 1. Error bars
In addition to producing a range of different gluconate titers, these strains also produced
different amounts of ethanol at late exponential phase (Figure 2-9). Strains with the lowest
growth rates generally produced the least amount of ethanol, consistent with studies on the
Crabtree effect at glucose-limited conditions
0. The formation of ethanol in S. cerevisiae even in
aerobic conditions is due to overflow metabolism; at high glycolytic flux, fermentation occurs due
to limitations in respiratory capacitys
3. Glycolytic flux, in turn, depends on the glucose uptake
rate which is regulated by a family of hexose transporters. These hexose transporters are
encoded by the twenty HXT genes, each with different glucose affinities and is regulated by
extracellular glucose concentrations
8 1,
82