Digitized
by
the
Internet
Archive
in
2011
with
funding
from
Boston
Library
Consortium
Member
Libraries
Massachusetts
Institute
ot
Technology
Department
of
Economics
Working
Paper
Series
DOES COMPETITION
REDUCE
COSTS?
ASSESSING
THE IMPACT OF
REGULATORY
RESTRUCTURING
ON
U.S.
ELECTRIC
GENERATION
EFFICIENCY
Kira
Markiewicz
Nancy
Rose
Catherine
Wolfram
Working
Paper 04-37
November
2004
RoomE52-251
50
Memorial
Drive
Cambridge,
MA
02142
This
paper
can
be
downloaded
without
charge
from
the
Social
Science
Research
Network
Paper
Collection
athttp://ssrn.com/abstract=6
1828
MASSACHUSETTS
INSTITUTEOF
TECHNOLOGY
DEC
7200^
Does
Competition
Reduce
Costs?
Assessing the
Impact
of
Regulatory Restructuring
on
U.S. Electric
Generation
Efficiency
Kira
Markiewicz
UC
Berkeley,Haas
School
of Business
Nancy
L.Rose
MIT
and
NBER
Catherine
Wolfram
UC
Berkeley
and
NBER*
November
2004
*markiewi(a),haas.
berkeley.edu.nrosefajmit.edu,wolfram@haas.berkelev.edu. Roseacknowledgessupport
fromthe
MIT
CenterforEnergy and EnvironmentalPolicyResearchandtheHooverInstitution.We
thankparticipantsatthe
NBER
ProductivityProgramMeeting,theNBER
10Summer
InstituteMeeting,the UniversityofCaliforniaEnergyInstitutePOWER
conference,andtheMIT
CenterforEnergy and EnvironmentalPolicyResearchconference, as wellasseminarparticipantsatHarvard,MIT,UC
Berkeley,UC
Davisand Yalefor theirsuggestions.We
are particularly grateful forthe detailedcomments onearlier draftsprovided by Al Klevorick,Mark
Roberts,CharlesRossmanandJohannesVan
Biesebroeck.We
alsothankTom
Wilkeningforassistanceincodingrestructuringpolicycharacteristicsacrossstates.Does
Competition
Reduce
Costs?
Assessing
the
Impact
of
Regulatory Restructuring
on
U.S.
Electric
Generation
Efficiency
Kira
Markiewicz
Nancy
L.Rose
Catherine
Wolfram
Abstract
Although
theallocativeefficiency benefitsof competitionarea tenetofmicroeconomic
theory,therelation
between
competitionand
technical efficiencyis lesswellunderstood. Neoclassicalmodels
ofprofit-maximizationsubsume
staticcost-minimizing behaviorregardless of marketcompetitiveness, butagency
models
of managerial behaviorsuggest possiblescopeforcompetitiontoinfluencecost-reducingeffortchoices. Thispaperexplores the empiricaleffectsof competitionontechnical efficiencyinthecontextofelectricityindustryrestructuring.
Restructuringprograms adopted by
many
U.S.statesmade
utilitiesresidualclaimantstocost savingsand
increasedtheirexposuretocompetitive markets.We
estimate theimpactofthesechanges
on
annualgeneratingplant-levelinputdemand
fornon-fuel operatingexpenses, thenumber
ofemployees
andfuel use.We
findthatmunicipally-ownedplants,whose owners were
forthe
most
partunaffectedbyrestructuring, experiencedthesmallest efficiency gainsoverthe pastdecade. Investor-ownedutilityplantsinstates thatrestructuredtheirwholesaleelectricity marketshad
thelargestreductions innonfueloperatingexpensesandemployment,
whileinvestor-owned
plants innonrestructuringstates fellbetween
these extremes.The
analysisalsohighlightsthesubstantiveimportanceoftreatingthe simultaneityofinputandoutput decisions,
which
we
do throughaninstrumental variables approach.JEL
Codes:
L
11,L43,
L5
1,L94,
D24
Keywords:
Efficiency, Production,Competition,
Electricity restructuring, ElectricEconomistshave long arguedthatcompetitiongeneratesimportant efficiencybenefits foran
economy. These
generally focuson
allocative efficiency;theimplicationsof competitionfortechnical efficiencyare less clear. Neoclassical
models
ofprofit-maximizationsubsume
static cost-minimizingbehaviorby
all firms,regardlessof marketcompetitiveness.1Agency
models, however, inrecognizing the interplayofasymmetricinformationwiththe separationofmanagement
andcontrol, suggest possible deviationsfrom
cost-minimization byeffort-aversemanagers. These
models
may
imply arole forcompetitioninconstrainingmanagerialbehavior,by rewardingefficiency gains
and
confrontingless-efficientfirms withthechoiceofcost reductiontotheleveloftheirlower-cost counterparts orexit; see Nickell(1996)fora brief discussionofsome
ofthesetheoreticalarguments. Theiractualrelevanceisultimatelyanempirical question.
Thispaperassesses theeffectof competition ontechnicalefficiencyusingdata
on
the U.S.electricgenerationsector.
The
pastdecadehaswitnessedadramatictransformationofthis industry. Until themid-1990s, overninety percentoftheelectricity intheUS
was
soldby
vertically-integratedinvestor-ownedutilities(IOUs),
most
operatingasregulatedmonopolistswithintheirserviceareas. Today, non-utilitygenerators
own
roughly aquarterofgeneration capacitynationwide,andIOUs
inmany
statesown
onlya smallfractionoftotalgenerating capacity andoperateinapartiallyderegulatedstructure thatreliesheavily on market-basedincentives orcompetition.
While
studiesofstate-level electricityrestructuringsuggestpoliticiansmay
have been motivatedinlarge partby
rent-seeking(e.g.,White, 1996, and Joskow, 1997),many
proponentsofrestructuringarguedthatexposingutilitiestocompetitive,market-basedoutcomes
would
yieldefficiency gainsthatcouldultimatelyreduce electricitycosts andretailprices. Research
on
otherindustriessuggests productivity gains associatedwithderegulation(e.g., OlleyandPakes, 1996,
on
telecommunications andNg
andSeabright,2001,on
airlines) and withincreased competitive pressurecausedby
factorsotherthan regulatory change(e.g.,Galdon-Sanchez
and Schmitz, 2002,on
ironoremines).2The
considerablebody
ofacademicwork
on
electricityrestructuring withinthe U.S.and abroadhas thus farfocusedon assessing theperformance ofcompetitivewholesalemarkets, with
1
Theimplicationof competitionfordynamicefficiencythroughinnovationisthesubjectof anextensive
theoreticalandempiricalliterature ineconomics,datingatleastfrom Schumpeter's 1943 classic
particular attention tothe exerciseof market
power
(see forexample
Borenstein,Bushnelland
Wolak,
2002
andJoskow
andKahn,
2002).While
many
ofthecostsofelectricityrestructuringhave beenintensively studied, relativelylittleefforthas
been
devotedtoquantifyingany expost operating efficiency gainsofrestructuring, althoughafew
studies(e.g.,Knittel, 2002) have analyzedefficiencyeffectsofvarious incentive regulations in this sector.3 Thisstudyprovides thefirstsubstantialanalysisofearlygeneration efficiency gains ofelectricityrestructuring.As
such,itcontributestothebroad
economic
debateon
theroleof competitionintheeconomy
and
isofdirectpolicy relevanceto statescontemplatingthe futureoftheir electricity restructuring programs.
The
resultsofthiswork
indicate thatplant operatorsmost
affectedby
restructuringreducedlaborand nonfuelexpenses,holding output constant,
by
roughly5%
ormore
relativetootherinvestor-owned
utility(IOU)
plants,andby 15-20%
relativetogovernment-and cooperatively-ownedplants,
which were
largely unaffectedby
restructuring incentives. Thesemay
beinterpretedasthe
medium-run
efficiency gainsthatJoskow
(1997, p. 214)posits"may
beassociatedwithimprovingthe operatingperformance ofthe existing stockofgeneratingfacilitiesandincreasing the productivityoflaboroperating thesefacilities."
Our work
alsohighlightstheimportanceof treatingthe simultaneity ofinputand
output choice. Failingtorecognizethatshocksto input productivitymay
inducefirmstoadjusttargetedoutput leadstooverstatementofestimated efficiencyeffects, insome
casesby
afactoroftwo
ormore.While
endogeneity concernshave beenlongrecognizedinthe productivityliterature,oursisone ofthefirststudiesofelectricgenerationtocompensateforthis. Finally,
we
explore thesensitivityoftheestimated efficiencyimpacttothechoiceofcontrolgroupto
which
restructuredplants arecompared, anddiscuss theissuesinvolvedindeterminingtheappropriate counterfactual.
2
Some
hintofthispossibility in electricityisprovidedbyPrimeaux(1977),who
comparedasample ofmunicipally
owned
firmsfacingcompetitiontoamatchedsample ofmunicipallyowned
firms inmonopolysituations and foundasignificantdecreaseincostsper
kWh
forfirmsfacingcompetition.3
One
exceptionisHiebert (2002),who
uses stochasticfrontierproductionfunctionstoestimate generation plantefficiencyover 1988-1997.One
setof independentvariablesheincludesisindicatorsforregulatory ordersor legislativeenactment ofrestructuringreformsin 1996 andin1997. Whilehefindssignificantreductionsin
mean
inefficiency associatedwithrestructuring lawsin1996forcoalplants,hefindsno effectsforgasplants,norfor either fueltypein1997. Ourworkuses alongertimeperiod,richercharacterizationofthe restructuringenvironmentanddatingof reformsconsistentwiththeU.S. Energy
Information Administration,and analternativetechnologyspecificationthatallowsformore complex productivityshocksandtreatspossible inputendogeneitybiases. Joskow(1997)describes thesignificant
laborforcereductionsthataccompaniedrestructuringinthe
UK,
asthe industrymoved
from state-ownedmonopolytoaprivatized,competitive generation market,althoughthesemixrestructuringand
The
remainderofthepaperis organizedasfollows: Section 1 describes existingevidenceonthecompetitiveeffectsofefficiency,anddiscusses
how
restructuringmightalterelectricgenerationefficiency. Section2 detailsourempirical
methodology
fortestingthesepredictions,anddescribes our strategyforidentifying restructuringeffects.
The
dataaredescribedinSection3.Section4reportstheresultsofthe empiricalanalysis, andSection 5 concludes.
1.
Why
Might
Restructuring AffectGenerator
Efficiency?Exit
by
less-efficientfirms isawell-understoodefficiencybenefitofcompetition: asoutputshifts from(innately)higher-costfirmstolower-costcompetitors thetotalproductioncostforagivenoutputleveldecline. Olleyand Pakes (1996) provideempirical evidenceofthis
phenomenon
in theirplant-levelanalysisofthemagnitude and source ofproductivitygainsintheU.S.telecommunications equipmentindustryover 1974-1987.
They
findsubstantial increasesinproductivity associated withthe increasedcompetitionthatfollowedthe 1984divestiture
and
deregulationinthissector,andidentifytheprimary sourceofthesegainsasthere-allocationof
output
from
lessproductivetomore
productive plants acrossfirms. Ina similarvein, Syverson (2004)finds thatmore
competitivelocalmarkets intheconcrete industryareassociatedwith highermean,lessdispersion,and
higherlower-boundsinplant productivity, effectsheattributes totheexitofless-efficientplantsinmore
competitiveenvironments.The
existingevidenceon
whether competitionalso leadstocostreductionsthroughtechnical efficiency gainsby
continuingproducersandplantsisrelativelysparse. Nickell(1996)usesapanel of
670
U.K. manufacturingfirmstoestimateproduction functionsthatinclude controls forthecompetitiveenvironmentsin
which
firms operate.He
findssome
evidenceof reducedproductivitylevelsassociatedwithmarket
power
andstrongsupportforhigher productivitygrowthrates in
more
competitive environments. Concerns abouttheability ofcross-industry analysistocontroladequatelyforunobservableheterogeneity acrosssectorsmay make
sector-specificevidencetighterandmore
convincing.4A
notableexample
istheGaldon-Sanchez
and
Schmitz (2002)studyoflabor productivity gainsat ironoreminesthatfaced increased
competitive pressurefollowingthe collapseofworldsteelproduction intheearly 1980s.
They
findunprecedentedratesoflabor productivity gains associatedwiththisincreaseincompetitive 4
A
numberofstudieshave analyzedefficiencygainsfollowing regulatoryreforminvariousindustries; see, forexample,Bailey's(1986) overview and Parketal.(1998) onairlines. Unfortunately,inmany
casesitisdifficult todisentangledirectregulatoryeffectsonefficiency(e.g.,operatingrestrictionsimposed
ontrucking firms orairlinesbyregulators inthosesectors)fromtheindirect effectsof reduced
pressure, "drivenbycontinuing mines,producingthe
same
productsand
using thesame
technologyastheyhadbefore the 1980s" (Galdon-Sanchez and Schmitz, 2002,p. 1233).5 Severalfeaturesofthe electricgeneration sector
make
itanattractivesubjectfortestingpotentialcompetitiveeffectsontechnicalefficiency.6 First,generationtechnologyisreasonablystableand well-understood anddataon productioninputs andoutputsattheplant-levelare readilyavailable
toresearchers. Thishas
made
electricgenerationacommon
applicationfornew
productionand
costfunction estimation techniques, datingatleasttoNerlove(1963). Second,policyshifts over
arelativelyshortperiodhaveresulted inadramatictransformationofthemarket for electric power.
Through
the early 1990s, theU.S.electricity industrywas
dominatedby verticallyintegratedinvestor-ownedutilities(IOUs).
Most
operatedasregulatedmonopolists overgeneration,transmission,
and
distribution ofelectricitywithintheirlocalizedgeographicmarket,thoughthere
was
some
wholesalepower
tradedamong
utilities orpurchasedfroma small butgrowing
number
ofnon-utilitygenerators. Pricesgenerallywere
determinedby stateregulatorsbasedon accountingcostsofserviceatthefirmlevel.
By
1998,everyjurisdiction(50 statesandtheDistrictof
Columbia)
had
initiatedformalhearingstoconsiderrestructuring their electricity sector,andby
2000, almosthalfhad approvedlegislationintroducingsome
form of competitionincludingretailaccess.7 Thisprovidesbothtimeseriesand geographicvariation incompetitive
environments. Third, staticand
dynamic
efficiencyclaims bolsteredmuch
ofthepolicyreform;measuringthese benefitsisavitalprerequisitetoassessing the
wisdom
ofthesepolicies. Ithaslongbeen arguedthat traditionalcost-of-service regulationdoesrelativelywellinlimitingrentsbutlesswellinprovidingincentivesforcost-minimizingproduction; seeLaffontandTirole (1993).
Under
pure cost-of-serviceregulation,regulator-approved costs oftheutilitiesarepassed directlythroughtocustomers,andreductionsinthe costofservice yieldatmost
short-termprofits until ratesarerevisedto reflectthe
new
lowercostsatthenextratecase.8Given
asymmetric information
between
regulatorsandfirms, inefficientbehaviorbymanagers
that raises operationscostsabove
minimum
costlevelsgenerallywould
bereflectedinincreasedrates5
Ng
andSeabright(2001)estimate cost functionsforapanelofU.S.andEuropeanairlinesover1982-1995,and concludethatpotentialgainsfromfurther privatizationandincreasedcompetition
among
Europeancarriersare substantial,thoughthey point outthatthebest-measuredcomponentofthesegains
relates toownershipratherthanmarketstructure differences.
6
Understandingpossible reallocationofoutput acrossplantsishampered bytheexitofplantsfrommost availabledatabases
when
they are soldtonon-utilityowners.7
IntheaftermathofCalifornia'selectricitycrisisin2000-2001,restructuringhasbecomelesspopularand
many
stateshave delayedorsuspendedrestructuringactivity,includingsixthathadpreviously approved retailaccesslegislation. SeeUS
Energy Information Administration(EIA),2003.and passed throughtocustomers.
Joskow
(1974) and Hendricks (1975) demonstratethat frictionsincost-of-serviceregulation, particularlythosearisingfromregulatorylag(time
between
price-resetting hearings),may
providesome
incentivesatthemarginforcost-reducingeffort. Their impactgenerallyis limited,however,apartfromperiodsofrapidnominalcostinflation(seeJoskow, 1974).
This systemledeconomiststoarguethatreplacing cost-of-service regulationwith
higher-powered
regulatory incentiveschemes
orincreasedcompetitioncouldenhanceefficiency.9Over
the 1980s andearly 1990s,
many
stateutilitycommissions
accordinglyadoptedsome
form ofincentiveregulation.
The
limitedempiricalevidenceavailableonthesereforms,which modify
pricesettingwithin the regulated
monopoly
structure,suggestsmixed
results. Knittel (2002) studiesa varietyofincentive regulations inusethrough 1996, andfinds thatthose targetedatplantperformanceorfuelcost
were
associatedwithgainsinplant-levelgenerationefficiency.10More
generalreforms, suchas pricecaps, rate freezes,and revenue-decoupling programs, typicallywere
associatedwithinsignificantor negative efficiency estimates,allelse equal.Restructuring,incontrasttoincentiveregulations,fundamentally
changed
theway
plantowners
earn revenue.
At
thewholesale level,plantsselleitherthroughnewly
created spotmarkets orthrough long-termcontractsthatarepresumably based
on
expectedspotprices. Inthe spot markets, plantowners
submitbids indicating theprices atwhich
theyarewillingto supplypower
fromtheirplants. Dispatchorderisset
by
thebids, and,inmost
markets, the bidofthemarginalplantispaidtoallplantsthataredispatched. High-costplants willbeforced
down
inthe dispatchorder, reducinglikelyrevenue. Plant operatorsthatreducecosts
move
higherinthedispatchorder, increasing dispatchprobability, andincrease theprofitmargin
between
own
costsand
theexpectedmarketprice.
Most
restructuringprogramsalsochanged
theway
retailrates are determined andtheway
inwhich
retailcustomersareallocated." Retailaccessprogramsin8
Ratesareconstantbetweenratecases,apartfromcertainspecificautomatic adjustments(suchas fuel
adjustmentclauses),sochangesincostwouldnotbereflected in rates untilthenextratecase.
9
See,forexample,LaffontandTirole, 1993,foratheoretical justification,orJoskowand Schmalensee,
1987,foranappliedargument.
10
Knittel uses
OLS
andstochasticproductionfrontiertechniquestoestimateCobb-Douglasgenerating plantproduction functions incapital,labor,andfuelforapaneloflargeIOU
plantsover 1981-1996. Hisresultsfromfirst-differencedmodels,whichimplicitlyallowfor plant-levelfixedefficiencyeffects,
suggest gainsontheorderof1-2%associatedwiththese reforms.Equationsthatdonotallow forplant fixedeffectssuggest
much
largermagnitudes.Stateshave useda varietyof approachesto linkretailratesunderrestructuringtowholesaleprices inthe market. Overthe shortterm,moststatesdecoupledutilityrevenuefromcostsbymandatingretailrate freezes,oftenatlevelsdiscountedfrompre-restructuringprices.
Some
states,suchasPennsylvania,areaggressively tryingtoencourageentrybycompetitiveenergysuppliers,
who may
contractdirectlywith retailcustomers.combination withthe creationofthe
new
wholesalespotmarketsmay
increase theintensityofcost-cuttingincentives, leadingtoevengreatereffortto
improve
efficiency.While
themost
significantsavingsfrom
restructuringare likely tobeassociated withefficientlong-runinvestmentsin
new
capacity, theremay
beopportunitiesformodest
reductionsinoperatingcostsofexistingplants(seeJoskow, 1997). Thispaperattemptsto
measure
the extentofthatpossible
improvement
forthe existingstockofelectricitygenerating plantsintheU.S.The
implicit null hypothesisisthat,beforerestructuring,operatorswere
minimizingtheir costs, giventhecapital stock availableintheindustry.Under
thenull,thereshouldbeno
changein plant-levelefficiencymeasures associatedwithrestructuring activity.We
discussbelow
ourmethod
forestimating plant efficiencyandidentifying deviationsfromthishypothesis. Assessingtheeffectsofrestructuring requiresspecificationof
how
generatingplantswould
havebeenoperated absent the policy change. Constructingthiscounterfactualiscrucial, butdifficult.
2.
Empirical
Model
Fora single-outputproductionprocess, productive efficiencycan beassessed
by
estimatingwhether aplantis
maximizing
outputgivenitsinputs and whetheritisusing the bestmix
ofinputsgiventheirrelative prices. Productionfunctionsdescribe thetechnologicalprocess of transforminginputstooutputs
and
ignore thecosts ofthe inputs;a plantisefficientifitisontheproduction frontier. Cost minimizationassumesthat,giventhe inputcosts,firmschoosethe
mix
ofinputsthatminimizesthe costsof producingagiven levelofoutput.
A
plantcouldbe producingthemost
output possible fromagiveninputcombination,butnotminimizingcostsif,for instance, labor
was
cheaprelativetomaterials,yet the plantusedalot ofmaterialsrelativeto labor.Even
ifthe firmwere
producingthemaximum
output possiblefrom itsworkersand materials, itwould
notbeefficientifitcouldproducethesame
levelofoutputlessexpensively bysubstituting laborformaterials.We
explore theimpactofrestructuringon efficiencyby
specifying a production functionandthen deriving the relevant input
demand
equations impliedbycostminimization.
We
adopttheconventionofrepresenting generating plant output(Q)by
thenetenergythegeneratingunitsproduce over
some
period(measuredby
annual megawatt-hours,MWh,
inour data), achoicethatisdiscussedinfurther detail inthedata sectionbelow.While
amultitudeofstudiesofelectricplantproductivity
model
thisoutputasa functionofcurrentinputs, often usinga
Cobb-Douglas
production or costfunction, the characteristicsofelectricityproductionarguethatissensitive to importantinstitutional characteristicsofelectricityproductionthathave
been
largelyignoredintheearlierliterature.
First,observedoutputingeneralwillbethelesseroftheoutput the plantiscapable ofproducing, givenits availableinputs,
and
the output calledforbythesystemdispatcher.Because
thesystemdispatcher
must
balancetotalproductionwithdemand
ateachmoment,
thegap between
probable(Q
p
)andactual
(Q
A
)outputforagivenplantiwillbe afunctionof
demand
realizations,the setofotherplantsavailablefordispatch,andplanti's positioninthedispatchorder.12
Second, whilefuel inputsarevariedinresponsetoreal-timedispatching
and
operationalchanges,other inputstoaplant'sproduction aredeterminedinadvance ofoutputrealizations. Capital
typicallyischosenatthetimeofaunit'sconstruction(orretirement),andatthe plantlevelis
changed
relativelyinfrequently.From
themanager'sperspective, itmay
be considereda fixedinput. Utilitieshirelaborandsetoperatingandmaterialsexpendituresinadvance, based
on
expected
demand.
While
thesecanbeadjustedoverthemedium-run,
staffing decisionsaswellasmost
maintenanceexpenditures arenottied toshort-run fluctuationsinoutput.We
thereforetreattheseas set in advance ofactualproduction, and determiningatarget levelof probable
output,
Q
p.Finally,whilelabor, materials,andcapital
may
betosome
extentsubstitutable toproduceprobableoutput, thegenerationprocess generallydoesnotallowthese inputstosubstitute for fuel intheshort-run.
Given
thisdescriptionofthetechnology,we
positaLeontief productionprocessforplantiinyeartofthefollowing form:
Q
lt A=
min[g(Eit,T
E ,eit E ),Q
it p(K
i;L
it,M
it,T
p ,£it p )-exp(£it A ))]where
Q
A isactualoutputandQ
pisprobableoutput; inputsaredenotedby
E
forenergy(fuel)input,
K
for capital,L
for labor,andM
formaterials;T
denotesparametervectors,andzdenotes unobserved(totheeconometrician)mean
zero shocks. SeeVan
Biesebroeck (2003)forthe derivationofa similarproduction functionheusestomodel
automobileassembly plant production.12
Random
shockstoaplant'soperations, suchasunexpected equipmentfailuresorequipmentthat lastslonger than expected,willcauseittoproducelessormorethanitsprobableoutputfromasetofavailable
As
notedabove,fuelinput decisionsaremade
in realtime, afterthemanager
hasobservedany shocksassociatedwiththeplant'sprobableoutputproductivity,EjtP
,theactualoperationofthe plant,£it
A
,andtheplant's energy-specific productivityinthe current period,£it E
. Probable
output,
Q
p,is incontrastdeterminedbyinput decisionsmade
inadvance ofactualproduction.We
assume
that capital,measured
by
thenameplategenerating capacityoftheplant,isfixed.14Labor
andmaterialsdecisionsaremade
inadvance ofproduction, butaftertheleveland
productivityoftheplant's capital isobserved. Thisreflectsthequasi-fixityofthese inputs over
time: staffingdecisions and maintenanceplansaredesignedtoensurethatthe plantis available
when
itisdispatched,basedon
the targeted outputQ
p.The
errorterm£it p
incorporates productivityshocksthat
we
assume
areknown
tothe plantmanager
inadvance of schedulinglaborandmaterialsinputs,butarenotobservabletotheeconometrician.
We
allowactualoutputto differ
from
probableoutputbya multiplicativeshock exp(£itA
),
assumed
tobeobservedatthetimefuelinputchoices are
made
but notknown
atthetime probable outputisdetermined. This shockwould
be, forexample, negativeifageneratingunitwere
unexpectedlyshutdown
duetoamechanical failure,or positiveifthe plant
were
runmore
intensivelythan anticipated, asmight bethecaseifa
number
ofplantsahead ofitintheusual dispatchorderwere
unavailable ordemand
realizations
were
unexpectedlyhigh.We
model
probableoutput(Q
p)withaCobb-Douglas
functionoflaborandmaterialsandembedding
capital effects inaconstant(Q
(K)) term. Thisyieldsthe specification:(PF1 )
Q
lt P<
Qo(Ki)-(Lity
L -(Mit)™- exp(£l p )Inpreliminaryanalysis,
we
estimated theparametersoftheproductionfunction,includingterms thatallowedfor differential productivityunderrestructuring.Those
resultssuggestedproductivity gains associatedwithrestructuring.
The
work
reportedhereimposes anadditionalconstraint,based oncost-minimization,toestimate input
demand
functions,andisolatepossiblerestructuring effects
on
eachmeasured
input.A
cost-minimizingplantmanager,facingwages
W
lt andmaterial pricesS;t ,would
solvefortheoptimal inputstoproduce probableoutputQjtP by:
13
Infact,overa shorttimeperiod,maintenance andrepairexpenditureswillbeinverselyrelatedtooutput sincetheboilerneedstobecoolandthe plantofflineformost major work.
We
dealwiththispotentialsimultaneitybiasbelow.
14
Theempirical analysis defines a
new
plant-epoch,/',wheneverthereare significantchangesincapacity, sothatwithineachplant-epoch, capacityisapproximatelyconstant.min
W,
,-Lj,+
Si t-Mi , s.t.&
t p<
Qo(K,)-(Lit) YL -(MjO^-expfe
t p ) Lj„M
ityielding the followingfactor
demand
equations:(LI)
L
it=
(X,Y L Qit P)/W
it(Ml)
Mi^^Q/yS;,
where
X,is theLagrangianontheproductionconstraint.We
observeactualoutput,Q
itA
=
Qit Peit
A
,ratherthan probable output,
Q
itp
.
Making
thissubstitution andtaking logsof bothsides,(LI)becomes:
(L2) ln(Lit)
=
oo+
ln(Qit A )-
£it A-ln(
W
;, )where
oto=
ln(X.yL). Iftherearedifferences acrossplants,overtime,or across regulatoryregimesinthecoefficientsoftheproductionfunction(yL)orinthe
shadow
valueoftheprobableoutput constraint (X),orifthereismeasurement
error inlaborusedattheplant,thisequationwillhold witherror.As
we
areparticularly interested inchangesininputdemand
associatedwith restructuring,we
expand
the subscriptitto irttoinclude plantiinyear/,and
regulatoryrestructuringregimer, andre-write(L2)as:
I5 (L2') ln(Lirt)
=
ln(Qirt A)-ln(W
irt)+
ai L+
5t L +cpr L-
Eirt A+
Eirt Lwhere
a; Lmeasures aplant-specific
component
oflabordemand,
5,L
captures year-specific differencesinlabor
demand,
cprL
capturesrestructuring -specific shiftsinlabor
demand,
andEirtL measurestheremainingerrorinthelabor inputequation.
a
isnow
subsumed
intheplant-specificdemand,
a;L
.
Note
that<prL
picks
up
mean
residualchangesin labor input fora plantina restructuredregimerelative to that plant overallandtoallotherplantsatthesame
pointintime. Itcouldreflectsystematicchangesinthemarginalproductivity oflabor(yL), intheshadow
valueoftheavailabilityconstraint(X)orinoptimizationerrors.I6
15
Notethat
many
plant-leveldifferences,suchas capital stock,andmany
time-varyingshocks,suchastechnology-neutral productivity shocks,dropoutofthisequationthroughthe conditioningonoutput choice.
16
Ifthereweresystematic differencesinthe relationof probable andactualoutput acrossrestructuring,yr L
may
also reflectthechangeinmean
£irt . Since e^
reflectsshocks unobservablebythefirmwhen
settingplannedoutput, itseemsplausiblethatthesebe
mean
zeroinexpectation,buttheirrealizationscould be nonzerointhe restructuringsample
we
observe.Similarly, equation
(Ml)
becomes:(M2)
ln(M
irt)=
ln(Qrt A )-
ln(Srt)+
a;M
+
5tM
+
q>rM
-£irt A
+
£ „tM
which
isdirectlyanalogousto(L2').We
model
theenergycomponent
oftheLeontief productionfunction,which
will ingeneralholdwithequality, as: (PF2)
Q
irt A=
g(Eirt,Y E ,£ E )Assuming
that g(«)ismonotonicallyincreasinginE,we
can simplyinvertittogetanexpressionfor
E
intermsof Q.Note
thatthe priceoffueldoesnot enterintothedemand
forfuelexceptthrough thelevelofoutput the plantisdispatchedtoproduce. Forconsistencywiththe other inputspecifications,
we
specifya log-logrelationship:(El) InCEirt)
=
yQ E -ln(Qirt)+
cpr E+
a, E+
5E+
£irt Ewhere
asbefore,theplant-specificerror, OjE the year-specificerror, 5tE
,andthe restructuring-specific term,cpr
E
,capture systematicchangesinthe efficiencywith
which
plantsconvert energyto electricity—
thatis,changesinplantheatrates—
across plants,overtime,or correlatedwithrestructuringactivity,respectively.
We
confronttwo
importantendogeneity concernsinestimating the basic inputdemand
equations,(L2'),
(M2)
and(El).The
firstisthepossibility thatshocks(£irtL
£in
M
,£in E
) inthe input
demand
equationsmay
becorrelatedwithoutput. Ifoutput decisionsaremade
afteraplant'smanager
observestheplant's efficiency,
managers
may
increaseplannedoutputin responseto positive shocksto aninput'sproductivity, orreduceplannedoutputinresponsetonegative shocks. This behaviorwould
inducea correlationbetween
the errorinthe inputdemand
equationand observedoutput.
Though
one cancontroldirectly forplant-specificefficiency differencesandforsecular productivityshocksinagivenyear,idiosyncratic shocksremain asourceofpossiblebias. Second,theestimatesmay
besubjecttoselection biasifexitdecisionsaredrivenby
unobservedproductivity shocks. Inthiscase,negativeshocks couldleadtoplantshutdown, implyingthatthe
errors forobservations
we
observewillbedrawn from
a truncateddistribution. Neitheroftheseproblems isuniquetooursetting, andtheyhave beenraisedin
many
earlierpapers.17Considerfirstthesimultaneity issue.
We
faceapotentialsimultaneityproblem if,for instance,amalfunctioningpieceof equipment reducestheplant's fuel efficiency, leading theutilityto reduceitsoperationofthatplantand consequentlytouselessfuel. There
may
bedeviationsfrom predeterminedemployment
andmaterials budgetscausedby
unanticipatedbreakdowns
thatrequireincreaseduseoflaborandrepairexpendituresandresult inloweroutput.
A
positive efficiency shocktoaninputmay
leadmanagers
torunthatplantmore
intensivelyovertheyear,increasingoutputaswellasinputuse.
A
varietyofmethods
havebeen usedtoaddressthisconcern.18
We
choosetouse aninstrumental variablesapproach,using ameasure
ofstate-level electricitydemand
asaninstrumentforplant output. Thisis likelytobehighly correlatedwiththe
amount
ofoutput a plantwillbecalledto provide,but uncorrelated,for instance,withhow
efficientlyanindividualplant'sfeedwater
pumps
areworking. This approachislikely tobe particularlyeffective fortheenergy equation,giventheresponsivenessof energyinputchoicestodemand
fluctuations in realtime,andforidentifyingexogenous
output fluctuationsatnon-baseloadplants,
which
aremore
stronglyinfluencedby marginal swings indemand.
Itmay
be lesspowerfulinidentifying variationinexantelaborand maintenancechoices, dependinginpart onthe extenttowhich
plantmanagers
anticipate statedemand.
19We
thereforeexplore thesensitivityof ourresultstoalternativeinstruments.
The
potentialselectionissueismore
difficulttoaddress.The
plantsinoursampleseem more
stablethan those studiedin
many
othercontexts (especially seeOlley andPakes, 1996), suggestingthatthe selectionproblem
may
besomewhat
lesssevere for electricgeneration.However,
plantexitincreases inrestructuringregimes, typically notbecausethe plantisretiredbutbecausedivestitures
remove
theplantsfromthereporting database.To
theextentthatthedivestituresare
mandated by
the restructuringlegislation,thisshouldnot createselectionproblems. But withoutbetterinformation
on what
determinesdiscretionarydivestitures,we
have17
Nerlove (1963)providesanearlydiscussionofsimultaneity biasinproductionfunctions. Olleyand Pakes (1996) propose astructuralapproachtoaddressing simultaneity,whichiscomparedto alternatives in
Grilichesand Mairesse(1998). Ackerberg andCaves(2003)discussthisissueandcomparetreatments
proposed by Olley and Pakes (1996) and Levinsohn andPetrin (2003). While
many
papershaveestimated productionorcostfunctionsfor electricgeneratingplants,fromtheclassicanalysesinNerlove(1963)andChristensen andGreene(1976)toveryrecentworksuchasKleitandTerrell(2001) andKnittel (2002),
electricity industrystudies typicallyhavenottreated eithersimultaneityorselectionproblems.
18
Seethereferencescited innote 17, supra.
19
A
furtherdrawbackto thisinstrumentisthatwe
measuredemand
onlyatthestate, ratherthan plantlevel,whichmeansthat
we
donotuse the cross-plant variation within astatetoidentifyoutputcoefficients.no direct
way
toassesstheirimpacton
theresults.One
indirectway
toassess thesignificanceof potential selectioneffectsistocompare
resultsfortheunbalancedpanelwe
useinmost
of ourwork
tothosefora panelofplants thatcontinuetooperatethroughtheend
of oursampleperiod,for
which
potentialselectioneffects are likely tobemost
severe. Substantial differences acrossthoseresults
may
suggest theneedtomore
carefullytreatpotentialselection biases.Identificationstrategy
There issubstantialheterogeneity acrossplants,utilitiesandstates,
and
theeconomic
environmentin
which
utilitiesoperatehaschanged
considerablyovertime. Inaddition,restructuring isnot
randomly
assigned acrosspoliticaljurisdictions—
earlierwork
suggeststhatitisstrongly correlatedwithhigher thanaverageelectricityprices inthecross-section.20
Fortunately,
we
haveinthissectoradatabaserich in variation. Therearethousands ofgenerating plantsoperatedby
hundreds ofutilitiessubjecttoregulationby
dozensofpoliticaljurisdictions eachsetting theirown
legaland
institutionalenvironment. Paneldataon
thecostsand
operationsofthese plantsare available,with
some
recentexceptions,fromwellbeforeanyrestructuringuntilthepresent.21 Thisallows ustoconstruct
benchmarks
thatwe
believe controlformost
ofthepotentially confoundingvariation.
The
plant-specific effects, {oiiN
},measurethe
mean
useofinputN
atplant;relativetoother plantsinthe sample.These
effectsmay
beassociatedwithdifferencesinplanttechnology type andvintage,ownership(governmentv.privateutilities),andtime-invariantstateeffects.The
year-specificshock, {5t
N
},measuresthe efficiency impactofsector-levelshiftsovertime,suchas
seculartechnologytrends,
macroeconomic
fluctuationsorenergypriceshocks. Restructuringeffectson plantproductivitycorrespondtoa non-zero{(pr
N
}.
The
heterogeneity inthetimingandoutcomes
ofstate-levelrestructuringactivity allowthe datatodistinguishbetween
temporalshocks andrestructuring effects.
While
allstates held hearingson
possiblerestructuring,theearliest
was
initiated in 1993andthelatestin 1998. Thereisconsiderablevariationintheoutcome
ofthose hearings,as well,withjustunderhalf thejurisdictions(23 statesandtheDistrictof
Columbia)
enactingrestructuring legislationbetween
1996and 2000.22The
remainder20
Thesignificant roleofsunkcapital costs inregulatoryratemakingmeansthathighpricesdonot necessarily imply highoperatingcosts forgenerationfacilitieswithin astate,however. SeeJoskow(1997)
foradiscussionofthe contributorstopricevariationacrossstates.
Costdata are not publicly availableforplants
owned
byexemptwholesalegenerators,includingthose acquiredfromregulatedutilities.22
We
collectedinformationonstaterestructuringlegislationfromvariousEnergyInformationAdministrationandNational Associationof RegulatoryUtilityCommissionerspublicationsandstate
considered
and
rejected,orconsidered and simplydidnotacton, suchlegislation. Thisvariation allows ustouse changesinefficiencyatplants in states thatdidnot pass restructuringlegislation to identifyrestructuring separatelyfrom
secularchangesinefficiencyofgenerationplantsovertime.
Itispossiblethatplantsinthiscontrolgroupalsoaltered theirbehavior overthe post-1
992
period. Thiscouldbe
due
perhapstothe introductionorintensificationofincentive regulation withinstatesthatdid notenactrestructuring, tothe expectationofpotentialrestructuringthatdid not occur, orspilloversfromrestructuringmovements
inotherstates(e.g. ifregulators updated theirinformationaboutthecostsnecessarytorunplantsofacertain type, ormulti-stateutilitiesoperatingunderdifferingregimes
improved
efficiencyofalltheir plants,notjustthoseinrestructuringstates).
To
theextentthisoccurs,our comparisonwillunderstate themagnitude of any efficiencyeffectofrestructuring.We
thereforeconsider asecondcontrolgroup, consistingof cooperatively-ownedorpublicly-owned
municipaland federal plants,which
forconveniencewe
will refer toas"MUNI"
plants,althoughthegroupisbroaderthanstrictly implied
by
this label.An
extensiveliteraturehasdebatedtherelativeefficienciesofprivate andpublicownership in thissectorundertraditional regulation,with
somewhat mixed
results.We
abstractfrom
thatby allowingforplant-specific effects thatabsorbanylevelsdifferencesininputuse acrossownershiptype. Restructuring generallyalteredthe competitiveenvironmentonly forprivateinvestor-ownedutilitieswithin astate,leaving thoseforpublicly-and cooperatively-ownedutilitiesunchanged.23 Thissuggests
that
MUNIs
may
provideasecondbenchmark
againstwhich
tomeasure
changesinefficiency associatedwithrestructuring.We
adopta parameterizationthatmeasures {cprN
} relativeto publicly-ownedplantsduring the periodthatinvestor-ownedutilitiesareatriskofrestructuring,
definedas 1993 forward.
Using
N
todenoteinput(labor,nonfuelexpenses, orfuel),andPRICE
N todenotethe relevant input price(noneforthefuel equation),we
haveinput use equation11 : (11) ln(Nirt)=
ln(Qirt A )-\n(PRICE
N in)+
yMUNI
it+
a, N+
5t N+
<pir N-eirt A
+
e,rt Npublicutilitycommissionwebsites. Since 2000,noadditionalstateshave enactedrestructuringlegislation,
andseveralhave delayedorsuspendedrestructuringactivity inresponsetotheCaliforniacrisis.
Withtheexception ofArizonaand Arkansas,whichincludedgovernment-ownedutilities inrestructuring
programs.
This specificationimplicitlyprovides
two
"non-treatmentgroups"towhich
investor-owned plantsinrestructuringregimesmay
be compared: investor-ownedplants innon-restructuringregimes (with the restructuringeffect
measured
by
cprN
),andpublic-and cooperatively-owned
plantsover 1993-1999(with the restructuringeffect
measured
by
cprN -y).
3.
Data
&
Summary
StatisticsThe
analysisin thispaperisbasedon
annualgeneratingplant-level dataforU.S.electricutilities.Plantsarecomprised ofatleastone,buttypically several, generatingunits,
which
may
beadded
toorretiredfromserviceoverthe several-decadelifeofatypical generatingplant.
While
an idealdatasetwould
allowustoexplore efficiency atthegeneratingunitlevel, inputsotherthan fuelarenot availableatthe generatingunitlevel,and some, suchasemployees,arenotevenassignedtothe unitlevelastheyaresharedacrossunitsattheplant.24
We
thereforeuse aplant-year asanobservation.
The
FederalEnergy
RegulatoryCommission
(FERC)
collectsdataforinvestor-ownedutilityplantsannually inthe
FERC
Form
1, andtheEnergy
InformationAdministration(EIA)
and RuralUtilities Service
(RUS)
collectsimilardataformunicipally-ownedplantsandrural electriccooperatives,respectively.
These
dataincludeoperatingstatisticssuchas sizeoftheplant, fuelusage,percentageownershipheld
by
theoperatorandotherowners,number
of employees,capacityfactor, operatingexpense,yearbuilt, and
many
otherplant-level statistics.Our
basedatasetincludesalllargesteam and
combined
cyclegas turbine(CCGT)
generating plants forwhich
data
were
reportedtoFERC
orEIA
overthe 1981 through 1999period.25We
excludedsmallerplants,definedasthosefor
which
gross capacityexceeded 100megawatts
forfewerthan threeofoursampleyears.
We
alsoexcluded approximately 1,500 observationswhere
datawere
missing,anddroppedseveralhundredobservationsbasedonregression diagnosticteststoscreenfor outliersor
undue
influence. FurtherdetailsonthedataareprovidedintheAppendix.We
follow the literature incharacterizingoutputbythetotal energyoutputofthe plantovertheyear, measured
by
annualnetmegawatt-hours ofelectricitygeneration,NET
MWhs.
Thisisanimperfect choice. Outputis, in reality,multidimensional,although
most
dimensions arenot24
Some
labormay
beshared across multipleplants,thoughassignedtooneparticularplantinourdata.Thiswillleadinducemeasurementerror,particularly intheplantemploymentvariable.
25
One
unfortunateconsequence ofrestructuringisthatavailabledataonplantssoldbyutilitiesto non-utilitygenerators areextremelylimitedafterthesale,duetochangedreportingrequirements. Thismeans thatplantswill be excludedfromthe datasetaftersuchsales.recorded inthe plantdata. For example,generating plants
may
alsoprovidereliabilityservices (such asspinningreserves,when
the plant standsreadytoincrease outputatshortnotice), voltage supportand
frequencycontrol.While
theproductionprocess varies considerably across thesedifferentoutputs,onlynet generationiswell
measured
inthedata.26 Moreover,electricityoutput isnot ahomogenous
product.Because
electricityisnon-storable,electricityproducedat5PM
on
thefirstFridayinJulyisa separateoutputfromelectricityproducedat
5AM
onthesecondSunday
inMarch. Firmsmust
decidehow
tobalancethecostsassociatedwithtakingtheirplantdown
todo maintenanceagainstthe probabilitythata poorlymaintainedplantwillfail duringpeak
demand
hours,and
theavailabilityoftheplantmay
be an important modifier ofoutputquality.
Changes
in incentivesassociatedwithrestructuringmay
have alteredfirms' assessments ofthesetradeoffs, althoughtheexpecteddirectionoftheeffectsistheoreticallyambiguous.27 Hourlyoutput pricesand
outputfrom
individualplantsmight allowustobetterassessthis. Lacking suchdata,we
relyon
asingleoutputdimension,butacknowledge
its limitations.We
haveinformationon
threevariableinputs.The
first,EMPLOYEES,
isacountoffull-timeemployees
attheplant.The
second,NONFUEL
EXPENSE,
includesallnon-fuel operationsandmaintenanceexpenses,suchasexpenses forcoolants, maintenancesupervision
and
engineeringexpenses. Thisvariableis lessthanidealasa
measure
ofmaterials,bothbecauseitreflectsexpendituresratherthanquantities,
and
becauseitincludes thewage
bill fortheemployees
countedin
EMPLOYEES,
althoughthatexpenseisnot separately delineatedinourdata.As
NONFUEL
EXPENSES
includes payrollcosts(notseparatelyidentified),boththisandEMPLOYEES
will reflectchangesin staffing. 28The
thirdinputisfueluseby type offuel(tonsof coal,barrelsofoil,andmcf
ofnaturalgas).We
convertfuel intoBTUs
using the reportedannual plant-specificBtu
contentof eachfuel toobtaintotalBTU
inputatthe plantforeachyear.Inputpricespose achallenge.
Wages
inparticularmay
beendogenous
tothefirmandits perceived regulatoryenvironment. Hendricks (1975) suggeststhatutilitiesmay
bargain less 26Theinputsrequiredtoproduceagivenlevelof energy
(MWh)
from aspecificplantalso willdepend on whethertheplantrunscontinuouslyor intermittentlyandonitsaveragecapacityutilization. Startingaplant frequently and runningitatlowcapacityutilizationratestypicallyusemoreinputs(particularly fuel)
per
mwh
generated thandoes running aplantcontinuouslyatitsratedcapacity.27
Forinstance,undertraditionalregulation,utilities
may
havefaced strongpoliticalincentivestoavoidblackouts orbrownouts,leadingto investmentingreatercapacityto increase reservemarginsandingreater
maintenanceresourcesto increase plantreliability.
On
theotherhand,competitive firmsproducing inrestructuredwholesale markets
may
faceevenstronger incentivestobeavailablewhen demand
peaks becausethisiswhen
pricesare highest.28
Theelasticityof
NONFUEL
EXPENSES
withrespecttoEMPLOYEES
isabout.5inourdata,broadly consistentwithourbackoftheenvelopecalculationssuggestingthatlabor costs areroughlyhalfofthe totalnonfuel operating budget.aggressivelyoverinputpricessuchas
wages
during periods inwhich
highercostscould bereadilypassed
on
to customers throughhigher regulatedprices,andmore
aggressivelywhen
the firmwas
likelytobethe residualclaimanttocost savings. Inotherindustries,regulatoryreformhassometimes beenassociatedwithsubstantialreductionsinwages,suggesting rent-sharing
underregulation(seeRose, 1987,
on
thetruckingindustry). Thesesuggestthatobservedwages
may
notbeexogenous
tothefirm,andmay
notreflectthe opportunity costtomanagers
ofthemarginalunitoflabor.
We
addressthisby
usingstate-levelaveragewages from
industrieswith workersofsimilarskillsandtraining topower
plant operators, including natural gasdistribution, petroleumrefiningand hazardous wastetreatmentfacilities,denotedasWAGE.
Thisreflectsopportunitywages, andavoidsconfoundingthe
employee
pricemeasurement
withany changesin recordedwages
duetochanges inlabor force compositionat utilities associatedwithrestructuring orchangesinwage
bargaining.We
do nothave plant-oreven firm-specificindicesforthe materials pricesthatcompriseNONFUEL
EXPENSES.
Our
empiricalmodel
ofNONFUEL
EXPENSES
thereforecorrespondstoaninputdemand
equationwithconstantpricesanda pricecoefficientofone.
The
finalinputisthecapitalstockoftheplant,which
we
measure byplantcapacityandvintage.Our
datarecord the plant capacityinmegawatts.We
combine
thiswith informationon
unit retirementstodefine plant-epochs.Each
plantis assigned auniqueidentifier.Any
timethe capacityofthe plantissignificantlychanged,or thereisanidentifiable unitadditionorunitretirement,
we
createanew
identifierandassociatednew
plant-specificeffect. Thisallowscapitalchangestoaltertheunderlyinginput efficiencyoftheplant.
We
include controlsfortwo
other plantcharacteristics thatmay
varywithinplant-epochand leadtochangesin inputuse.
The
firstisplantAGE
inyears,datedfromtheinstallationdateofthe oldestoperatinggenerating unitattheplant: as plantsagetheymay
become
lessefficientor require additional inputsforagivenlevel ofoutput.The
secondisthe additionofa flue-gas desulfurizationsystem, orFGD
(also calledscrubber),toreducesulfur-dioxideemissionsinsome
coal plants.
FGD
affectstheenvironmentaloutput,unmeasured
by\n{NET
MWhs).
We
supplementthe operational plant datawith information onstate-levelrestructuringactivity. For each state,we
have identifiedthedateatwhich
formal hearingson
restructuringbegan, theenactmentdatefor legislationrestructuringthe state'sutilitysector, ifany, theimplementation
dateforretailaccess underthat legislation,and
some
associated aspectsofrestructuringsuchasratefreezes
and
mandatorydivestitureofgeneration. Testingforrestructuring-specificshocksrequiresa determinationof
how
tomatch
thisinformationwithfirm decisions:when
were
plant operators inagivenstatelikelytohavebegun
respondingtoapolicychange? Consultationswithindustryparticipants
and
readingsoftheseeventssuggestthatutilitiesoftenactedinadvance of finaloutcomes.The
legislativeandregulatoryprocess leadingup
to staterestructuring typicallylasteda
number
ofyears,allowingutilitiesto anticipatethecoming
change,and
altertheir behaviorinadvance. For example, Boston Edison's10-K
filedinMarch
1994discussedMassachusetts'considerationofrestructuring, stating
"The
Company
isrespondingtothecurrentandanticipatedcompetitive pressurewitha
commitment
tocostcontrol andincreased operating efficiencywithoutsacrificingqualityofserviceorprofitability"(p. 6).29
Utilities
may
havebegun
tophaseininputchanges, especially those involving laborandparticularly unionizedworkers. Moreover,aspolicychanges
were
discussed,rateswere
frozeninmany
states,either explicitlyby
policymakers
orineffectby
implicitPUC
decisionsnottohearnew
rate cases,enablingutilitiestocapture thesavingsfromincremental cost reductions.30
In thiswork,
we
allowrestructuring effects tobeginwiththeopening of formalhearingson
restructuring.
The
primaryvariableofinterest,RESTRUCTURED,
isanindicatorvariablethatturns
on
withthestartofformalproceedingsina statethateventuallypassedrestructuringlegislation.
31
A
secondvariable,RETAIL
ACCESS,
indicatesthestartofretailaccessforplants inthe fourstates that
implemented
retailcompetitionduringthesample.32 Table 1 reportsthenumber
ofplants inour databaseeach yearthatwere
in states thathad
RESTRUCTURED
and
the29
Ina 1993articleoutlining
PECO's
costsavingaccomplishmentsandstrategiesforthefuture,Chairmanand
CEO
Joseph Paquettediscussed restructuringoftheutilityindustryandwasquotedas stating,"we
have beenfocusingonourstrategicplanstoenhance ourabilitiesto satisfyourcustomer needs by
becomingmorecompetitive."
PECO
initiativescited inthearticleincludedimprovingthe cost effectivenessofalloperations.One
particularaccomplishment notedwasthereductionintotal employment from 18,700to 12,900.30
As
notedearlier,someofthese changesmay
havealsoaffectedutilitiesinnon-restructuringstates. For example,thenumberofutilityratecasesdroppeddramaticallyinthe 1990s,implyingthatmany
ormost utilitiesmay
have beenshort- ormedium-runresidual claimantstocostreductions. Knittel(2002)identifiesanumberofincentive regulationsadoptedinvarious jurisdictions during the 1990s.
Many
ofthefuel-relatedregulations(modifiedpass-throughclauses,heatrateandequivalentavailabilityfactor
incentiveprograms)werestrongly correlatedwithultimaterestructuring.
Some
ofthebroaderregulations (e.g.,pricecapsand revenue decoupling programs)werealmostorthogonaltoeventualrestructuring.31
The
RESTRUCTURED
variableisbasedon whetherastatehad passedlegislationasofmid-2001, althoughintheaftermathoftheCaliforniaelectricitycrisis,therehasbeennoadditionalrestructuring,andsomedelays orsuspensionof plannedrestructuringactivity.
32
While
RESTRUCTURED
indicatesapprovalofretailaccesslegislation,thespecifiedphase-inofretail accesswasoftenslow. Onlyfive statesimplementedretailaccessduringoursampleperiod: RhodeIslandin1997,California,Massachusetts,and
New
Yorkin 1998,and Pennsylvaniain 1999(U.S.EIA,2003). Becausewe
have novalidobservationsonRhode
Island plants in 1997orbeyond,retailaccesseffectswillbedeterminedbythe4states implementingin 1998or 1999. Divestiturerequirementsin Californiaand
Massachusettsfurtherreducesthepost-retailaccesssample ofplants, asinvestor-ownedplantsinthose
stateswerelargelydivestedby 1999.
number
ofplantsinstatesthathadstartedretailaccess by 1999.33 Ifutilitiesdidnotresponduntilrestructuringlegislationor regulation
was
enactedandthepolicy uncertainty resolved,RESTRUCTURED
willunderestimatethetrue effectby
averaginginnon-responseyears.To
evaluatethispossibility
we
introduceathirdvariable,LAW
PASSED,
anindicatorequaltoone beginningintheyearthestatepasses restructuringlegislation.34 Similarly ifactualimplementation ofretailaccess andtheassociatedwholesalemarket reforms isimportantto
efficiencygains,itwillbereflectedinanincrementaleffectof
RETAIL ACCESS. To
examine
municipally-ownedplantsoverthe restructuringtimeperiod,
we
define the variableMUNI*POST
1992,equaltooneforallmunicipally-ownedplants
from
1993, thefirstyearforwhich
RESTRUCTURED
isone,through 1999.The
finalcolumn
reportsthenumber
ofplants in thiscategory.
Detailsonthedatasources
and
summary
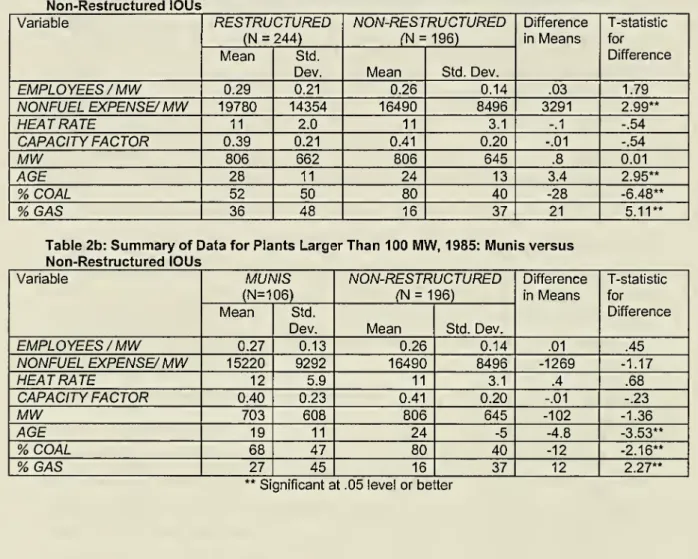
statisticsareprovidedinthe appendix. Tables2aand
2b
reportsummary
statistics forplant-leveldatain 1985across threecategories: investor-ownedplants instatesthatlaterrestructure,investor-ownedplantsin states thatdonotrestructure,
and
non-IOU
plants.We
choosethisdatetoensurethatcomparisonsaremade
prior toany
significantchangesacrossstates inthecompetitive or regulatoryenvironment,evenprior torestructuring
initiatives.
From
thesetables,itappearsthattheplants fromthesegroupsarenotrandom
drawsfrom
thesame
population.The
firstthree variablesmeasure employees
andnon-fuel operating expenses, scaledby
theplant'scapacity,and
fuel useinmillionsofBritishthermalunits(mmBtus),
scaledbytheplant'soutput. In 1985, beforestate-levelrestructuring initiativeswere
considered,plants in states thateventually restructuredhadhigherintensitiesof
employees
andnon-fueloperatingexpenses,althoughthe differenceissignificantonlyfornon-fuelexpenses.
The
firsttwo rows
inTable2b
show
thatmunicipally-ownedplantshadsignificantlyhigheremployment
andnon-fuel input use thanplants innon-restructuring states.The
differences inheatrates andcapacityfactors arenotsignificantin eitherofthe tables.
The
lastfour variables in bothtablesdescribe the stockofplants inthetwo
typesofstates.Although
plants areverysimilarinsizeacross IOUs,
MUNIs
plants areconsiderablysmaller.IOU
plantsinrestructuring33
Forthetablesandthe regression analysisthatfollows, plants areassignedtothestate inwhichthey are regulated.
A
plantlocatedinonestatemay
beowned
byacompanywithexclusive serviceterritory inadifferentstate,andthatsecondstateisthestatebywhichtheregulatorypolicyismeasured.
Some
plantsare
owned
byacompanywithserviceterritoryinmorethanonestateandsome
plants areowned
byseveralcompaniesthatareregulatedbydifferentstates.Intheregression analysis,
we
foundthatseparately characterizing"mixed"regulationand "shared"plantshad very littleimpactonourresults.34
Thereisonaverageabouta 2.6-yearlagbetweentheinitiationofhearingsandthepassageofthe law.
We
have experimented withanumberofalternativemeasures ofrestructuringactivity,including variablesthatbegin withhearings regardlessofrestructuringoutcomes,thosethatmeasureyears since hearingswere
statestendedtobeolder,
more
likelytousegas, andless likely tousecoal,thanIOU
plants innon-restructuringstates.
MUNI
plantstendedtobe younger, less likely tousecoal,andmore
likely tousegas,than
IOU
plantsin non-restructuringstates.The
regression analysiswillcontrolforthese differencesdirectly orwiththeuseof plant-epocheffects.
Ifinvestor-ownedutilitiesachievedefficiency
improvements
when
facingimpending
restructuringofthe generationsector,one
would
expecttoseearelativedecreaseinthe costofgenerationforaffectedcompanies, andlittledifferenceinthechangeintransmissionand distributioncosts
between
the affectedandnot affectedstatessince restructuringprogramsleave transmissionand
distribution comparatively untouched. Ifrestructuringdidnotaffectoperating efficiencyinthegenerationsector,we
mightexpecteither (1)thechangeingenerationexpenseswould
notbestatisticallydifferentbetween
restructuringand
non-restructuringcompanies,or(2)we
would
see thesame
patternof changeincostsforthetransmissionanddistributionsectors asforthegenerationsector.35
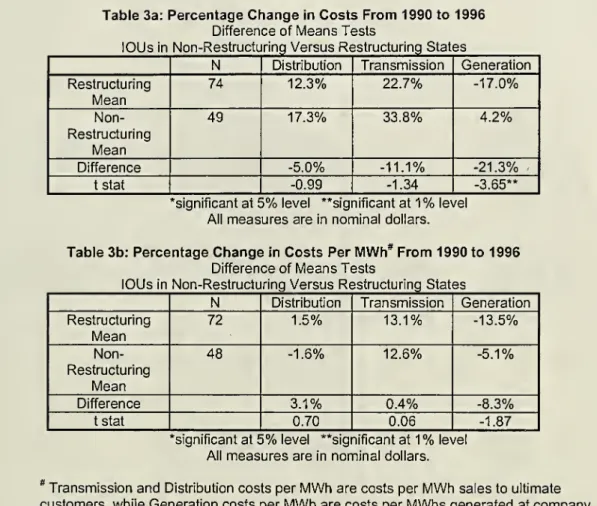
Table3a
and
3b
display the differenceinmean
tests forinvestor-ownedutilitiesinrestructuringandnon-restructuring statesforachange incosts
between
1990and 1996.Table 3areportsthepercentage
change
intotalcosts foreachcategory ofcost,and Table3b
reportsthepercentage changeincostsperMWh.
The
largerdecreaseingenerationcostsatrestructuringcompanies
is significantatthe1%
level,andtheresult forgenerationcostsperMWh
issignificantatthe6%
level.
The
difference incosts forcompaniesinrestructuringandnon-restructuringstatesisnotsignificant for eitherthetransmission ordistribution costs.
These
aggregatestatisticsprovidepreliminarysupportfortheexpectationthattheportionoftheutility
company
facedwith competition(thegeneratingsector)responded witha decreasein costs,whileother sectorsand
companies
notfacedwith competitiondid notsharethisresponse.4.
The
EffectsofRestructuringon
InputUse
initiated for statesthateventuallyrestructured,andthepresenceofrestructuring-associatedratefreezes.
None
oftheseseemtochangemateriallytotheconclusionswe
drawbelow.35
Fortheanalysiscomparingcostsofgeneration,transmission,anddistributionservices,
we
relyondata reportedannuallybyutilitycompaniestotheFederalEnergy RegulatoryCommission(FERC)
intheFERC
Form
1,page320,321,and322respectively.We
use abalancedsamplecomposedofallcompanies with data reportedforallthree sectorsinboth 1990 and1996. Thisamountsto49companiesin statesthatdid notderegulateand74instatesthatdidderegulateforthecomparisonofcosts,and 48and 72respectivelyforthecomparison ofcostsper
MWh.
UsingcostsperMWh
necessitatestheexclusionofafewcompaniesforwhich
MWh
datawasnot availableinone ofthetwoyears.Following equation(II),
we
estimatetheinfluenceofrestructuringon
theuseofinputN
(EMPLOYEES,
NONFUEL
EXPENSE,
andBTUs)
withthefollowing basic regressionmodel:(Rl) ln(Nirt)
=
^
n\n(NETMWh
M
)+
tfhiQPRICE"*
)+
&A
GE
ilt+
fak
FGD
ilt+
(pr NIOU*RESTRUCTURED
+
yMUNI
1993.m9
+
Oj N+
5t N+
p\ N slrt A+
eirt Nwhere
we
allowfornon-unitycoefficientsontheoutputterm(PiN
)forallequationsand
on
the input priceterm(p2N
on
WAGE)
intheEMPLOYEES
equation,36 andinclude controlsfortwo
important plantcharacteristics thatvaryovertime:
AGE
andFGD
(scrubber). otjN
isa
time-invariantfixedeffect forinput
N
atplant-epochi,which
may
containastate-specificandownership-specificerror that willnotbeseparately identified. Theseplant-specificeffects
controlfor
much
oftheexpectedvariation ininputuseacrossplants arisingfrom heterogeneoustechnologies,stateorregional fixedfactors,andbasic efficiencydifferences.
They
alsocontrolfordifferencesinthe plant
mix
betweenrestructuringandnon-restructuringstatesby comparing
eachplanttoitselfovertime,
removing
anytime-invariant planteffects.As
aHausman
testrejectstheexogeneityofplanteffects, allreportedresultsincludeplant-epochfixed-effects.37 5t N
isanindustry-leveleffectinyeart,
which
controlsforsystematicchangesininputdemand
across allplantsovertime.£irt
N
is
assumed
tobeatime varyingmean
zeroshock forinputN
atplant-epochi inregimer attimet. Thisshockis unlikelytobe independent over timeforagivenplant. Thereis likely tobe
persistencein inputshocks,particularly for labor,
from
yeartoyear. Indeed,estimated rhosbasedon
assumed
first-order serialcorrelationareinthe .65rangeforlabor inputsandinthe.33 rangefornon-fuel expenses. Itisunlikelythatthe correlation isassimpleasafirst-orderautogressive process,however.
The
physicaloperationofpower
plants islikelytoinducesome
correlationatlongerdifferences. For example,routinemaintenancecycles
may
involvescheduled shutdownsbutincreased laborandnonfuelexpenses everythreeorfouryears.
We
have exploredGLS
specificationsbasedon an assumption offirst-orderautoregressiveerrors, andtheresultsarequite similartothose reportedinthetablesbelow. Ratherthan
impose
thisassumption, however,
we
choosetoestimatethemodel
withoutaGLS
correction, and simply 36Recallthat
we
donothave apriceassociatedwithnonfuel expenses,andthataccordingtoequation (El),fuelpricesshouldnot enterintothefuelinput function.
We
experimented withusingavariablemeasuringthepriceofagiven plant's fuel relative tothepricesofotherfuels inthesameregionasaninstrumentfor
output but the variablehadno powerinthefirststage.
37
ThisuseoffixedeffectsissimilartotheworkofJoskowand Schmalensee(1987),
who
usedgeneratingunit-leveldatatoexplore the relationshipbetweenoperatingperformanceandunit characteristics. Our
report standarderrors thatare correctedfora general patternofcorrelationover timewithina
givenplant.38
Inputuseover timewillvary withthe levelofplantoperation,
which
ismeasured
inthese specificationsasthe net generationby
theplant inmegawatt-hours(NET
MWh).
We
treattheendogeneityand
measurement
problems describedearlierby instrumentingforoutput withstatedemand
(thelog oftotalstateelectricitysales, aconsumptionratherthanproductionmeasure).Thisinstrumentaffectsthe likelihoodthatagivenplantinthestate willbedispatched
more
overtheyear,butis not influenced
by
the characteristicsofthe plantor thechoicesofindividual plant operators.We
consider specificationsthatincludeinteractionsofIOU
ownership withthe threeprimaryrestructuring indicatorvariablesdescribedinsection3:
RESTRUCTURED,
LA
W
PASSED,
and
RETAIL ACCESS.
Inthe input regressions,a negativecoefficientonthe restructuring variableswould
implyincreased input efficiency associatedwiththeregulatory reform.The
coreresultsfortheinput analysis are presentedinTables4for
EMPLOYEES,
5forNONFUEL
EXPENSES
and
6forBTU.
We
firstdiscuss theresultsforemployment
and nonfuelexpenses,andthen discuss theresultsfor fuel use.Column
1 of tables4and5reportsasimpleOLS
formulationthatexcludesanycontrolforoutput. In thiscolumn,
IOU*RESTRUCTURED
captures themean
differentialininputusefor investor-ownedplants in states thateventuallypass restructuringlegislation,measured
overthe periodfollowing thefirstrestructuringhearings,relative toIOU
plants innon-restructuringstates. This correspondstothemean
within-plantshiftin inputuse, independentofoutput.The
resultssuggeststatistically and economicallysignificantdeclinesininputs duringrestructuring.
Employment
declinesby almost6%
(2%)
andnonfuelexpensesdeclineby
almost13%
(2%),39relative to
IOU
plantsinregimesthathavenotrestructured. Controlling forplant outputreducestheestimatedimpactofrestructuringby
more
than one-quarter,thoughtheeffectsremainlargeandstatisticallydistinguishablefromzero (see
column
2 of eachtable),at-4%
(2%)
foremployment
and-10%
(2%)
fornonfuel expenses.40Measuring
restructuring effectsfromthefixedeffectsareactuallyfinerthanplant-level, as
we
permita,tochange withunitadditions or retirementsandothersignificantchangesin ratedplantcapacity.
38
Reportedstandarderrorsarecalculatedusingthe clusteroptioninStata.
39
We
use [exp(<prN
)-l]*100toapproximatetheimpliedpercentageeffectof
IOU*
RESTRUCTURED
oninputuse.
40
NotethattheCobb-Douglasfunctionalform assumptionsuggeststhatthe coefficientonoutputshouldbe
one,substantially largerthan thecoefficientsestimatedinthese regressions. If
we
imposethisconstraint,theeffectofrestructuringisestimatedtobepositiveandsignificant.