HAL Id: hal-00016130
https://hal.archives-ouvertes.fr/hal-00016130
Submitted on 23 Feb 2006HAL is a multi-disciplinary open access archive for the deposit and dissemination of sci-entific research documents, whether they are pub-lished or not. The documents may come from teaching and research institutions in France or abroad, or from public or private research centers.
L’archive ouverte pluridisciplinaire HAL, est destinée au dépôt et à la diffusion de documents scientifiques de niveau recherche, publiés ou non, émanant des établissements d’enseignement et de recherche français ou étrangers, des laboratoires publics ou privés.
Predicting tropical forest stand structure parameters
from Fourier transform of very high-resolution remotely
sensed canopy images
Pierre Couteron, Eric Nicolini, P. Paget, Raphaël Pélissier
To cite this version:
Pierre Couteron, Eric Nicolini, P. Paget, Raphaël Pélissier. Predicting tropical forest stand structure parameters from Fourier transform of very high-resolution remotely sensed canopy images. Journal of Applied Ecology, Wiley, 2005, 42, pp.1121-1128. �10.1111/j.1365-2664.2005.01097.x�. �hal-00016130�
Paper to be published in the "Methodological Insights" section of Journal of Applied Ecology
doi: 10.1111/j.1365-2664.2005.01097.x
Preprint version: 21 July 2005
Predicting tropical forest stand structure parameters from Fourier
transform of very high-resolution remotely sensed canopy images
PIERRE COUTERON,1,2 RAPHAEL PELISSIER,1 ERIC A. NICOLINI1 and DOMINIQUE PAGET3
1 UMR botAnique et bioinformAtique de l'Architecture des Plantes (AMAP), TA40/PS2, 34398 Montpellier Cedex 05, France;
2 Département d'Ecologie, Institut Français de Pondichéry, 11 St Louis Street, 605001 Pondicherry, India;
3 151, allée des Narcisses, 74120 Megève, France
Correspondence:
Pierre Couteron
Département d'Ecologie, Institut Français de Pondichéry, 11 St Louis Street, 605001 Pondicherry, India.
Couteron et al. - 12/12/05
Summary
1. Predicting tropical forests stand structure parameters from remotely sensed data has numerous important applications, such as estimating above-ground biomass and carbon stocks, providing spatial information for forest mapping and management planning as well as detecting potential ecological determinants of plant species distributions. As an
alternative to direct measurement of physical attributes of the vegetation and individual tree-crown delineation, we present a powerful holistic approach using an index of canopy texture that can be extracted from either digitized air photos or satellite images by means of the two-dimensional spectral analysis by Fourier transform.
2. We defined an index of canopy texture from the ordination of the Fourier spectra computed for 3,545 1-ha square images of an undisturbed tropical rain forest in French Guiana. This index expressed a gradient of coarseness vs. fineness resulting from the relative importance of small, medium and large spatial frequencies in the Fourier spectra.
3. Based on twelve 1-ha control plots, the canopy texture index showed highly significant correlations with tree density (R2 = 0.80), diameter of the tree of mean basal area (R2 = 0.71), distribution of trees into d.b.h. classes (R2 = 0.64) and mean canopy height (R2 = 0.57), which allowed us to produce reasonable predictive maps of stand structure parameters from digital aerial photographs.
4. Synthesis and applications. Two-dimensional Fourier analysis is a powerful method to obtain quantitative characterization of canopy texture, with good predictive ability on stand structure parameters. Forest departments should use routine forest inventory operations to set up and feed regional databases, featuring both tree diameter figures and digital canopy images with the ultimate aim to calibrate robust regression relationships and to derive predictive maps of stand structure parameters over large areas of tropical forests. Such maps would be particularly useful for forest classification and to guide field assessment of tropical forest resources and biodiversity.
Key-words: canopy texture, French Guiana, sub-metric images, two-dimensionalspectral analysis.
Couteron et al. - 12/12/05
Introduction
Retrieving tropical forests stand structure parameters from remotely sensed data is of primary importance for estimating global carbon stocks in above-ground biomass (Houghton et al. 2001; Grace 2004) as well as for obtaining large-scale information required by regional biodiversity studies or forest type classification and mapping (Tuomisto et al. 1995). Indeed, stand structure parameters such as tree density, basal area or canopy height not only allow predictions of forest biomass (e.g. Chave et al. 2003) but may also provide spatial information on potential determinants of plant species distributions (e.g. Couteron et al. 2003) such as the gap-phase regeneration stages (e.g. Riéra, Pélissier & Houllier 1998) or the variations in substratum conditions and soil fertility (e.g. Ashton & Hall 1992; Paget 1999).
Thanks to the various kinds of satellite or airborne remotely sensed data available predicting stand structure parameters over large areas with a spatial resolution of a dozen to several dozen meters seems to be nearly achievable, e.g. Landsat TM (Lu et al. 2004), SPOT (de Wasseige and Defourny 2002), Laser Vegetation Imaging Sensor (Drake et al. 2002), Synthetic Aperture Radar JERS–1 (Santos et al. 2002). It is, however, surprising that fine spatial resolution techniques capable of detecting small-scale variation in physical signals have only been of limited applicability for the study of tropical forest structure and therefore of limited use for both ecological research and operational management/conservation (Read 2003). In fact, small-footprint laser altimeters have proven to be of limited efficiency in dense tropical forests because of inconsistent ground returns (Nelson, Oderwald & Gregoire 1997; Dubayah & Drake 2000; Drake et al. 2003, but see Clark, Clark & Roberts 2004). Recent metric and sub-metre resolution optical data, such as IKONOS and QuickBird panchromatic images, have been mostly used in tropical forests for visual tree crown delineation (Asner et al. 2002; Read et al. 2003; Clark et al. 2004a; 2004b) although Asner & Warner (2003) used an automatic quantification of shadowing while Hurtt et al. (2003) reported preliminary investigations on automatic crown delineation. However, tropical foresters have more than half a century tradition of delineating and mapping forest types by visual interpretation of aerial photographs (see Tab.1 in Polidori et al. 2003) a practice that could be easily extended to modern very-high resolution (VHR) satellite imagery. Furthermore, air photos when digitized at metric spatial scales, have enabled numerical extraction of textural information in temperate forest (Sommerfeld et al. 2000) and semi-arid vegetation (Couteron & Lejeune 2001; Couteron 2002). Such techniques could such also be applied on satellite images.
The present paper aims to demonstrate that texture analysis of digitized air photos by two-dimensional Fourier transform (Mugglestone and Renshaw 1998), as adapted by
Couteron et al. - 12/12/05
Couteron (2002), is a valuable approach to characterizing tropical rain forest canopies and obtain reasonable predictions of tropical forests stand structure parameters.
Materials and methods
STUDY SITE
The study was conducted as part of the DIME “Diversité Multi-échelles (multi-scale diversity)” project, within an area of 65 km2 of undisturbed lowland evergreen rain forest, located at about 10 km east of the Petit-Saut reservoir dam in French Guiana (5°00'N,
52°55'W). A small river (Crique Plomb) running along a geological boundary divides the area into a hilly landscape (hilltops from 80 to 210 m a.s.l.) lying on sedimentary rocks (pelite) to the north, and the Montagne Plomb volcano-sedimentary massif that reaches its highest point at 332 m a.s.l. to the south (Delor et al. 2003). The varied geomorphology of the site results in contrasted textural aspects of the forest canopy, which are apparent on the aerial photographs. DIGITIZED AERIAL PHOTOGRAPHS
A set of black and white aerial photographs at 1:25,000-scale (n° 379 to 383, 397 to 401 and 456 to 460 of coverage 1992-GUF-91/250) were obtained from the Institut Géographique National (IGN, France). Each image was digitized into 256 grey-levels with a Nikon®
Scantouch 210 flatbed scanner, using a resolution of 600 dots per inch (dpi), corresponding to a pixel size of 1 m in the field.On images, the fully sunlit crowns of canopy trees appeared in white or light grey, while shadowed inter-crowns gaps were dark-grey or black. A monotonic relationship between grey-level scale and canopy height can thus be assumed as long as there is no substantial relief-induced shadowing. Contacts n°399 and 401 were separately submitted to spectral analysis (see next section) without any prior correction. In each photo, we only analysed the central part, i.e. a 4.8 km by 4 km block (1 920 ha) in which convex deformation due to camera lens is of minor importance (Avery & Berlin 1992). For field navigation, a copy of the digitized images were assembled, georeferenced and superimposed on a digitized 1:50,000 topographical map (sheets Kourou S.-O. 22-VIII-1a and Haut Kourou N.O. NB-22-II-3c; IGN, France) using ArcGIS (ArcGIS TM Version 8.3, ESRI, Inc., Redlands, CA, USA).
SPECTRAL ANALYSIS BY FOURIER TRANSFORM
Only broad outlines of two-dimensional spectral analysis by Fourier transform are provided here, since detailed presentations (e.g., Ripley 1981) as well as applications to digital images
Couteron et al. - 12/12/05
(Mugglestone & Renshaw 1998; Couteron 2002) are already available. For simplicity, only square images will be considered although the method applies also to rectangular images. A digital image is here defined as an n by n array of grey-scale values in the range 0-255 expressing the panchromatic radiance of each pixel. Spectral analysis aims at modeling such data as a weighted sum of cosine and sine waveforms of varying traveling direction and spatial frequency. For a particular geographical direction, the wavenumber, p, quantifies spatial frequency and corresponds to the number of times a waveform repeats itself within the image. The two-dimensional Fourier periodogram features the decomposition of the total image variance according to all possible integer pairs, (p, q), of wavenumbers along the two Cartesian geographical directions (with 1≤ p ≤ n /2 and 1≤ q ≤ n /2). When expressed in polar form (Mugglestone & Renshaw 1998) periodogram values, Irθ, are portions of image
variance accounted for by a waveform having spatial frequency r and traveling direction θ ,
with 2 2
q p
r= + and θ= tan−1( p /q).
For each r spatial frequency summing Irθ values on all possible traveling directions
yields an azimuthally cumulated "radial" spectrum, I(r), that provides a convenient way to quantify coarseness-related textural properties by studying the decomposition of variance among spatial frequencies. Images with a coarse texture will yield a radial spectrum that is skewed towards small wavenumbers, whilst fine-textured images are expected to produce a more balanced spectra (see Fig. 3 in Couteron 2002 for a schematic illustration). An image in which each pixel takes a random value independent of the value taken by any other pixel, will have the finest possible texture and a virtually flat spectrum.
ORDINATION OF RADIAL SPECTRA
We carried out a systematic textural analysis that started by partitioning the canopy photographs into square windows of 1 ha at which scale radial spectra were computed. A general table was built in which each row was the radial spectrum of a given window, while each column contained I(r) values, i.e. the portions of the grey-levels variance explained by a given spatial frequency or wavenumber, r. This table of spectra was submitted to a principal component analysis (PCA; Manly 1994), which means that windows were considered as statistical observations characterized by their spectral profiles, i.e., the way in which the grey-level variance is broken down in relation to spatial frequencies. Conversely, spatial
frequencies were seen as quantitative variables that are to be linearly combined to yield principal components. We used standardized PCA, so that principal components were defined
Couteron et al. - 12/12/05
from the eigenvector analysis of the correlation matrix between spatial frequencies. Note that our method of textural analysis, which fully relies on Fourier spectra, is totally distinct from the approach of Sommerfeld et al. (2000) who only use the Fourier transform to filter an image before identifying trees by applying a binary threshold.
GROUND CONTROL DATA
Twelve 1-ha control plots were laid out to serve as ground-truth for the textural analysis. We used a Magellan SporTrak Color handheld GPS unit (Magellan Systems Corp., San Dimas, CA, USA) to locate the plots in the field, link them to the aerial photographs, and extract the corresponding digital images using GIS. Each plot was a 100 x 100 m square in which we measured diameter at breast height (d.b.h.) or above the buttresses if present, of all the trees greater than 10 cm d.b.h. and sampled 49 canopy trees for total height measurement using a calibrated optical telemeter (Birnbaum 2001). Canopy trees with a crown exposed to full overhead sunlight (values of Dawkins (1958) crown classification index of 4 or 5) were systematically selected over a 15 x 15 m grid covering the entire plot, with trees closest to the nodes of the grid being selected regardless of their size. We computed from these data five simple structural characteristics of the forest stands (Table 1): density (D), basal area (G), diameter of the tree of mean basal area (Dg), mean canopy height (Hm), and the standard deviation of mean canopy height as an index of canopy roughness (R). All measured trees were also classified into 8 d.b.h. classes of 10 cm width, plus an additional class in which all the trees ≥ 90 cm d.b.h. were pooled. The table crossing plots with d.b.h. classes was
submitted to correspondence analysis (CA; Manly 1994) to summarize diameter distributions. The first CA axis, which was prominent (73% of the variance of the table) ranked d.b.h. classes in their natural order and expressed a gradient from the smallest class (10-20 cm) to the largest (≥ 50 cm). Plots scores on this axis were then used as a latent variable summarizing the diameter distributions (CA1 in Table 1). Subsequent CA axes proved difficult to interpret and were not considered further.
Results
TEXTURAL ANALYSIS
A preliminary PCA analysis dealing with all the 3,840 windows of 1 ha highlighted that a limited number of windows (about 7.5% of the total) were strongly differentiated from the remainder. These windows, which displayed large features (at the scale of 1 ha) such as forest
Couteron et al. - 12/12/05
roads or stream valleys and since could not be adequately assessed for forest canopy, were excluded from subsequent analyses. A second PCA was run on the 3,545 remaining windows, yielding a first factorial plane (Fig. 1 top) that reflected a progressive transition from spectra dominated by the first wavenumber (r=1, positive part of PCA axis 2), to spectra
characterised by the relative importance of small (r=2-3, negative part of axis 1), intermediate (r=4-8, negative part of axis 2) and large wavenumbers (r>8, positive part of axis 1).
Accordingly, we found windows displaying coarse-grained canopy aspects (e.g. Fig. 1-b) on the negative extremity of axis 1, while fine-grained canopy textures were found on the
positive extremity (e.g. Fig. 1-f). Windows of intermediate texture were located all around the axes origin, though the best illustrations of these textural types (e.g. Fig. 1-c and Fig. 1-d) were found around the negative extremity of axis 2. The textural properties of the canopy frequently resulted from size and spatial distributions of gaps and aggregates of crowns rather than from size distribution of individual crowns. This was particularly the case for the coarser textural types (e.g., Fig 1–b).
All windows having high positive scores along axis 2 displayed heterogeneity mostly due to the influence of relief on sun illumination: for instance, on Fig. 1-a and 1-g, about one half of the window appeared sunlit and the other half in shadow. Most of those windows encompassed a prominent relief feature such as a ridge or a pronounced valley. Some of those windows displayed either a coarse-grained or a complex canopy texture (e.g. Fig. 1-a) while some others had a fine-grained canopy (Fig. 1-g). In this second case, the spectrum was characterised by the dominance of both first and large wavenumbers.
RELATIONSHIPS BETWEEN CANOPY TEXTURE AND STAND STRUCTURE We used coordinates of the plots on the textural ordination axis 1 as an index of canopy texture (PCA1) while explanatory power regarding stand structure parameters of Table 1 was tested using ordinary linear regressions (Fig. 2). It is noteworthy that while PCA1 was a good predictor of the mean stem density (R2 = 0.80, P < 0.0001) the regression against mean basal area displayed almost no slope. This was due to the limited variability of basal area across the reference plots. Good predictions were also obtained for stand structure parameters such as the diameter of the tree of mean basal area (R2 = 0.71, P < 0.001) and plots coordinates along axis 1 of the correspondence analysis summarising the size (d.b.h.) distribution of trees (R2 = 0.64, P < 0.01). The relationship with mean canopy height was weaker but statistically significant (R2 = 0.57, P < 0.01), as with standard deviation of canopy heights (R2 = 0.55, P < 0.01), a proxy for stand canopy roughness.
Couteron et al. - 12/12/05
PREDICTIVE MAPS OF STAND STRUCTURE PARAMETERS
To complement the textural analysis, we submitted the table of the radial spectra to k-means clustering (Manly 1994), using the Euclidean distance after prior standardization by column standard deviations so as to remain consistent with results of standardized PCA. In this example, clustering using five classes yielded the most meaningful results. Textural classes T2 (coarse-grained canopy) to T5 (fine-grained) were ordinated along PCA axis 1 of the textural analysis (see Fig. 1). Class T1 differentiated from other coarse-grained classes along PCA axis 2, on the basis of image macro-heterogeneity due to relief-induced illumination discrepancy. Class T5 encompassed all fine-grained canopy windows whatever the level of illumination heterogeneity.
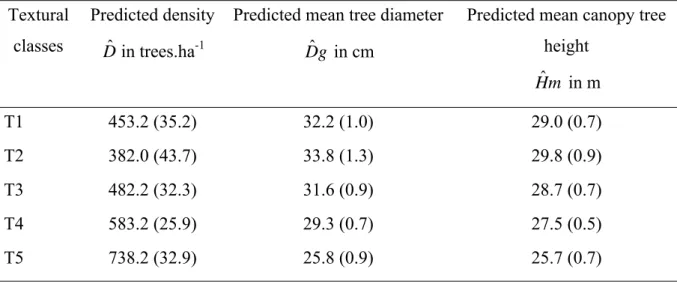
Though allocating canopy windows to an arbitrary number of classes is less objective information than ordination scores it is very convenient for mapping. For instance, Figure 3 presents a map of the canopy texture based on the five classes for contact n°399 while Table 2 shows predictions of the most significant mean stand structure parameters of these classes, as inferred from the above regressions (Sokal & Rolf 1995, p. 472). Figure 3 reveals a clear spatial partition between: i) coarse- to intermediate-grained canopies (T2-3; red and green squares) which were observed on volcano-sedimentary materials on the slopes of Montagne Plomb in the southern part of the study site, corresponding to tall stands ( ca. 29-30 m) with a low density ( ca. 400-500 trees per ha) of large trees ( ca. 32-34 cm d.b.h.), and ii) intermediate- to fine-grained canopies (T4-5; yellow and light-blue squares) on pelitic formations in the northern hilly part of the site, corresponding to low stands ( ca. 26-28 m) with a high density ( ca. 600-700 trees per ha) of small trees ( ca. 26-29 cm d.b.h.). In this northern part, fine-grained windows were intermixed with coarse-grained windows (T1; dark-blue squares) containing sharp relief features such as ridges or deep valleys (see Fig. 1a-g). Thesefeatures, while fairly well detected by the textural analysis (Fig. 3), were infrequent on smooth slopes of Montagne Plomb but frequent in the hilly northern part. Furthermore, it is on steep slopes in this northern part, where unfavourable substratum conditions (virtually no soil on the alterite) determine dense stands of small trees, that frequent occurrence of the finest-grained windows (like Fig. 1-g) was observed.
ˆ H m ˆ D D gˆ ˆ H m ˆ D D gˆ 8
Couteron et al. - 12/12/05
Discussion
Two-dimensional Fourier analysis is a powerful method to obtain both quantitative
characterization of canopy texture and reasonable estimations of stand structure parameters from VHR optical images. This conclusion, drawn from the use of digitized air photos, is likely to hold regarding sub-meter pixel satellite images that are easier to use with respect to georeferencing and assembling into large maps. But the availability of such images at
affordable cost is still problematic if the aim is to document large areas of tropical rain forest. In addition, frequent cloud coverage limits the acquisition of satellite scenes of good quality. Visual interpretation is not only time consuming but also of limited spatio-temporal
consistency and this is a likely reason for which it has not been widely applied in the tropics though extensive air coverage has been available for as long as in the temperate zone. Indeed, only an automatic or a semi-automatic approach can deal with the subtle and spatially intricate variations that characterize tropical evergreen forest stands. Most examples of visual
interpretation quoted by Polidori et al. (2003) dealt with contrasted and spatially segregated forest types, e.g., deciduous vs. evergreen.
Automatic recognition and delineation of individual tree crowns has been attempted in homogeneous, even-aged tree stands from VHR optical data at the price of complex
algorithms and heavy computation (e.g., Gougeon 1995; Pouliot et al. 2002). Automatic delineation is also under investigation for heterogeneous natural stands (Hurtt et al. 2003). There are, anyhow, good reasons to consider automatic delineation of individual crowns as a difficult task in tropical stands, due to frequent crown merging between adjacent trees. Asner et al. (2002), who performed a thorough manual delineation of tree crowns, acknowledged situations for which deciding between single crowns vs. merged crowns is virtually
impossible and reported a serious positive bias on crown size estimation from VHR satellite imagery. Hence, broad-scale applicability of individual trees approaches to tropical stand characterization cannot be considered in the near future. On the other hand, our more holistic approach, which considers canopy texture as a whole, presents good prospects of immediate large-scale applicability. From this point of view, it represents a promising alternative to direct measurements of physical attributes of the vegetation, such as canopy tree height estimates from LIDAR (light detection and ranging), which requires complex algorithms to separate ground returns from overlying vegetation returns, a process remaining subject to increased random errors in dense, multi-layered evergreen forests (Clark, Clark & Roberts 2004).
Couteron et al. - 12/12/05
However, as for every regression-based parameter retrieval technique, there is a need for both calibration and validation, because values of the canopy texture index are relative to a particular set of images and also because the ecological relationship between canopy texture and stand parameters has remained up to now poorly investigated. The need to measure additional field plots to re-calibrate regression coefficients, for each new study area and each new set of images may, at first sight, appear as a serious hindrance to a wide-scale
implementation of the method. However, it is not unrealistic to think that large datasets featuring both tree diameter data and digitized canopy images for many 1-ha plots could be efficiently set up by forest departments, as part of their routine field operations of forest monitoring and inventory. From such databases, textural indices and regression coefficients having broad regional validity could be easily derived to yield automatic estimates of forest stand structure parameters over vast areas of tropical forests. This would be particularly useful to guide preparation of field prospects for consistent resource inventory, forest classification and management planning.
Acknowledgements
This research has been carried out in the framework of the DIME project supported by the French Ministère de l'écologie et du développement durable (MEDD) through grant
CV02000074. We thank C. François, J.-F. Molino, M.-F. Prévost, D. Sabatier, J.-L. Smock along with the students of the ENGREF "FTH-2002" training stay for their contribution to the collection of field data, and F. Lokonadinpoullé for assistance with GIS. We also thank Ch. Proisy, D. Lo Seen, D.B. Clark and one anonymous reviewer for comments on an earlier draft of the paper..
Couteron et al. - 12/12/05
References
Avery, T. E. & Berlin, G. L. (1992) Fundamentals of Remote Sensing and Airphoto Interpretation. Macmillan, New-York.
Ashton, P.S. & Hall, P. (1992) Comparisons of structure among mixed Dipterocarp forests of north-western Borneo. Journal of Ecology, 80, 459–481.
Asner, G.P., Palace, M., Keller, M., Pereira, R. Jr., Silva, J.N.M. & Zweede, J.C. (2002) Estimating canopy structure in an Amazon forest from laser range finder and IKONOS satellite observations. Biotropica, 34, 483–492.
Asner, G.P. & Warner, A.S. (2003) Canopy shadow in IKONOS satellite observations of tropical forests and savannas. Remote Sensing of Environment, 87, 521–533.
Birnbaum, P. (2001) Canopy surface topography in a French Guiana forest and the folded forest theory. Plant Ecology, 153, 293–300.
Chave, J., Condit, R., Lao, S., Caspersen, J.P., Foster, R.B. & Hubbell, S.P. (2003) Spatial and temporal variation of biomass in a tropical forest: results from a large census plot in Panama. Journal of Ecology, 91, 240–252.
Clark, M.L., Clark, D.B. & Roberts, D.A. (2004) Small-footprint lidar estimation of sub-canopy elevation and tree height in a tropical rain forest landscape. Remote Sensing of Environment, 91, 68-89.
Clark, D.B., Read, J.M., Clark, M.L., Cruz, A.M., Dotti, M.F. & Clark, D.A. (2004) Application of 1-m and 4-m resolution satellite data to ecological studies of tropical rain forests. Ecological Applications, 14, 61–74.
Clark, D.B., Castro, C.S., Alvarado, A.L.D. & Read, J.M. (2004) Quantifying mortality of tropical rain forest trees using high-spatial-resolution satellite data. Ecology Letters, 7, 52–59. Couteron, P. (2002) Quantifying change in patterned semi-arid vegetation by Fourier analysis of digitized aerial photographs. International Journal of Remote Sensing, 23, 3407–3425. Couteron, P. & Lejeune, O. (2001) Periodic spotted patterns in semiarid vegetation explained by a propagation-inhibition model. Journal of Ecology, 89, 616–628.
Couteron, P., Pélissier, R., Mapaga, D., Molino, J.-F. & Teillier, L. (2003) Drawing ecological insights from a management-oriented forest inventory in French Guiana. Forest Ecology and Management, 172, 89–108.
Dawkins, H.C. (1958) The management of natural tropical high-forests with special reference to Uganda. Imperial Forestry Institute Paper, 34, 1-155.
Delor, C., Lahondère, D., Egal, E., Lafon, J.-M., Cocherie, A., Guerrot, C., Rossi, P., Truffert, C., Théveniaut, H., Phillips, D. & de Avelar, V.G. (2003) Transamazonian crustal growth and reworking as revealed by the 1:500,000-scale geological map of French Guiana (2nd edition). Géologie de la France, 2-3-4, 5–57.
Couteron et al. - 12/12/05
De Wasseige, C. & Defourny, P. (2002) Retrieval of tropical forest structure characteristics from bi-directional reflectance of SPOT images. Remote Sensing of Environment, 83, 362– 375.
Drake, J. B., Dubayah, R.O., Clark, D.B., Knox, R.G., Blair, J.B., Hofton, M.A., Chazdon, R.L., Weishampel, J.F. & Prince, S. (2002) Estimation of tropical forest structural
characteristics using large-footprint lidar. Remote Sensing of Environment, 79, 305–319. Drake, J.B., Knox, R.G., Dubayah, R.O., Clark, D.B., Condit, R., Blair, B. & Hofton, M. (2003) Above-ground biomass estimation in closed canopy Neotropical forests using lidar remote sensing: factors affecting the generality of relationships. Global Ecology and Biogeography, 12, 147–159.
Dubayah, R.O., & Drake, J.B. (2000) Lidar remote sensing for forestry. Journal of Forestry,
98, 44–46.
Gougeon, F.A. (1995) A crown-following approach to the automatic delineation of individual tree crowns in high spatial resolution aerial images. Canadian Journal of Remote Sensing, 21, 274–284.
Grace, J. (2004) Understanding and managing the global carbon cycle. Journal of Ecology 92: 189-202.
Houghton, R. A., Lawrence, K. T., Hackler, J. L. & Brown, S. (2001) The spatial distribution of forest biomass in the Brazilian Amazon: a comparison of estimates. Global Change
Biology 7: 731-746.
Hurtt, G., Xiao, X., Keller, M., Palace, M., Asner, G.P., Braswell, R., Brondizio, E.S. Cardoso, M., Carvalho, C. Jr., Fearon, M.G., Guild, L., Hagen, S., Hetrick, S., Moore, B.III, Nobre, C., Read, J.M., Sa, T., Schloss, A., Vourlitis, G. & Wickel, A.J. (2003) IKONOS imagery for the Large Scale Biosphere–Atmosphere Experiment in Amazonia (LBA). Remote Sensing of Environment, 88, 111–127.
Lu, D., Mausel, P., Brondizio, E. & Moran, E. (2004) Relationships between forest stand parameters and Landsat TM spectral responses in the Brazilian Amazon Basin. Forest Ecology and Management, 198, 149–167.
Manly, B.F.J. (1994) Multivariate statistical methods: a primer. Chapman and Hall, London. Mugglestone, M.A. & Renshaw, E. (1998) Detection of geological lineations on aerial photographs using two-dimensional spectral analysis. Computers and Geosciences, 24, 771– 784.
Nelson, R., Oderwald, R. & Gregoire, T. G. (1997) Separating ground and airborne laser sampling phases to estimate tropical forest basal area, volume and biomass. Remote Sensing of Environment, 60, 311–326.
Paget D. (1999). Etude de la diversité spatiale des écosystèmes forestiers guyanais : réflexion méthodologique et application. Thèse de Doctorat, ENGREF, Nancy.
Couteron et al. - 12/12/05
Polidori, L., Couteron, P., Gond, V., Proisy, C. & Trichon, V. (2004) Télédétection et caractérisation des paysages amazoniens. Revue Forestière Française, LV, 101–117.
Pouliot, D.A., King, D.J., Bell, F.W. & Pitt, D.G. (2002) Automated tree crown detection and delineation in high resolution digital camera imagery of coniferous forest regeneration. Remote Sensing of Environment, 82, 322–334.
Read, J.M. (2003) Spatial analyses of logging impacts in Amazonia using remotely sensed data. Photogrammetric Engineering & Remote Sensing, 69, 275–282.
Read, J.M., Clark, D.B., Venticinque, E.M. & Moreiras, M.P. (2003) Application of merged 1-m and 4-m resolution satellite data to research and management in tropical forests. Journal of Applied Ecology, 40, 592–600.
Riéra, B., Pélissier, R. & Houllier, F. (1998) Caractérisation d'une mosaïque forestière et de sa dynamique en forêt tropicale humide sempervirente. Biotropica, 30, 251–260.
Ripley, B.D. (1981) Spatial statistics. Wiley, New-York.
Santos, J.R., Pardi Lacruz, M.S., Aroujo, L.S. & Keil, M. (2002) Savanna and tropical rainforest biomass estimation and spatialisation using JERS-1 data. International Journal of Remote Sensing, 23, 1217–1229.
Sommerfeld, R.A., Lundquist, J.E. & Smith, J. (2000) Characterizing the canopy gap structure of a disturbed forest using the Fourier transform. Forest Ecology and Management, 128, 101– 108.
Tuomisto, H., Ruokolainen, K., Kalliola, R., Linna, A., Danjoy, W. & Rodriguez, Z. (1995) Dissecting Amazonian biodiversity. Science, 269, 63–66.
Couteron et al. - 12/12/05
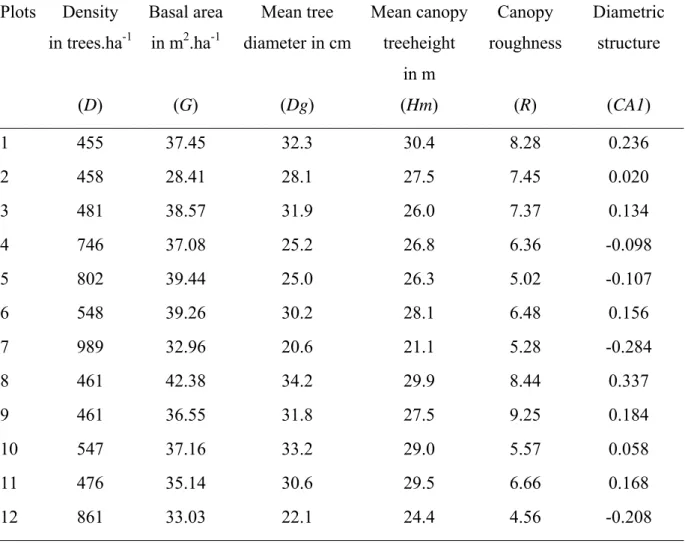
Table 1. Stand structure parameters measured for twelve 1-ha ground-truth plots in study area
of the DIME project near the Petit-Saut reservoir dam, French Guiana. Dg corresponds to the diameter of the tree of mean basal area; R is the standard deviation of Hm; CA1 corresponds to plot scores along axis 1 of the correspondence analysis carried out on diameter distributions (see text). Plots Density in trees.ha-1 (D) Basal area in m2.ha-1 (G) Mean tree diameter in cm (Dg) Mean canopy treeheight in m (Hm) Canopy roughness (R) Diametric structure (CA1) 1 455 37.45 32.3 30.4 8.28 0.236 2 458 28.41 28.1 27.5 7.45 0.020 3 481 38.57 31.9 26.0 7.37 0.134 4 746 37.08 25.2 26.8 6.36 -0.098 5 802 39.44 25.0 26.3 5.02 -0.107 6 548 39.26 30.2 28.1 6.48 0.156 7 989 32.96 20.6 21.1 5.28 -0.284 8 461 42.38 34.2 29.9 8.44 0.337 9 461 36.55 31.8 27.5 9.25 0.184 10 547 37.16 33.2 29.0 5.57 0.058 11 476 35.14 30.6 29.5 6.66 0.168 12 861 33.03 22.1 24.4 4.56 -0.208 14
Couteron et al. - 12/12/05
Table 2. Predictions of mean stand structure parameters (with standard error) for the five
classes of canopy texture (see Figure 2 and text). Study site of the DIME project, near the Petit-Saut reservoir dam, French Guiana.
Textural classes
Predicted density
ˆ
D in trees.ha-1
Predicted mean tree diameter
ˆ
D g in cm
Predicted mean canopy tree height ˆ H m in m T1 453.2 (35.2) 32.2 (1.0) 29.0 (0.7) T2 382.0 (43.7) 33.8 (1.3) 29.8 (0.9) T3 482.2 (32.3) 31.6 (0.9) 28.7 (0.7) T4 583.2 (25.9) 29.3 (0.7) 27.5 (0.5) T5 738.2 (32.9) 25.8 (0.9) 25.7 (0.7) 15
Couteron et al. - 12/12/05
Figure captions
Figure 1. Results of the multidimensional comparison of spectral profiles for 3,545 forest
canopy windows of 1 ha in the study area of the DIME project near the Petit-Saut reservoir dam, French Guiana. The five textural classes (T1 to T5) identified by k-means clustering (see text) are plotted against the two main axes yielded by the principal component analysis (PCA) of the spectra table. The envelopes of classes delineate twice the standard deviation of PCA scores of the constituting windows. Windows a) to g) have been automatically selected as the most illustrative (largest distance from axes origin) with regards to successive angular
directions in the PCA plane and, thus, to the relative importance of the corresponding ranges of wavenumbers. Top-left inset: distribution of relative eigenvalues. Top-right inset:
correlations of wavenumbers (some of the wavenumbers above 10 are omitted for legibility) with PCA axes 1 and 2; each radial direction in the PCA plane corresponds to the relative importance in the spectrum of particular ranges of wavenumbers.
Figure 2. Stand structure parameters (see Table 1) as a function of scores of the ground-truth
plots along PCA axis 1 used as an index of canopy texture (see Fig. 1). Study site of the DIME project near the Petit-Saut reservoir dam, French Guiana.
Figure 3. Left: central part of contact image n°399 (coverage 1992-GUF-91/250, IGN,
France) in the study area of the DIME project, near the Petit-Saut reservoir dam, French Guiana. Right: same area with coloured squares corresponding to 1-ha forest canopy windows coded in five classes of canopy texture (see Fig. 1, Table 2 and text): dark-blue = T1 (coarse-grained texture for windows marked by relief-induced illumination discrepancy); red = T2 (coarse-grained canopy texture); green = T3 (coarse- to intermediate-grained); yellow = T4 (intermediate- to fine-grained); light-blue = T5 (fine-grained).
Couteron et al. - 12/12/05
Couteron et al. - 12/12/05
Couteron et al. - 12/12/05