100% Container Scanning:
Security Policy Implications for Global Supply Chains
byAllison C. Bennett
B.S. Logistics and Intermodal Transportation United States Merchant Marine Academy, 2003
and Yi Zhuan Chin
B.S. Civil and Environmental Engineering Cornell University, 2007
Submitted to the Engineering Systems Division in partial fulfillment of the Requirements for the Degree of
Master of Engineering in Logistics
at theMassachusetts Institute of Technology
June 2008
C 2008 Allison C.Bennett and Yi Zhuan Chin. All rights reserved.
The authors hereby grant to MIT permission to reproduce and to distribute publicly paper and electronic copies of this thesis document in whole or in part
Signature of Author...
Allison C. Bennett, Engineering Systems Division
(
h May 9,2008Signature of Author... ... Yij an Chin, Engineering Systems Division May, 9 2008 Certified by...
James B. Rice, Jr.
uty Director, Cef'r. portation and Logistics
, //f 1/[] '4 Thesis Supervisor A ccepted by... ... ... She i
Prof.
Yossi Sheffi
rserPrnenr Engineering Svystem.s Divisinn MASSACH~LSTS NSTE
OF TECHNOLOGY
AUG 0
6
2008
LIBRARIES
Professor, Civil and Environmental Engineering Department Director, Center for Transportation and Logistics Director, Engineering Systems Division
ABSTRACT
On August 3, 2007, President George Bush signed into law HR1 the
"Implementing Recommendations of the 9/11 Commission Act of 2007." The 9/11 Act requires 100% scanning of US-bound containers at foreign seaports by 2012 through the use of non-intrusive (NII) and radiation detection equipment. Maritime stakeholders and the government community have actively debated the feasibility of this plan, citing economic impacts, barriers to global trade and insufficient technology and physical space.
This thesis focuses on importer concerns relating to potential shipment delays, financial burdens, sourcing issues and contingency planning concerns in global supply chain operations. Using port statistics, field study data as well as industry insights, frameworks are developed to identify major stakeholder issues and quantify the financial costs and delay risks bourn across the entire supply chain.
Cost and delay analyses are based on 2 prototypical ports - a small/low-volume export port and a large/high-volume export port. Cost analysis is performed for a consolidated (port authority) level installation and a segmented (terminal operator) level installation to calculate a per-box scanning fee. Queuing models and Monte-Carlo simulations are also developed to quantify truck congestion due to primary scanning and the risk of containers missing vessels due to secondary inspections.
Results of the cost analysis indicate that scanning configurations, particularly related to NII, greatly affect the-per box scanning cost. It is not economically feasible to scan only US-bound containers at half of the 600 ports with direct connections to the US. Analysis of truck congestion suggests that the ramp metering effect of the entry gate can help to abate congestion at the scanning area. Analysis on secondary inspection delays revealed that under a set of assumptions that reflect current operations, the risk of containers missing sailings could potentially increase to 1.5%, which may in turn require a 0.5% to 5% increase in safety stock.
Our study shows that cost and delay implications of 100% export US-bound container scanning may be less severe than industry anticipated. Supply chain disruptions due to scanning is best mitigated through earlier container dispatch, increased safety stock or increased scanning infrastructure and personnel at ports.
ACKNOWLEDGEMENTS
We are pleased to have worked under the guidance of Jim Rice, our thesis
advisor. His thoughtfulness and enthusiasm for supply chain security made our research a pleasure. We also want to thank David Gonsalves, our thesis sponsor from General Motors, who took an active role in ensuring the success of our research goals.
We would like to express our gratitude to members of the maritime industry and government sector, whose practical inputs shaped the scope of our research. We have endeavored to return the favor with practical outputs. Some of the key stakeholders include:
Earl Agron
Vice President, Security American President Line
Cleiton Alves dos Santos Joaio Simaes Alf^andega da Receita Federal do Brasil Porto de Santos Anthony Barone Pfizer Inc. Ben Cook Kimberly-Clark Nilson Datoguia
American President Lines Santos, Brazil
Michael Dreher Vice President
Global Transport Logistics & Customs Adidas Group
Emil Fiorantis
Director, Special Projects
Dominion Customs Consulting Inc. Jon Gold
National Retail Federation Alan Lear
Director of Logistics
Libra Terminais, Porto de Santos (Libra Terminals, Port of Santos)
Strategy Consultores Associados Mohand Merzkani
Dean
Universidad Tecnologica Campus Puerto Cortes
de Honduras,
Allen Thompson
Retail Industry Leaders Association David Spaeth
Wal-Mart Stores, Inc.
We want to voice special appreciation to everyone that made our field study visits to Puerto Cortes, Honduras and Port of Santos, Brazil possible. These hands-on learning experiences greatly contributed to the quality and breadth of our thesis.
Lastly, we are grateful to have worked as a team to tackle this difficult subject. We were able to merge cross-cultural ideas to create an exciting project, whose sum total was far greater than its individual parts could have been.
Table of Contents
1 INTRODUCTION ... 11
1.1 BACKGROUND ... 12
1.1.1 Customs-Trade Partnership Against Terrorism (C-TPAT) ... ... 14
1.1.2 International Ship and Port Facility Security Code (ISPS Code) ... ... 14
1.1.3 24-H our Rule ... .. ... ... ... 15
1.1.4 Automated Targeting System (ATS)... ... 15
1.1.5 Container Security Initiative (CSI)... ... 16
1.1.6 Megaports Initiative ... ... ... 17
1.1.7 Security and Prosperity Partnership (SPP) ... ... ... 17
1.1.8 Security and Accountability for Every (SAFE) Port Act... 18
1.1.9 Secure Freight Initiative (SFI)... ... ... ... 18
1.1.10 "10 + 2" Initiative... 21
1.1.11 HR 1, the "Implementing Recormnendations of the 9/11 Commission Act of 2007"-Section 1701 (9/11 Act) ... 22
1.2 9/11 ACT COMPLIANCE EQUIPMENT ... ... 23
2 REVIEW OF LITERATURE ... 28
2.1 DOCUMENTED INDUSTRY OPINIONS... 28
2.2 DELAY ESTIMATES... 31
2.3 COST ESTIMATES ... 36
2.4 CASE STUDY OF PORT OF ROTTERDAM ... ... 40
3 TAXONOMY ... 43
3.1 INTERVIEWS WITH TOP 10 IMPORTERS ... ... 43
3.2 POTENTIAL DELAYS AND IMPLICATIONS ... ... 45
3.3 BURDEN OF COST...55
4 RESEARCH SCOPE ...60
4.1 ASSUMPTIONS AND INTERPRETATION OF 9/11 ACT... 60
4.2 RESEARCH APPROACH ... 64
5 COST OVERVIEW ... 66
5.1 INITIALIZATION COSTS ... 68
5.1.1 Equipment and Installation Costs ... ... 68
5.1.2 Domestic Equipment and Installation Costs ... 69
5.1.3 Vendor Estimates... ... 72
5.1.4 Other Initialization Elements ... 76
5.2 OPERATIONAL COSTS ... 77
5.2.1 Domestic Operational Costs ... ... ... 79
5.2.2 Vendor Operational Cost Data ... ... ... 80
5.3 COST CALCULATIONS... 81
5.3.1 Port Authority Level Installation Assumptions ... 85
5.3.2 Terminal Operator Level Installation Assumptions ... ... 87
5.3.3 Small Container Port ... 89
5.3.4 Large Container Port ... 92
5.4 COST RESULTS ... 97
5.4.1 Small Container Port -Port Authority Level Installation ... .... 97
5.4.2 Small Container Port -Terminal Operator Level Installation ... 99
5.4.3 Large Container Port -Port Authority Level Installation ... 101
5.4.4 Large Container Port -Terminal Operator Level Installation ... 102
5.5 COST ANALYSIS ... 104
6 DELAY ESTIM ATION ... 110
6.1 TRUCK CONGESTION ... 110
6.1.1 Queuing model for Truck Congestion... ... 113
6.1.2 M/M/n Queue for Gate Processing... 115
6.1.3 M/M/n Queue for Scanning ... ... 117
6.1.4 Parameters and assumptions of Queuing model... 118
6.1.5 Model Development... 120
6.1.6 Results from Queuing Model... 122
6.1.7 Sensitivity Analysis for High Volume Export Ports ... ... 124
6.1.8 "Ramp Metering" Effect of Entry Gate ... 127
6.1.9 Trade-off between Amortization of Scanning Costs and Delays... 128
6.1.10 Summary of Truck Congestion ... 131
6.1.11 Assumptions of Truck Congestion... ... ... 132
6.2 SECONDARY INSPECTION AND MISSED SAILINGS... 133
6.2.1 Monte Carlo Simulation for Secondary Inspections ... 134
6.2.2 Secondary Inspection Time on Probability of Missing Vessel... 138
6.2.3 Probability of Missing Vessel by Container Arrival Day ... 139
6.2.4 Companies' Response to Increased Risk of Missing Vessel ... 142
6.2.5 Sensitivity Analysis of Secondary Inspection Time on Inventory ... 146
6.2.6 Results of Sensitivity Analysis of Secondary Inspection Time... ... 149
6.2.7 Summary of Secondary Inspection and Missed Sailing... 152
6.2.8 Assumptions of Secondary Inspection ... 154
7 CONCLUSION... 155 7.1 9/11 ACT ... ... 155 7.2 SUMMARY OF RESULTS ... 157 7.3 ROAD MAP ... 160 8 FUTURE RESEARCH ... 162 9 REFERENCES ... 164 10 APPENDIX... 170
Table of Figures
Figure 1. Global Shipping Lanes... 13
Figure 2. SFI Operations... ... 20
Figure 3. Sample RPM Equipment at SFI location ... 24
Figure 4. Sample NII Equipment at SFI location... ... 26
Figure 5. Sam ple N II Im age... ... 26
Figure 6. Sample Hand-held Equipment for SFI Ports... ... 27
Figure 7. Advanced Spectroscopic Portal (ASP) ... ... 27
Figure 8. Departure Delays Based on Inspection Level ... 34
Figure 9. Vessel Delays Based on Inspection Percentages... ... 36
Figure 10. Port of Rotterdam Conceptual Scanning... ... 41
Figure 11. Port of Rotterdam Conceptual Scanning Locations... 42
Figure 12. Possible Delays due to 9/11 Act on International Supply Chains ... 46
Figure 13. Delay Implications... 47
Figure 14. Stakeholder Breakdown ... ... 66
Figure 15. Percentage of Seaport RPMs in DHS Domestic Deployment... 69
Figure 16. Generic Port Gate ... 84
Figure 17. RPM and NII Inspection Area... ... 85
Figure 18. Small Port Lay-out... 92
Figure 19: Port of Antwerp Port Lay-out ... 93
Figure 20. Large Port Lay-out... 97
Figure 21. Picture of a port gate with 9 booths ... 114
Figure 22. Truck Congestion Process... 121
Figure 23. Queue Times for Low Volume Export Port with 60% US-bound Exports .. 122
Figure 24. Queue Times for High Volume Export Port with 10% US-bound Exports.. 123
Figure 25. Queue Times for High Volume Export Port with 20% US-bound Exports.. 125
Figure 26. Queue Times for High Volume Export Port with 30% US-bound Exports.. 126
Figure 27. Secondary Inspection Process ... 136
Figure 28. Probability of Missing Vessel by Mean Inspection Time... 138
Figure 29. Probability of Container Missing Vessel vs Arrival Day Before Departure. 141 Figure 30. Potential Shift in Container Arrival Due to 100% Scanning ... 144
Figure 31. Probability of Missing Vessel by Average Arrival Day ... 145
Figure 32. % Change in Capacity Required to Accommodate Different Arrival Days. 145 Figure 33. % Increase in Safety Stock vs Average Secondary Inspection Days ... 151
Table of Tables
Table 1. List of Maritime Stakeholders and Potential Costs ... 70
Table 3. DHS Domestic NII Deployment Schedule ... ... 71
Table 4: US Domestic RPM Installation Costs Per Unit ... 72
Table 5. Vendor Pricing Data... 75
Table 6. New DHS Staff for FY 2009 RPM Seaport Installation ... 79
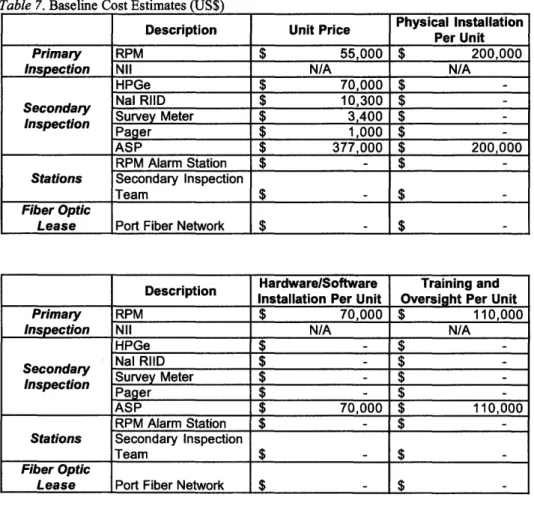
Table 7. Baseline Cost Estimates (US$) ... ... 82
Table 8. Baseline Operational Cost Estimates - Personnel (US$) ... 83
Table 9: Baseline Operational Cost Estimates - Maintenance (US$) ... 83
Table 10. 2006 World Container Port Statistics ... ... 93
Table 11. Small Container Port - Port Authority Initialization Costs (US$)... 98
Table 12. Small Container Port - Port Authority Annual Operational Costs (US$)... 98
Table 13. Small Container Port - Port Authority Annual Costs (US$) Based on 10 Year Equipm ent Life-Cycle... ... 99
Table 14. Small Container Port -Port Authority Level Installation Per Box Fee (US$).. 99
Table 15. Small Container Port - Terminal Operator Initialization Costs (US$) ... 100
Table 16. Small Container Port - Terminal Operator Annual Operational Costs (US$) 100 Table 17. Small Container Port - Terminal Operator Annual Costs (US$) Based on 10 Year Equipment Life-Cycle ... 100
Table 18. Small Container Port - Terminal Operator Level Installation Per Box Fee
(U S$) ...
101
Table 19. Large Container Port - Port Authority Initialization Costs (US$)... 101
Table 20. Large Container Port - Port Authority Annual Operational Costs (US$)... 101
Table 21. Large Container Port - Port Authority Annual Costs (US$) Based on 10 Year Equipment Life-Cycle... 102
Table 22. Large Container Port -Port Authority Level Installation Per Box Fee (US$) 102 Table 23. Large Container Port - Terminal Operator Initialization Costs (US$) ... 103
Table 24. Large Container Port - Terminal Operator Annual Operational Costs (US$) 103 Table 25. Large Container Port - Terminal Operator Annual Costs (US$) Based on 10 Year Equipment Life-Cycle ... 103
Table 26. Large Container Port - Terminal Operator Level Installation Per Box Fee (U S$) ... 104
Table 27. Small Container Port - Port Authority Level Full Scanning: Installation Per B ox Fee (U S$) ... 105
Table 28. Small Container Port - Port Authority Level Installation Per Box Fee (US$)106 Table 29. Small Container Port - Terminal Operator Level Installation Per Box Fee (U S$) ... 106
Table 30. Export volumes and percentage of US-bound in Puerto Cortes and Antwerp 118 Table 31. Minimum booths required for different export volumes ... 119
Table 32. Mean arrival rates by reference port and time of day... 121
Table 33. Queue Times for a High Volume Port with different US-bound Volumes .... 125
Table 34. Trade-off between Costs and Delays for Puerto Cortes ... 129
Table 35. Trade-off between Costs and Delays for Antwerp (A)... 130
Table 36. Trade-off between Costs and Delays for Antwerp (B)... 131
Table 38. Probability of Missing Vessel by Days before Departure ... 140 Table 39. Trade-Off Between Missing Vessel and Earlier Port Arrival ... 143 Table 40. Distribution of Container Arrivals by Day ... 143
List of Acronyms
grem 3He ASP ATS CAS CBO CBP CONOPS CSI C-TPAT DHS DOE DNDO EDI EU FEU FROB FTE FY GAO HPGe IMO ISPS LPOL MARAD mrem MTSA Nal NII NORM NNSA NVOCC OCR POE PVT RDD RFID RIID RPMSAFE Port Act
Microrem Helium-3
Advanced Spectroscopic Portal Automated Targeting System Central Alarm Station Congressional Budget Office Customs and Border Protection Concept of Operations
Container Security Initiative
Customs-Trade Partnership Against Terrorism Department of Homeland Security
Department of Energy
Domestic Nuclear Detection Office Electronic Data Interchange
European Union
Forty-foot Equivalent Unit Freight Remaining Onboard Full-Time Equivalent Fiscal Year
Government Accounting Office High-Purity Germanium
International Maritime Organization International Ship and Port Security Code Last Port of Loading
Maritime Administration Millirem
Maritime Transportation Security Act Sodium Iodide
Non-Intrusive Inspection
Naturally Occurring Radioactive Material National Nuclear Security Administration Non-Vessel Operating Common Carriers Optical Character Recognition
Port of Entry
Polyvinyl Toluene Scintillator Radiological Dispersal Device Radio Frequency Identification
Radioactive Isotope Identification Device Radiation Portal Monitor
SFI Secure Freight Initiative
SLD Second Line of Defense
SPP Security and Prosperity Partnership
TEU Twenty-foot Equivilant Unit
WMD Weapon of Mass Destruction
1
INTRODUCTION
Economic vitality hinges upon global trade. Over 90% of the economic value of global commerce is transported through the maritime domain via containerized cargo. In terms of speed, cost and security, containers are the preferred transportation option. The global standardization of shipping containers allows cargo to efficiently move through the intermodal transportation system of truck, rail and vessel services without requiring the repackaging of cargo.
In the post-9/11 trade environment, the global reach of terrorist organizations lends credence that terrorists or states of proliferation concern may exploit containerized cargo. Utilizing maritime shipping networks, terrorist could launch an attack using special nuclear or other radioactive materials in a weapon of mass destruction (WMD) or radiological dispersal device (RDD). The anonymity of containerization requires
containers to be opened or examined with specialized equipment to determine contents with any level of certainty.
Based on the threat imposed by seaborne containers, the United States government used regulatory measures to increase maritime security by extending the inspection frontier to require the scanning of US-bound containers abroad. On August 3, 2007, President George W. Bush signed into law HR 1, the "Implementing
Recommendations of the 9/11 Commission Act of 2007," requiring that all US-bound containers be scanned with non-intrusive inspection (NII) equipment to examine cargo density, as well as radiation portal monitors (RPMs) to detect the presence of gamma and neutron radiation (2007). This legislation will be referred to as the 9/11 Act within this
document. Our thesis focuses on the container scanning requirements contained in Section 1701 of the 9/11 Act.
This legislation was met with harsh criticism. Stakeholder organizations, ocean carriers and foreign port authorities voiced concerns over responsibilities and costs associated with the scanning process. While concerns over the operational feasibility of scanning (both technological and process-related) and sovereignty have been addressed, little attention has been paid to the impact of the 9/11 Act along the entire supply chain. In particular, businesses are interested in understanding if implementation of the 9/11 Act will cause shipment delays and additional financial costs to their business operations. In order to adjust corporate supply chain strategies and contingency plans, businesses require metrics and tools for advanced planning to avoid taking a reactive posture to the 2012 implementation date. How will non-compliant ports affect sourcing decisions? Whose bottom line is affected by scanning expenses? This study focuses on the impact of 100% scanning of US-bound containers on businesses that depend on global supply chains for their daily operations.
Our analysis is broken down into 2 primary sections addressing potential financial cost and container delays associated with the implementation of the 9/11 Act. We
calculate the initialization and operational cost of deployments at small and large ports and examine delays through the probability that a container will miss its scheduled vessel sailing.
1.1
Background
In 2006 over 129 million twenty-foot equivalent units (TEUs) of containerized cargo transited the globe (United Nations, 2007). Approximately 18.5 million TEUs (11
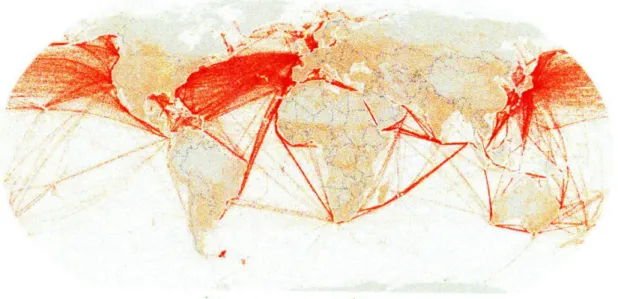
million containers) entered the United States in 2006 from 591 last ports of loading (LPOL), equating to more than 60 vessel calls per day. Approximately 300 of these LPOLs ship 100 or fewer TEUs directly to the United States on an annual basis (Maritime Administration, 2007). The complexity and breadth of the interconnectivity between maritime nodes is depicted in Figure 1.
Figure 1. Global Shipping Lanes (Source: Shipping lanes map created from data downloaded at
www.aoml.noaa.gov/phod/trinanes/BBXX from the SEAS BBXX database of the Global Ocean Observing System Center from the Atlantic Oceanographic and Meteorological Laboratory of the National Oceanic and Atmospheric Administration)
This section outlines the relevant US government security initiatives developed during the 6-plus year period since the terrorist attacks of September 11, 2001 and also describes the equipment involved in complying with the 9/11 Act. The list of security programs is not exhaustive, but it highlights major programs focused on inspecting and targeting maritime containers prior to arrival at US ports of entry (POE). It is important to review the progression of US legislation to understand the 9/11 Act in the context of past
and current security initiatives. The 9/11 Act requirements are outlined in detail at the end of the section.
1.1.1 Customs-Trade Partnership Against Terrorism (C-TPAT)
The US Customs and Border Protection (CBP) under DHS began the Customs-Trade Partnership Against Terrorism (C-TPAT) in November 2001. C-TPAT is a voluntary program to increase supply chain security. The program requires members to work with their business partners to ensure the integrity of their supply chain and to document this effort. In return, CBP offers reduction of inspections, priority processing, security validation, and involvement in a network of security conscious businesses (United States Customs and Border Protection [CBP], 2007a). At the end of FY2007 DHS reported the involvement of 7,737 certified partners, with 6,003 of these having completed the validation process (Department of Homeland Security [DHS], 2008a).
1.1.2 International Ship and Port Facility Security Code (ISPS Code)
In December of 2002, the International Maritime Organization (IMO) established the International Ship and Port Security Code (ISPS) to enhance maritime security. The ISPS code established standards for security, roles and responsibilities, as well as methodologies for assessing security. It required that by July 1, 2004, all 167 IMO member-states must certify compliance. Contracting governments must set security levels, conduct port facility security assessments, approve security plans for both ships and port facilities, identify ports that need port facility security officers, and test approved security plans. On November 25, 2002, the Maritime Transportation Security Act of 2002 (MTSA) was signed to provide US legislation for the ISPS Code, with the US Coast
Guard in charge of meeting the implementation deadline (International Maritime Organization, 2003).
1.1.3 24-Hour Rule
CBP enforced the 24-Hour Rule on February 2, 2004. The 24-Hour Rule requires ocean carriers and NVOCCs (Non-Vessel Operating Common Carriers) to electronically submit manifest information for US-bound or US-nexus containerized cargo 24 hours prior to loading the container on a vessel bound to the United States. The manifest includes 14 data elements, which provide detailed descriptions on the container's contents. It is important to note that this reporting does not necessarily occur at the first port of departure, but instead the last port prior to a US arrival. This rule must be followed for any container (US-nexus) that is on a vessel bound for the United States, regardless of whether the specific container is destined for or is temporarily off-loaded in the United States. US-nexus also includes freight remaining onboard (FROB), which never actually touches US soil. The security premise is that any container that will be alongside the United :States poses a security risk.
Under the 24-Hour Rule, vague cargo descriptions, such as "Freight of All Kind" and "General Merchandise" are no longer permissible. CBP officers utilize the
information required by the 24-Hour Rule to identify potential terrorist threats before the container arrives in a US port. CBP will issue "Do Not Load" container messages for violators and will deny access to US ports for those who disregard the instructions (CBP, 2003a).
The Trade Act of 2002 authorizes CBP to receive advanced electronic cargo information (including information from the 24-hour Rule for maritime cargo). The Automated Targeting System (ATS) is an internet-based tool, which serves as a basis for all CBP targeting efforts. ATS performs a review of cargo shipments to identify high-risk shipments using a rules-based algorithm to highlight potential risk, patterns, and targets. ATS also assists in identifying which containers should be physically inspected (CBP,
2003b)
1.1.5 Container Security Initiative (CSI)
CBP announced the Container Security Initiative (CSI) in January 2002. CSI is a program that stations US Customs officers at international seaports to work with foreign
host government counterparts to screen and potentially inspect US-bound containers. The first port began operations in March 2002. CSI's mission is to target and pre-screen containers abroad and to develop additional investigative leads related to the terrorist threat to US-bound cargo. CSI's container selection data is largely compiled from information provided by the 24-Hour Rule in ATS (CBP, 2008a).
CSI is based on three core pillars:
1) Use of automated targeting algorithms and intelligence to assist in the
identification container shipments that pose substantial risk to the United States 2) Evaluation of containers of concern prior to loading the shipment on a vessel
bound for the United States
3) Utilization of technology, such as NII technology, to allow for the screening of cargo without hindering the movement of trade
At the end of FY2007 the CSI program consisted of 58 ports, which ship 86% of US-bound maritime cargo (DHS, 2008).
1.1.6 Megaports Initiative
The Department of Energy's (DOE) National Nuclear Security Administration (NNSA) has actively installed nuclear detection equipment in Russia and the former Soviet Union since the mid-1990s through the Second Line of Defense (SLD) Program. The Megaports Initiative, formalized in 2003, is part of the SLD program and focuses on both high-risk and high-volume ports. The Megaports Initiative targets ports based on their attractiveness to nuclear smugglers, including considerations for connectivity between ports of interest.
The Megaports Initiative is unique in its desire to scan the maximum amount of global traffic as possible at each port regardless of origin or destination. Their mission is
accomplished by providing or engaging in cost-sharing efforts for radiation detection equipment and through training local entities to operate the equipment and associated communication systems through government-to-government agreements. Maintenance plans are often funded in part by the Megaports Initiative for a finite period. At the end of FY2007 the Megaports Initiative was operational in 12 ports in 12 countries (National Nuclear Security Administration [NNSA], 2008a).
1.1.7 Security and Prosperity Partnership (SPP)
Launched in March of 2005, the Security and Prosperity Partnership (SPP) of North America is a trilateral agreement between the US, Canada and Mexico to increase security through cooperation and information sharing. Although the agreement includes
issues for protecting the environment, food supply and public health, a significant focus is on POE security, both physical and through harmonized inspection data and processes. The US agreed to provide Mexico with radiation detection equipment at major
commercial and passenger POEs into North America to prevent the smuggling of nuclear/radiological materials. Under this commitment, Mexico's customs agency,
Aduana Mexico, expressed a desire to engage with the Department of Energy (DOE) Megaports Initiative to install radiation detection equipment at 4 of their largest container
seaports (Security and Prosperity Partnership, 2006).
1.1.8 Security and Accountability for Every (SAFE) Port Act
On September 30, 2006, the Security and Accountability for Every (SAFE) Port Act was signed into law. The Act requires several programs to increase US port security.
Some of the programs it codified included CSI and C-TPAT. It required 100% radiation scanning of import containers by December 31, 2007. The SAFE Port Act also
established a pilot program for 100% scanning of US-bound cargo overseas. The 9/11 Commission Act amended a SAFE Port Act provision on scanning all United States bound containers at foreign ports (9/11 Act, 2007).
1.1.9 Secure Freight Initiative (SFI)
On December 7, 2006, DOE and DHS jointly developed and deployed the Secure Freight Initiative (SFI), which builds on the concepts of both DHS's Container Security Initiative and DOE's Megaports Initiative. The goal of SFI is to establish an integrated inspection system with the international shipping community to secure the global supply
chain against terrorist exploitation. Phase 1 of SFI is separated into 2 categories (CBP, 2007b).
1) 100% Scanning - Full Deployment Pilot a. Port Qasim, Pakistan
b. Puerto Cortes, Honduras c. Southampton, United Kingdom 2) Limited Capacity Deployment Pilot
a. Port Salalah, Oman
b. Port of Singapore (Brahni Terminal) c. Port Busan, Korea (Gamman Terminal) d. Port of Hong Kong, China (Modem Terminal)
DHS allocated approximately $30 million to fund NII equipment, while the DOE's National Nuclear Security Administration (NNSA) contributed $30 million to install radiation portal monitors and communications systems, including optical character recognition (OCR) to electronically identify container number (DHS, 2006). The data collected will be assessed by the local customs, US CSI teams at the port, and it will also be transmitted electronically for analysis by the DHS National Targeting Center in Virginia.
The first 3 full deployment ports are part of the SAFE Port Act required pilot project, which aims to inspect 100% of US-bound containers for nuclear and radiological materials prior to departure. The pilot phase ran from October 12, 2007 to April 30, 2008. Under Section 232(c) of the SAFE Port Act, DHS is required to write a report to
further deployments. This document, which describes the costs of deployment and lessons learned from the technology, communication systems, logistics and operations, was not released to the public at the time this thesis was written.
The US government will attempt to screen the highest percentage possible at the last 4 ports to assess the challenges presented by ports with high percentages of
transshipment containers and high-volume ports. The pilot phase for SFI ends April 30, 2008 for these ports as well. The high-level inspection and information process for SFI is illustrated in Figure 2.
1.1.10 "10 + 2" Initiative
US Customs and Border Protection is currently reviewing comments submitted on March 18, 2008 by importers and carriers in regards to additional data requirements for US-bound cargo. The currently proposed "10+2" regulation would require importers and carriers to submit data via a CBP-approved electronic data interchange (EDI) system. The Initiative aims to increase the accuracy and breadth of data for the ATS system in
adherence to the SAFE Port Act of 2006.
The "10" portion of the requirement refers to the "Importer Security Filing" that must be filed 24 hours prior to the lading of containers. It contains the following importer elements:
1.) Manufacturer/Supplier's full name and address 2.) Seller/Owner's full name and address
3.) Buyer/Owner's full name and address 4.) Ship-to name and address
5.) Container stuffing location
6.) Consolidator/Stuffer's full name and address
7.) Importer of record number/foreign trade zone applicant identification number 8.) Consignee number(s)
9.) Country of origin
10.) Commodity harmonized tariff schedule number, which provides detailed information on the contents of the container (6-digit tariff schedule number)
The "+2" portion requires the carrier to provide a vessel stowage plan (10 elements) 48 hours before vessel departure from the last foreign port and a container status message (6 elements). The stowage plan physically identifies the location of a container on the vessel. The status message provides an update as the box changes state from being full (loaded with cargo) or empty (CBP, 2008b).
1.1.11 HR 1, the "Implementing Recommendations of the 9/11 Commission
Act of 2007" - Section 1701 (9/11 Act)
The 9/11 Act was signed on August 3, 2007 by US President George W. Bush. Appendix A includes the full text of Section 1701. The 9/11 Act amends Section 232(b) of the SAFE Port Act. It states that a container loaded on a vessel in a foreign port shall not enter the United States (either directly or via a foreign port) unless the container was
scanned by non-intrusive imaging (NII) equipment and radiation detection equipment. The implementation deadline is July 1, 2012, with a 2 year renewable extension available
for ports that have any 2 of the following existing conditions:
1) Systems for container scanning are not available for purchase and installation
2) Systems for container scanning do not have sufficiently low false alarm rates for use in the supply chain
3) Systems for container scanning cannot be deployed or operated because a port does not have the physical characteristics to install such systems 4) Systems for container scanning cannot be integrated with existing systems
5) Use of systems that are available to scan containers will significantly impact trade capacity and the flow of cargo
6) Systems for container scanning do not adequately provide an automated notification of questionable or high-risk cargo to signify the need for
secondary inspection by appropriately trained personnel
1.2
9/11 Act Compliance Equipment
This section supplies a basic level of understanding of the equipment necessary to carry out the required scanning by radiation detection equipment and non-intrusive imaging. It also discusses equipment safety concerns and throughput volumes.
Equipment includes radiation portal monitors (RPMs), also called radiation scanners, non-intrusive inspection (NII) equipment, also called X-ray or radiography equipment, and secondary inspection equipment. RPMs are passive systems, which detect the presence of gamma and neutron radiation. Thus, no safety concerns exist during regular equipment operations. DHS and DOE programs, including the Megaports
Initiative, Secure Freight Initiative and the domestic seaport deployments all utilize "plastic" polyvinyl toluene scintillator (PVT) RPMs.
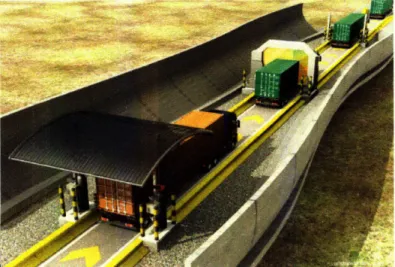
Figure 3 illustrates RPM equipment viewed by our thesis team during a site visit in January 2008 at the operational SFI port of Puerto Cortes, Honduras, which is 1 of the original 3 ports selected for the SAFE Port Act and SFI pilot project. Typically the RPM pillars (master and slave pillars) are positioned between 4.5 to 5 meters (14.5 to 19.5 feet)
apart. Additionally, bollards are necessary to prevent vehicles from damaging the equipment.
Equipment specifications are unique to individual vendors. TSA Systems, which is the vendor utilized in Puerto Cortes, Honduras, quotes an ideal operating speed of 5 mph (8 km/hr) for their RPM. The RPM provides immediate alarm identification, allowing continuous flow of vehicles through the portals. TSA Systems (2008) quotes a false alarm rate of "typically less than 1 in 1000". Often, false alarm rates are confused with innocent alarm rates. Innocent alarms refer to cargo containing radioactive material, which are correctly identified by the RPM, but the content does not pose a security threat. This naturally occurring radioactive material (NORM) is seen in commonly shipped goods such as fertilizer, kitty litter, or foods containing potassium (i.e. bananas or
avocados).
NII imaging systems emits x-rays or gamma rays to produce an image of a container's content. Gamma-ray radiography uses a radioactive source, such as Cobalt-60 or Cesium-137. The x-ray systems typically use a energy spectrum ranging from 2.5 to 9 MeV. These units can be fixed, semi-fixed or mobile. Some operate by the driver passing through the equipment, while others require the driver to exit the vehicle while the unit passes over the container or the conveyance is pulled through the NII system. Caution
must be exercised when utilizing Nil equipment, as healthy safety concerns associated with radiation emissions need to be addressed in accordance with national, local and union regulations.
In the US, CBP officers must stay within the radiation dose limits of the general public, which are 100 millirems (mrem) per year and 50 microrem (jprem) per hour (note: 1 mrem = 1000 gtrem). US radiation workers can receive 2,000 mrem in any year, and no more than 5,000 mrem within 1 year during a 5 year period (DHS, 2007). The SAIC P7500, which is utilized in some of the SFI pilot projects, is a 7.5 MeV drive-through NII system. Its safety features include an emergency stop button and an access control area of 8 m by 5m, which receive a radiation dosage of 2 mrem/hr (SAIC, 2007). Based on the standards for US non-radiation workers, equipment operators and truck drivers would only be allowed in this area 50 hours per year (DHS, 2007). The radiation dose to the cargo is 411 grem at 5mph (8 km per hour). The P7500 also advertises a throughput rate of 150 vehicles an hour, assuming that 40 foot containers are passing through at 8 to 13 km/hr (5 to 8 mph) (SAIC, 2007). Some non-drive through NII allow for approximately 20 containers per hour. It is important to note that NII equipment currently does not produce any alarm type notification for inspectors, thus container release is dependent on the review time. The throughput rates quoted assume that no hold/release decision is being made.
Examples of NII imaging equipment utilized at the same SFI installation are shown in below in Figure 4, with sample imaging capabilities in Figure 5.
Figure 4. Sample NII Equipment at SFI location
Figure 5. Sample NII Image (Source: CBP, 2007)
Secondary inspection equipment is utilized to isolate the location of a radioactive source and to perform isotopic identification of the container's contents. This secondary equipment assists the operator in differentiating between NORM and weapons grade materials of concern. Identification equipment ranges from hand-held radioactive isotope identification devices (RIIDs) to large-scale advanced spectroscopic portals (ASP). ASPs provide a means of "automating" secondary inspection, in exchange for a high capital investment in new technology. Due to the expense and experimental stage of ASP, they are not included in our cost-analysis. However, high-volume ports or ports with limited or expensive personnel resources should carefully consider utilizing ASP technology. Popular hand-held RIIDs include lightweight (5.5 lbs) sodium iodide (Nal) units and high-resolution germanium detectors (40 lbs).
Several vendors offer secondary inspection equipment. The equipment in Figure 6 provides a sample used at international sites under DOE's Megaports Initiative NNSA, 2007). The TSA gamma detector survey meter locates radioactive sources and measure their intensities. The personal radiation pager is worn by inspectors to assist in identifying a safe working distance from a radioactive source. The Thermo IdentiFINDER unit is an example of a sodium-iodide RIID and the Ortec is a high-purity Germanium (HPGe) based RIID. Figure 7 illustrates an ASP portal, which is an example of the type of technology that is currently deployed at the SFI port of Southampton, United Kingdom (Rutherford, 2008).
m
TSA Survey Meter Personel Detectors Ra (pacrsg)ipation Themf o
Figure 6. Sample Hand-held Equipment for SFI Ports
Figure 7. Advanced Spectroscopic Portal (ASP)
(Source: Defense Dept. Doubles Spending on Systems
that Don't Deliver, from
http://www.cnet.com/military-tech/?keyword=GAO ed)
I
2
REVIEW OF LITERATURE
This review of literature focuses first on investigating the current landscape of industry opinions regarding the 9/11 Act published in periodicals and trade press. Next, this section examines academic, governmental and industry research and analyses on quantifying delays and costs associated with the 9/11 Act and other scanning-related security measures. In summary, fervent industry opposition exists for the 9/11 Act, with the inclusion of cost and delay estimates; however, calculations to support and
substantiate these claims were not found.
2.1
Documented Industry Opinions
Implications on PortsThe 100% scanning requirements of the 9/11 Act was met with industry criticism. The World Shipping Council (WSC) estimated that US$500 billion of commerce will be affected by the legislation and had even expressed the possibility of discontinuing the
carriage of American imports to minimize costs. "We just won't carry American imports," said Christopher Koch, President of the WSC (Zin, 2007, para. 15). Port operations in Asia are predicted to suffer the largest impact of the new law, since over 50% of US imports are loaded in China (World Shipping Council, 2007, para. 23). John Lu, Chairman of the Asian Shipper's Council commented that the legislation will "slow down cargo and cause a gridlock at ports" (Zin, 2007, para. 13).
Critics of the legislation also contend that the technology to scan the 11 million US-bound containers at foreign ports is currently not sufficient to satisfy the requirement. During a hearing in March 2007 by the House Homeland Security Appropriations
Field Operations Jayson Ahern said that due to the limits of technology and the
investment and maintenance costs required, it is "an impossible task... It's unrealistic at this point in time" (Kimery, 2007, para. 22).
An article in the Wall Street Journal by John Miller (2007) highlighted several port concerns. According to Miller, analysts believed that each port would have to buy 1
to 10 scanners to comply with the new legislation. The European Union (EU) estimated the average initialization cost for a port to be around US$100 million, a cost too large to be justifiable for some of the smaller ports with very few US-bound containers. Even if ports are financially capable of purchasing the scanning equipment, they are faced with other problems such as space constraints. Lieven Muylaert, a Belgian customs official commented, "We're looking at billions [of euros] in extra spending" (Miller, 2007, para.
5).
Miller believes that the 9/11 Act might even change the dynamics of port
competition. Larger ports might strive to gain new business from smaller and older ports that are financially strained to meet the requirements of 100% scanning. The EU has expressed concerns that Asian ports, being newer and more compact, would have an advantage in meeting the requirements. Smaller ports might have to stop shipping to the US altogether if they are unable to bear the financial costs of installation. "The law will
force us to stop shipping to the US, unless we can attract a lot more customers, which would justify investment in the equipment," says Philippe Revel, manager for the
shipping terminal at Dunkirk, France (Miller, 2007, para. 14). The EU has also threatened to impose reciprocity and require US to scan all European-bound containers if the 100% scanning legislation is not altered.
It is important to note that none of these hypotheses for port implications included calculations to validate the claims.
Cost and Delay Concerns
Industry had expressed concerns over how the 9/11 Act can potentially cause delays in supply chains and increase the costs of maritime logistics. Nicolette van der Jagt, Secretary General of the European Shippers' Council said, "Business will be paying the lion's share of providing the equipment, but I suspect the biggest cost to shippers will be the cost of delays" (Zin, 2007, para. 3). The Global Shippers' Forum also commented that the legislation will result in "enormous costs to users, suppliers and ultimately
consumers" (Zin, 2007, para. 12).
Some feared that the 9/11 Act would result in container bottlenecks and would place a tremendous burden on ports that have limited space or capital to install the
scanning equipment. Supply Chain Digest Editor, Dan Gilmore, commented, "Imagine your worst line to get through security at an airport. Now imagine the luggage scanners aren't working quite right, and they have to keep running bags through repeated times. Can you imagine the delays? That's a real possibility for cargo with the law and the current technology for this as it stands" (Supply Chain Digest, 2007, para. 10). Van der Jagt also commented, "We already have the prospect of worsening congestion in many of the world's container ports as volumes grow year on year... One can only imagine the huge queues that will form when every container has to run through radiation and image scanners" (Zin, 2007, para. 4).
There are also concerns about innocent alarms. Gerald Epstein, a homeland security expert for the Center for Strategic and International Studies, commented, '"There are an awful lot of things that are radioactive out there... If all you're doing is looking [at the] total amount of radiation, you are going to be opening up a lot of boxes and finding kitty litter" (Zin, 2007, para. 10).
Regarding the cost of scanning, the port of Hong Kong estimated in 2005, a cost of $6.50 per container, which will be passed down to shippers (Supply Chain Digest, 2005, para. 7). Dr. Stephen Flynn, in the Far Eastern Economic Review, provided another estimate that 100% scanning can be "put in place in every major container port in the world at a cost of [US]$1.5 billion, or approximately [US]$15 per container" (Flynn, 2006, para. 40). Flynn went on to say that the total cost of 100% scanning, including containers with tamper-proof seals are "likely to reach [US]$50 to [US]$100 per container depending on the number of containers an importer has and the complexity of its supply chain." He further contends that even if it ends up being an additional US$100 per container, it would only "raise the average price of cargo moved by... only 0.06% (Flynn, 2006, para. 41)."
It is interesting to note that even though many parties give estimates for the delays and costs associated with the 9/11 Act, none of them have officially released their
approach for quantifying the numbers that they have presented.
2.2
Delay Estimates
No academic literature was found that directly addressed delay issues associated with the implementation of the 9/11 Act. Literature addressing delay concerns due to
security scanning mainly focused on transshipment ports or US ports of entry. This section discusses some of the literature and their relevance in the context of the 9/11 Act.
Scanning at US Ports of Entry
Martonosi, Ortiz and Willis (2005) from RAND Corporation conducted a cost-benefit analysis of 100% scanning of all incoming sea containers using X-ray cargo
density imaging (NII) equipment at US ports. This scenario differs from the 9/11 Act since scanning is performed on incoming containers at US ports of entry whereas the 9/11 Act requires containers to be scanned at foreign ports prior to loading. The 9/11 Act also requires radiation scanning (RPM) in addition to X-ray imaging (NII). The difference between these scenarios is important to note because the results from their analysis have often been misquoted by industry to oppose the 9/11 Act. Nonetheless, their analysis
serves as a useful reference for the development of an approach to quantify delays associated with the 9/11 Act.
As part of the cost-benefit analysis, Martonosi et al created a queuing model to estimate delays associated with conducting 100% scanning of import containers. Their queuing model assumed that containers arrive at a US port of entry according to a Poisson process. The Poisson process is typically used to model independent random events, in this case - container arrivals, occurring over a period of time. The containers that arrive are then selected for scanning according to a Bernoulli random process with a probability p. For the base case, p is assumed to be 5% and for the case of 100%
scanning and be sent for secondary inspection. This process follows another Bernoulli random process with probabilityf, representing the alarm rate.
According to Martonosi et al, the average container arrival rate of 157 US ports of entry is 1,474 TEU/hr with arrival rates for a prototypical large port being 365 TEU/hr and that for a small port being 50 TEU/hr. For their analysis of scanning delays, Martonosi et al divided the 157 ports into 2 groups - top 30 ports and remaining 127 ports. The average container arrival rate within each group is calculated and replicated
across the number of ports in the group. Scanning and secondary inspection times were assumed to be exponentially distributed with means of 3 minutes/TEU and 5
hours/container respectively. The number of scanners and inspection teams deployed at each port were assumed to be the minimum required to ensure a stable queue.
Averaging all delay results across the 157 ports, Martonosi et al estimated that the expected delay would increase from 0.5 hour per TEU under current operations to 5.5 hours per TEU under a regime of 100% scanning of import containers. Their estimate of a 5.5 hour delay associated with 100% scanning has been widely misquoted by industry to oppose the 9/11 Act (Zin, 2008, para. 12).
It is important to note that the results presented by Martonosi et al are based on all US imports being scanned on arrival whereas the 9/11 Act requires only US-bound
containers, which represent a subset of a foreign port's total exports, to be scanned before departure. Due to difference in scanning volumes, the estimated delay of 5.5 hours may be overstated and inappropriate to estimate potential delays caused by the 9/11 Act.
Additionally, the Martonosi et al model assigned the number of scanners and inspection stations to be the minimum required to guarantee a stable queue, which might
have contributed to an inflated delay estimate. Their assumption of a 3 minute/TEU scanning rate may also be too long under the current state-of-the art equipment. Today, vendors of scanning equipment affirm that containers can pass through scanning at a rate as low as 60 seconds/TEU.
Scanning at Transshipment Ports
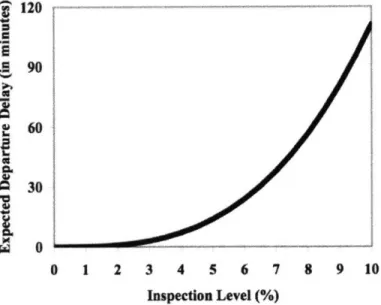
Erera, Lewis and White (2003) proposed a methodology to estimate the delays associated with the scanning of transshipment containers. Their study defines scanning as the use of both RPMs and NII equipment. Erera et al made use of a best-first heuristic search method to optimize the movement of containers between the inbound ships, the container yards, the inspection areas and outbound ships. The results of their model are shown below in Figure 8. Erera et al estimated that the expected departure delay for an outbound vessel increases exponentially with inspection level. At 10% inspection of transshipment containers, departure delay is approximately 110 minutes.
120
M 90
i60
0 1 2 3 4 5 6 7 8 9 10
Inspection Level (%)
Figure 8. Departure Delays Based on Inspection Level (Source: "Optimization
approaches for efficient container security operations at transshipment seaports" by Erera, Lewis and White, 2003)
In their analysis, Erera et al made several model assumptions. First, they assumed that all containers pass through security scanning with no alarms, and no containers are
sent for secondary inspection. This is highly unlikely. In practice, approximately 5% of containers that go through primary scanning will trigger an alarm. In many of these alarm cases, the containers' contents include NORM, such as porcelain and kitty litter. These legitimate "innocent" alarms will be confirmed using proper training and manifest details, resulting in some delays. In other cases where the alarms cannot be adjudicated, the
containers will be sent for tertiary inspection.
Second, they assumed that the container stowage plan could not be changed. In reality, containers delayed by inspections can typically be stowed in a newly designated
location. A container that is delayed significantly will simply miss its sailings since the vessel will most likely not wait for delayed containers.
Due to these assumptions, Erera et al clarified that their presented results do not represent what is likely to happen at a given port, but simply an example of the type of information their methodology can provide.
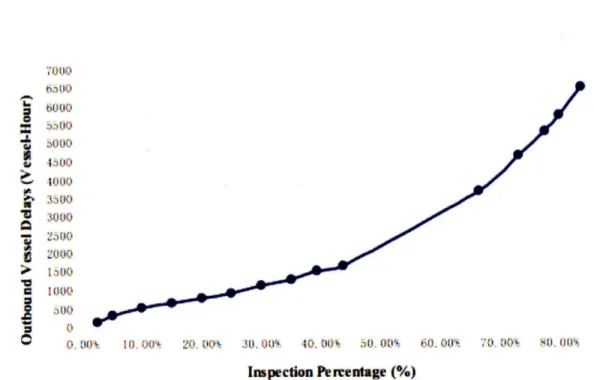
Lee, Song and Raguramam (2004) expanded on Erera, Lewis and White's paper by including vessel arrivals and departures, size-related weight, risk-index of containers,
multi-layered security inspection system and queuing analysis for inspection servers. They proposed mathematical formulations to characterize container operations at a combined transshipment and import-export port. To solve the mathematical problem, they made use of a genetic algorithm to minimize the cost of delays for outbound vessels by varying the percentage of container scanning and the sequence of container
L rJtJO I U no00 UO g zol1 1G
DO . OtYý M Wy JU. 00D1 40. Ob' 5a1. 00S, 60. 01A 70. DO' ýD., 0D'*
Impection Pmentage (%)
Figure 9. Vessel Delays Based on Inspection Percentages (Source: "An optimization approach to security
operations toward sustainable seaport" by Lee, Raguraman and Song, 2004)
Lee et al's results show that delays increase exponentially with increasing inspection percentage. At an inspection percentage of 80%, outbound vessel delay is up to 7000 vessel-hours. Note that the difference in magnitude of the delays measured by Lee et al and Erera et al is due to the difference in measurement units. Lee et al used "vessel-hours" as a measure of delay whereas Erera et al measured delay in terms of "minutes delayed per vessel." Although Lee, Song and Raguramam relaxed some of the assumptions in Lewis, Erera and White's paper, they maintained the assumption that outbound vessels will wait for delayed containers, leading to delayed departures.
2.3
Cost Estimates
Government BudgetsEstimating the cost of port security is a difficult task. Ports vary based on physical layouts, jurisdictional controls, cargo operations (imports, exports and transshipments) and container yard configurations driven by equipment-based storage requirements. It is
often said that if you have seen one port, then you have seen one port - warning not to assume that concepts are easily transferable from one port to another.
The Congressional Budget Office (CBO) estimates that the 9/11 Act will cost US$21 billion to implement over the first five-year period. Additionally, the private sector will be impacted by over US$131 million per year; however, none of the assumptions or calculations for these estimates are included. These cost are likely to exceed the annual threshold allowed for private sector mandated expenses from a single policy, which is US$131 million for 2007 (9/11 Act, 2007). Several groups have
attempted to estimate the cost of installing, maintaining and responding to port security related equipment.
As reported by the US Government Accountability Office (2005), DOE estimated that each port costs on average US$15 million for the Megaports Initiative in 2003, which includes the installation of radiation detection equipment, associated communication systems, personnel training and a finite maintenance plan. In 2005, DHS projected that the installation of 3,034 domestic RPMs across land and seaport POEs by 2009 would cost US$1.9 billion (GAO, 2006). The GAO has consistently questioned the approach used by both DOE and DHS in their estimations. GAO found that the DOE estimates were heavily based on DOE's experience in Russian land-border, airport, and seaport security installations that began in 1995. GAO contended that the cost of installation varies by the port location, size, physical layout and the level of port infrastructure and cannot be benchmarked against a single country (GAO, 2007a).
In 2007, DOE re-evaluated their costing approach and separated cost estimates by port size, resulting in a new range of US$2.6 million to US$30.4 million per port. DOE
and DHS each contributed US$15 million for the 3 pilot installations under the SAFE Port Act, which represents 3 ports of varying sizes (GAO, 2007a). These SAFE Port Act ports began operational testing on October 12, 2007 and a report is due to Congress on their observations by April 2008 (GAO, 2007b). This report; however, is not currently available to the public.
GAO also broached the issue of the lack of specificity in the 9/11 Act, which does not identify the party(s) that will pay for scanning equipment, communications
equipment, infrastructure investments, or manning requirements. CBO's cost analysis assumed that this cost would be born by the United States (GAO, 2007a).
Academic Research
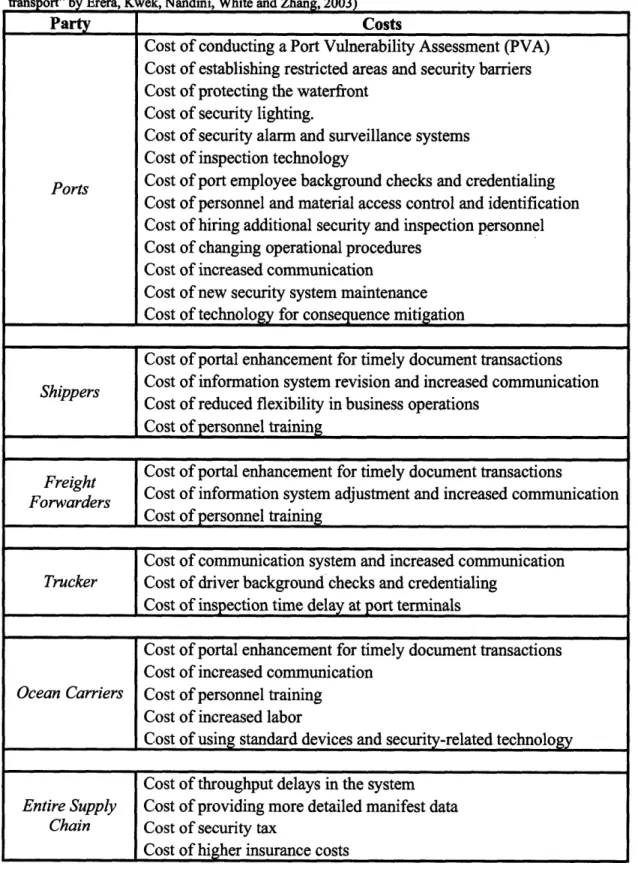
Erera, Kwek, Nandini, White and Zhang (2003) proposed a framework to categorize all costs that may be incurred along the entire supply chain as a result of new security measures at seaports. They identified 5 major maritime stakeholders - ports, shippers, freight forwarders, truckers and ocean carriers - and listed the potential costs that these stakeholders may have to incur to comply with new security measures.
Erera et al's categorization of costs serves as a good checklist to help industry to consider the costs associated with port security measures like the 9/11 Act. However, some of the indirect costs are difficult to quantify. For example, no straightforward method exists to estimate how insurance costs and security taxes would increase. Other costs, such reduced flexibility in business operations are difficult to assign a financial value.
Table 1. List of Maritime Stakeholders and Potential Costs (Compiled from "Cost of security for sea cargo
transport" by Erera, Kwek, Nandini, White and Zhang,. 2003)
Costs
Cost of conducting a Port Vulnerability Assessment (PVA) Cost of establishing restricted areas and security barriers Cost of protecting the waterfront
Cost of security lighting.
Cost of security alarm and surveillance systems Cost of inspection technology
Cost of port employee background checks and credentialing Cost of personnel and material access control and identification Cost of hiring additional security and inspection personnel Cost of changing operational procedures
Cost of increased communication
Cost of new security system maintenance Cost of technology for consequence mitigation
Cost of portal enhancement for timely document transactions
Shippers Cost of information system revision and increased communication Cost of reduced flexibility in business operations
Cost of personnel training
Freight Cost of portal enhancement for timely document transactions
F reight
Forwarders Cost of information system adjustment and increased communication Cost of personnel training
Cost of communication system and increased communication
Trucker Cost of driver background checks and credentialing Cost of inspection time delay at port terminals
Cost of portal enhancement for timely document transactions Cost of increased communication
Ocean Carriers Cost of personnel training
Cost of increased labor
Cost of using standard devices and security-related technology Cost of throughput delays in the system
Entire Supply Cost of providing more detailed manifest data
Chain Cost of security tax
Cost of higher insurance costs Party
Ports
2.4
Case Study of Port of Rotterdam
In April 2004, under the Megaports Initiative, the US government funded the deployment of 4 RPMs at the ECT Delta terminal at the port of Rotterdam (NNSA, 2006). Following the success of the pilot project, the GAO reported in 2005 that the Dutch Environment Ministry decided to self-fund full deployment for RPMs at the port's remaining terminals (GAO, 2005). The Dutch government installed 40 RPMs, which began operations in April 2007, covering a reported 100% scanning of road and rail import and export traffic at the port and occasionally transshipment cargo. They utilized NII equipment only for high-risk containers at a centralized location since the port finds NII to be "expensive haulage and time-consuming" (Mollema, 2007). The duration of time from pilot testing to full operation is important to note when considering the timeline for implementing the 9/11 Act, which is approximately 4 years from the publishing of this thesis.
The proposal and tendering process of the full RPM implementation project at the port of Rotterdam began in the summer of 2004. Installation of the 40 RPMs, 3 mobile RPM units and a second central alarm station spanned April 2005 to 2006. The scanning system became fully operational in April 2007. The entire installation process took nearly 3 years, not including the pilot project, which began with the signing of a Declaration of Principles in August of 2003 (Bonewit, 2007).
The port of Rotterdam is currently conducting a study on automated container inspection lanes, which will employ the following technologies:
1) RPM 2) NII
3) Radio-Frequency Identification (RFID) 4) Optical Character Recognition(OCR) cameras
The automated container inspection lane aims to maintain a continuous speed of 13 km/hour. The physical layout of the RPM and NII is similar to the proposal within this thesis. The Rotterdam project is a joint study by the port authority, customs and port businesses. Figure 10 illustrates their conceptual design for the automated container inspection lane.
Figure 10. Fort of Rotterdam Conceptual Scanning (Source:
http://www.iaph2007.com/Presentations/IAPH2007-Mollema.pdf
The port of Rotterdam anticipates that 2 inspection lanes could serve the entire port. The proposed areas where the lanes will be located are marked in Figure 11. In 2006 the port of Rotterdam was the last port of loading for 433,955 US-bound TEUs, with a total throughput of 9.7 million TEUs (MARAD, 2007).
http://www 11. iaph2007.com/Presentations/IAPH2007-Mollema.pdf UMAU.
http://www.iaph2007.com/Presentations/IAPH2007-Mollema.pdf
The port of Rotterdam serves as an example of a large port that takes a proactive posture on security. It also proves that RPM scanning can be achieved on a large-scale
import/export operation utilizing existing technology, with adequate physical space and full port coordination. The Rotterdam automated scanning case study highlights the importance of all the port stakeholders' involvement early in the planning stage of security projects.
3
TAXONOMY
This section first discusses the opinions of several of the top US importers regarding the 9/11 Act. Interviews revealed 2 primary concerns among industry:
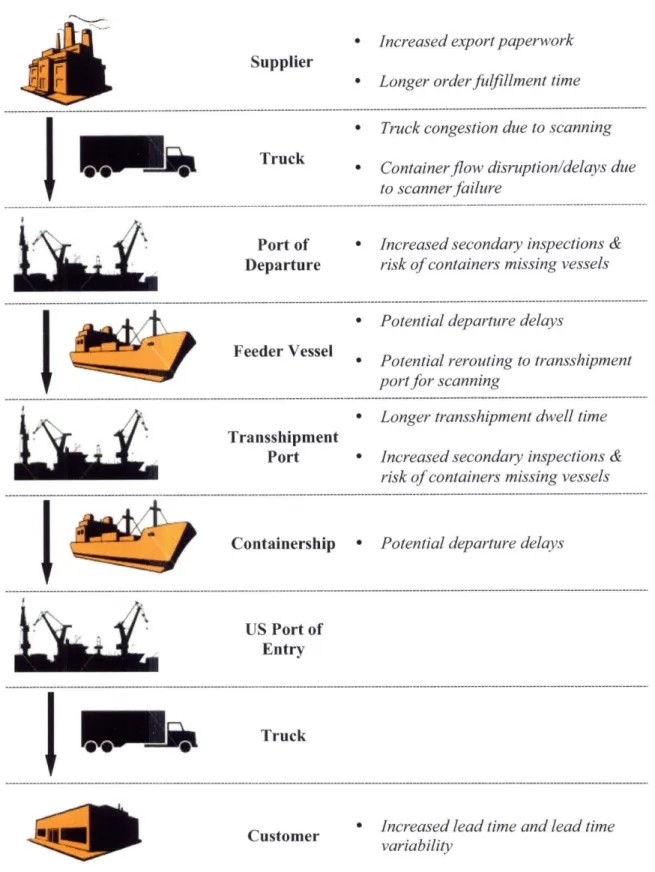
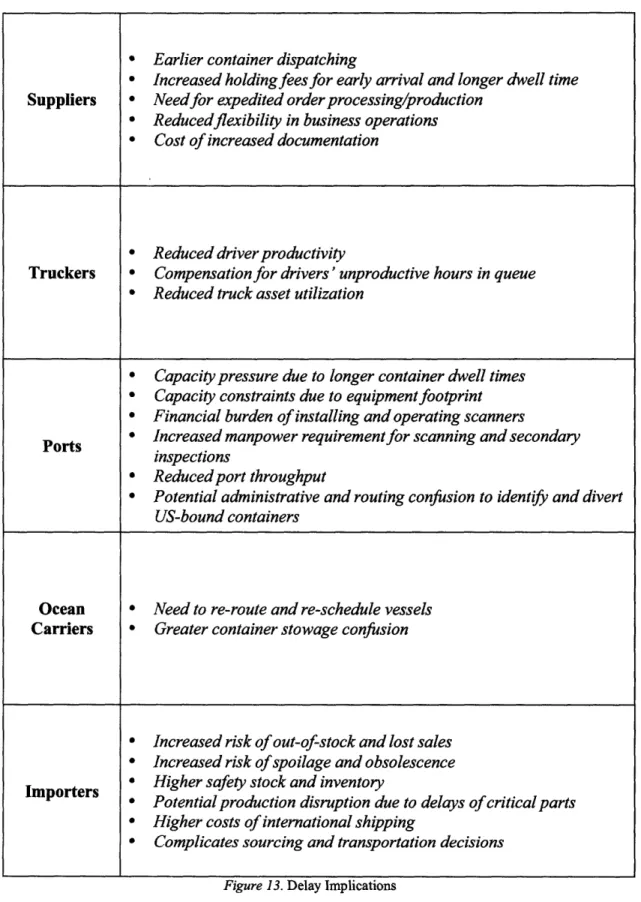
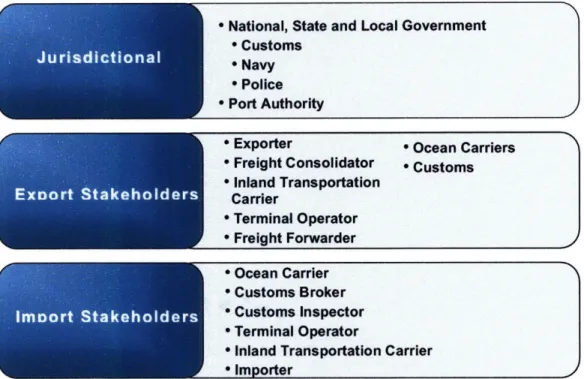
1) How is the 9/11 Act going to affect supply chains and operations? 2) Who will pay for the implementation and how much will it cost? Based on interviews, port visits and our own research, a framework was developed to analyze these 2 concerns. Section 3.2 explores the first concern by identifying potential delays along the supply chain and how the delays will affect the players along the chain. Section 3.3 discusses the second concern by laying out the stakeholders and their willingness to bear or pass down the costs of implementation.
3.1
Interviews with Top 10 Importers
Interviews were conducted with several of the top 10 importers in the US to get a better understanding of their opinions on current security programs and how the newly passed 9/11 Act can potentially affect their operations in the future. Several security initiatives have been implemented in the wake of the terrorist attacks of September 11, 2001. The majority of the importers stated that delays are not currently an issue in the maritime transportation mode even with these addition new initiatives. Sporadic delays have occurred due to increased scanning and inspection but not of great concern.
C-TPA T
Many companies have committed to C-TPAT with high expectations, investing substantial time and capital to fulfill the requirements. However, reactions to C-TPAT participation have been mixed. Some companies assert that they have seen tangible
decreases in delays and inspections while others observe that their inspection rates are unchanged. One importer conjectured that only companies that ship out of high-risk countries or carry high-risk cargo would receive tangible benefits from C-TPAT compliance since their inspection levels would be significantly reduced. For other companies shipping common cargo from low-risk countries, their inspection levels were low to begin with and thus, C-TPAT compliance had not resulted in reduced inspections. Another importer had an opposing view, believing that companies with a good cross-section of cargo origins would probably benefit the most from C-TPAT compliance whereas those that consistently source from high-risk locations, such as Colombia or the Indian subcontinent will continue to face scanning and inspections. None of the importers interviewed had performed a cost-benefit analysis to determine whether a tangible or financial benefit was realized by their company in direct association to their investments in the C-TPAT program. However, some importers are finding it increasingly difficult to justify the costs of C-TPAT compliance.
Opinions and Analysis of 9/11 Act
Most of the companies interviewed had a good understanding of the requirements in the 9/11 Act. They knew that the legislation requires both RPM and NII scanning and identified several of the key caveats and ambiguities in the legislation as mentioned in Section 1.1.11.
All of the companies interviewed were opposed to the 100% scanning legislation, citing increased delays and costs as 2 of the major problems with the 9/11 Act.