HAL Id: hal-02163828
https://hal.archives-ouvertes.fr/hal-02163828
Submitted on 11 Sep 2019
HAL is a multi-disciplinary open access
archive for the deposit and dissemination of
sci-entific research documents, whether they are
pub-lished or not. The documents may come from
teaching and research institutions in France or
abroad, or from public or private research centers.
L’archive ouverte pluridisciplinaire HAL, est
destinée au dépôt et à la diffusion de documents
scientifiques de niveau recherche, publiés ou non,
émanant des établissements d’enseignement et de
recherche français ou étrangers, des laboratoires
publics ou privés.
Distributed under a Creative Commons Attribution| 4.0 International License
Pacific Ocean
Sophie Bonnet, Julien Dekaezemacker, Kendra Turk-Kubo, Thierry Moutin,
Robert Hamersley, Olivier Grosso, Jonathan Zehr, Douglas Capone
To cite this version:
Sophie Bonnet, Julien Dekaezemacker, Kendra Turk-Kubo, Thierry Moutin, Robert Hamersley, et
al.. Aphotic N2 Fixation in the Eastern Tropical South Pacific Ocean. PLoS ONE, Public Library of
Science, 2013, 8 (12), pp.e81265. �10.1371/journal.pone.0081265�. �hal-02163828�
Ocean
Sophie Bonnet1*, Julien Dekaezemacker1¤, Kendra A. Turk-Kubo2, Thierry Moutin1, Robert M. Hamersley3, Olivier Grosso1, Jonathan P. Zehr2, Douglas G. Capone4
1 Mediterranean Institute of Oceanography, Institut de Recherche pour le De´veloppement, Aix Marseille Universite´, Centre National de la Recherche Scientifique Marseille/ Noumea, New Caledonia, France,2 Department of Ocean Sciences, University of California Santa Cruz, Santa Cruz, California, United States of America, 3 Environmental Studies, Soka University of America, Aliso Viejo, California, United States of America,4 Department of Biological Sciences, University of Southern California, Los Angeles, California, United States of America
Abstract
We examined rates of N2fixation from the surface to 2000 m depth in the Eastern Tropical South Pacific (ETSP) during El
Nin˜o (2010) and La Nin˜a (2011). Replicated vertical profiles performed under oxygen-free conditions show that N2fixation
takes place both in euphotic and aphotic waters, with rates reaching 155 to 509mmol N m22d21in 2010 and 24614 to 118687mmol N m22d21 in 2011. In the aphotic layers, volumetric N2 fixation rates were relatively low
(,1.00 nmol N L21d21), but when integrated over the whole aphotic layer, they accounted for 87–90% of total rates (euphotic+aphotic) for the two cruises. Phylogenetic studies performed in microcosms experiments confirm the presence of diazotrophs in the deep waters of the Oxygen Minimum Zone (OMZ), which were comprised of non-cyanobacterial diazotrophs affiliated with nifH clusters 1K (predominantly comprised of a-proteobacteria), 1G (predominantly comprised of c-proteobacteria), and 3 (sulfate reducing genera of the d-proteobacteria and Clostridium spp., Vibrio spp.). Organic and inorganic nutrient addition bioassays revealed that amino acids significantly stimulated N2fixation in the core of the OMZ at
all stations tested and as did simple carbohydrates at stations located nearest the coast of Peru/Chile. The episodic supply of these substrates from upper layers are hypothesized to explain the observed variability of N2fixation in the ETSP.
Citation: Bonnet S, Dekaezemacker J, Turk-Kubo KA, Moutin T, Hamersley RM, et al. (2013) Aphotic N2Fixation in the Eastern Tropical South Pacific Ocean. PLoS
ONE 8(12): e81265. doi:10.1371/journal.pone.0081265 Editor: Stefan Bertilsson, Uppsala University, Sweden
Received August 13, 2013; Accepted October 10, 2013; Published December 12, 2013
Copyright: ß 2013 Bonnet et al. This is an open-access article distributed under the terms of the Creative Commons Attribution License, which permits unrestricted use, distribution, and reproduction in any medium, provided the original author and source are credited.
Funding: Funding agencies: Institut National des Sciences de l’Univers (Humboldt-Fix project, PI: S. Bonnet), France, and the National Science Foundation (division of OCEan sciences 0850801, PI: D.G Capone), USA. The funders had no role in study design, data collection and analysis, decision to publish, or preparation of the manuscript.
Competing Interests: The authors have declared that no competing interests exist. * E-mail: [email protected]
¤ Current address: Max Planck Institute for Marine Microbiology, Bremen, Germany
Introduction
The efficiency of oceanic carbon (C) sequestration depends upon many factors, among which is the availability of nutrients to support phytoplankton growth in the illuminated surface ocean. In particular, large amounts of nitrogen (N) are required, as it is an essential component of proteins, nucleic acids and other cellular constituents. Dissolved N in the form of nitrate (NO32) or
ammonium (NH4+) is directly usable for growth, but
concentra-tions of fixed N are low (,1mmol L21) and often growth-limiting in most of the open ocean euphotic zone [1]. Dinitrogen (N2) gas
dissolved in seawater, on the other hand, is very abundant in the euphotic zone (ca. 450mmol L21) and could constitute a nearly inexhaustible N source for the marine biota. However, only certain prokaryotic ‘N2-fixers’ (or diazotrophs) are able to use this
N source since they can break the triple bond between the two N atoms of the N2molecule, and convert it into a usable form (i.e.
NH3) for assimilation.
The focus of much recent marine N2fixation research has been
on the NO32-poor environments of the surface tropical ocean,
where it may sustain up to 50% of ‘new’ primary production [2,3]. The filamentous cyanobacterium Trichodesmium spp., which is
widespread in the tropical ocean and has a macroscopic growth form [4], may fix from 60 [5] to 80 Tg of N per year [6]. Until the last decade, this organism was the focus of the bulk of research as it is conspicuous and easily collected [4]. However, since then, studies of the abundance and diversity of the nifH gene required for N2fixation have elucidated the importance of unicellular
pico-and nano-planktonic cyanobacteria [7,8], extending the geograph-ical extent of diazotrophy beyond tropgeograph-ical waters [9], and potentially narrowing the gap between direct measurements and geochemically-based global marine N fixation rates [5]. These molecular tools have also revealed the presence of putative non-cyanobacterial diazotrophs (possessing and potentially expressing the nifH gene) in diverse aquatic environments [10], including surface seawater, hydrothermal vents and lakes [11] and references therein). In marine waters, these diazotrophs seem to be almost ubiquitous [12], but few studies e.g. [13,14] have focused on these non-cyanobacterial diazotrophs, and our knowledge of their distribution in the ocean and their biogeo-chemical importance for the marine N budget is still very limited. The N budget for the global ocean is poorly constrained, with some suggestions that sinks (denitrification and anammox) exceed sources (N2 fixation) [15]. The high energy and iron (Fe)
requirements [16,17] of the N2fixation reaction have implied that
this process occurs mainly in the large oligotrophic areas of the ocean that are depleted in fixed N, and where fixing N2gives an
ecological advantage. This may be particularly the case in areas which receive high Fe-rich Saharan dust such as the North Atlantic [18], or which are under the influence of terrigenous and submarine Fe sources, such as the North Pacific near Hawaii [19,20] or the South West Pacific [20,21,22,23]. However, recent studies [24,25] have hypothesized that N2fixation might also be
associated with denitrified surface waters over oxygen minimum zones (OMZs), which have measureable NO32, but are depleted
in N relative to phosphorus (P). This hypothesis has been recently confirmed in the coastal surface waters of the Peruvian-Chilean upwelling [26,27] as well as throughout the eastern tropical South Pacific Ocean (ETSP) [28], where depth-integrated rates over the upper water column were comparable to those found in subtropical gyres. nifH sequences recovered from these areas within the upper 200 m of the ocean were mostly non-cyanobacterial and clustered with known heterotrophic sequences [26]. This led us to explore N2fixation in the aphotic zone of the
ETSP.
Previous studies conducted in surface waters of the ETSP indicated that N2fixation was highly variable in space and time,
with depth-integrated rates varying from 10- to 30-fold between cruises performed at the same locations [26,28]. Although the activities of heterotrophic diazotrophs might potentially be contributing to this high temporal variability, very few studies have examined the regulation of N2 fixation by heterotrophic
bacteria in marine waters. Organic C availability has been hypothesized to control marine heterotrophic N2fixation [29] as a
consequence of the high energy requirements of the reaction, but, to our knowledge, the effect of organic molecules on heterotrophic N2fixation has never been studied in OMZs.
In this study, we investigated N2fixation along a transect across
the ETSP in 2010 and 2011 through temperature, oxygen and nutrient gradients. We quantified N2fixation throughout the 0 to
2000 m depth range in order to evaluate its potential biogeo-chemical impact on the marine N budget, and we conducted aphotic nutrient addition bioassays in the core of the aphotic OMZ in order to investigate which nutrients might control N2
fixation in this environment. We also phylogenetically character-ized the diazotrophs community composition in the core of the OMZ and how it responded to some of the nutrient amendments.
Methods
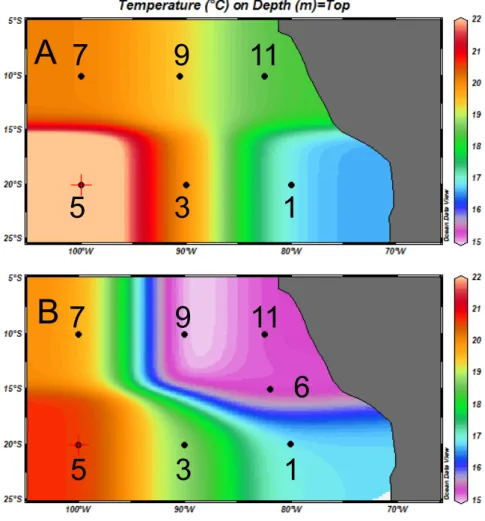
Our research was carried out during two cruises in the ETSP, aboard the R/V Atlantis in February and March 2010, and the R/V Melville in March and April 2011. Experiments were performed along a transect that began in northern Chile and ran west along 20uS, from the nutrient-rich waters at 82uW to the more oligotrophic and low-NO3
2
waters at 100uW, and returned along 10uS (Fig. 1). No specific permissions were required for these locations/activities as both cruises took place in international waters. This study did not involve endangered or protected species. The coastal waters of this region of the ETSP are characterized by a permanent wind-driven upwelling of cool nutrient-replete water (Fig. 1), which supports high primary productivity and a persistent subsurface OMZ, where O2
concentrations are low enough to induce the anaerobic processes of the N cycle, such as denitrification and anammox [30,31,32]. These O2-deficient waters are carried by Eckman transport
westward beyond the limit of our transect. The ETSP is subjected to the inter-annual climactic variability of the El Nin˜o-Southern
Oscillation (ENSO), which modulates the strength of the upwelling. The 2010 cruise took place during an El Nin˜o event (Multivariate ENSO index: 1.52) and the 2011 cruise during a La Nin˜a event (Mutivariate ENSO index: 21.49) [NOAA Climate Diagnostics Center, Wolter and Timlin (1993, 1998); data from http://www.esrl.noaa.gov/psd/enso/mei.table.html].
Hydrographic and nutrient measurements
Hydrographic and nutrient measurements were performed at 6 stations in 2010 and 7 stations in 2011 (Fig. 1). Vertical profiles of temperature, chlorophyll a, fluorescence and dissolved oxygen were obtained using a Seabird 911 plus CTD equipped with a model 43 oxygen sensor and a Wetlabs ECO-AFL/FL chlorophyll fluorometer. Oxygen values were calibrated by micro-Winkler [33]. Seawater samples were collected at selected depths using a rosette equipped with 24 12-L Niskin bottles. Samples for inorganic nutrient (NO3
2
and PO4 32
concentrations) analyses were collected in acid-washed 20-mL plastic bottles. Nutrient concentrations were determined using standard colorimetric techniques [34] on a Bran Luebbe AA3 autoanalyzer. Detection limits for the procedures were 0.02 to 0.52mmol L21 for NOx
[nitrite (NO22)+NO32] and 0.005 to 0.083mmol L21for PO432.
Vertical profiles of N2fixation
Rates of N2 fixation were measured using the 15
N2 tracer
method [35]. Water samples were dispensed into acid-leached 4.5-L polycarbonate bottles. During the 2010 cruise, this work was exploratory and unreplicated (except for nutrient addition bioassays, see below) measurements were made at 12 to 14 depths between the surface and 2000 m at stations 1, 9 and 11. During the 2011 cruise, samples were collected at stations 1, 5, 6, 7, 9 and 11 in triplicates at 12 depths between the surface and 2000 m, with a specific focus on O2gradients. Depths were chosen in order
to sample the oxycline, at least 3 depths within the core of the OMZ, as well as an additional 3 within the second increasing oxygen concentrations below the OMZ. Most of these depths were located in the aphotic zone.
On both cruises, specific care was taken to avoid O2
contamination and to perform incubations under strict oxygen-free conditions as described in [36]. Briefly, before each profile, the 36 4.5-L bottles were filled with deionized water, then the deionized water was flushed with argon and finally filled with seawater via tubing into the bottom of the argon-filled bottles to minimize gas exchange. Bottles were then closed with septa and spiked with 3 mL15N2(99 atom % EURISO-TOP) via a gas-tight
syringe. Each bottle was shaken 30 times to fragment the15N2
bubble and facilitate its dissolution. Recent work has suggested that with this method, there may be incomplete equilibration of the added15N
2gas bubble with the seawater sample, resulting in a
dissolved15N2concentration in the sample that is lower than the
equilibrium value assumed in the calculation of15N2fixation rates
[37]. This may lead to a potential underestimate of N2fixation
rates [38,39]. Therefore, the values given in the present study should be considered as minimum estimates (discussed below). Bottles were then incubated either in on-deck incubators at irradiances specific from the sampling depth using blue screening and cooled with circulating surface seawater (photic samples), or in dark rooms at 12uC or 5uC depending of the sampling depth. After incubation, the triplicate bottles from each depth were filtered onto precombusted (4 h at 450uC) 25-mm GF/F filters. Filters were stored at 220uC until the end of the cruise, then dried for 24 h at 60uC and stored dry until mass spectrometric analysis. During the 2011 cruise, an extra 4.5-L bottle was collected at each depth of the profile, spiked with15N2and immediately filtered in
order to determine the initial background d15N in the particulate organic N (PON) for calculations of N2fixation rates. During the
2010 cruise, the value of d15N in air (0.00366) was used as a reference value for these calculations, which may introduce a potential bias, except at Station 1 where15N atom % of the PON at depth was available.
Nutrient addition bioassays in the core of the OMZ
Nutrient addition bioassays of N2 fixation were performed at
one single depth in the core of the OMZ (based on O2-CTD
profiles) at 3 stations (Stations 5, 7 and 11, between 140- and 450-m depth) during the 2010 cruise and at 6 stations (Stations 1, 5, 6, 7, 9 and 11, between 320- and 475-m depth-) during the 2011 cruise. All experiments were performed in triplicate and under strict oxygen-free conditions (using the argon flushing method described above) to avoid inhibition of N2 fixation by oxygen.
Immediately after collection, bottles were capped with septa and amended with nutrients via syringes. During the 2010 cruise, at each of the 3 stations, triplicate bottles were left as unamended controls, and a second set of bottles was amended with glucose to obtain a final concentration of 10mmol L21. During the 2011 cruise, triplicate bottles were left as unamended controls, and a second set of triplicate bottles was amended with a mixture of three simple carbohydrate substrates (39% glucose, 29% acetate and 32% pyruvate, final total concentration of 1mmol
carbohydrate L-1) to test the effect of a source of dissolved organic C (DOC) on N2fixation. A third set was amended with a mixture
of three amino acids as a source of both DOC and dissolved organic N (DON) (20% leucine, 23% glutamic acid and 56% alanine) to reach a final concentration of 1mmol amino acids L21. The proportion of each carbohydrate and amino-acid has been chosen in order to add the same quantity of organic C in the two treatments (4mmol L21). A fourth set was amended with ATP (source of dissolved organic P, DOP) to reach a final concentration of 1 nmol L21, and a fifth set was amended with 8mmol L21of NO32 to test its potential inhibitory effect on heterotrophic N2
fixation. Bottles were then incubated in a dark cold room at 12uC for 24 h in order to leave enough time to induce any potential nutrient stimulation. After 24 h, all bottles were spiked with15N2
as described above, and incubation was continued under the same conditions for an additional 24 h. At the end of each incubation, the three treatments and control replicates were filtered as described above in order to measure N2 fixation rates, and
amplification of the nifH gene (2010 only). Samples were also collected from bottles sacrificed at time zero in order to quantify background NOxand PO432concentrations at every station. NOx
concentrations were also measured just after the NO3 2
additions in order to confirm the added concentrations at the beginning of the incubations (data not shown).
Figure 1. Location of stations superimposed upon seawater temperature at 75-m-depth. (A) the 2010 cruise (R/V Atlantis), and (B) the 2011 cruise (R/V Melville). Station numbering are identical to that of 2 companion papers [28,42]).
Mass spectrometric analyses
The isotopic enrichment of particulate N after the incubation of seawater with15N2was measured by continuous flow isotope ratio
mass spectrometry of pelletized filters (Europa Integra-CN), calibrated every 10 samples using reference material (International Atomic Energy Agency [AIEA], Analytical Quality Control Services). The linearity of15N atom % as a function of increasing sample PON mass was verified as detailed in [40] on both natural and15N enriched material. This step is critical in ultra-oligotrophic environments or deep waters, where suspended PON concentrations are low. 15N atom % was linear (Fisher test, p,0.01) between 0.20 and 39mmol N, which is within the range of PON measured in all of our samples (0.27 to 4.91mmole N depending on the station and depth).
Detection and quantification limits for particulate N were calculated daily, as 3 times and 10 times the standard deviation of
15
N analysis of blanks, respectively. Detection limits ranged from 0.10 to 0.17mmole N, and quantification limits ranged from 0.13 to 0.26mmole N, depending on the station. The 15N isotope enrichment of a sample was calculated using the 15N atom % excess over the 15N atom % in samples taken from the same station at time zero, which was determined on bottles filtered immediately after adding15N2. We considered the results to be
significant when15N excess enrichments were greater than 3 times the standard deviation obtained with ten AIEA references (15N
atom % .0.0005). The quantification limit of N2fixation in this
study was 0.01 nmol L21d21. If only one of the 3 replicate measurements was quantifiable, the average of the 3 replicates was
forced equal to zero, in order to provide minimum estimates of N2
fixation.
In order to determine areal rates, N2 fixation measurements
were trapezoidally depth-integrated from the summed products of the average of two adjacent rate measurements (including those equal to zero) with the depth interval between them. The standard deviation on the triplicates (2011 cruise) was also used for a trapezoidally depth-integration in order to obtain the standard deviation on integrated rates.
Statistical analysis
Controls and experimental nutrient treatments were compared using a 2-tailed non parametric Mann-Whitney mean comparison test (n = 3, a = 0.05, unpaired samples).
Phylogenetic characterization of diazotrophs
In order to characterize the potential diazotrophs present in the core of the OMZ that responded to the addition of glucose, nucleic acid samples were collected from triplicate bioassays during the 2010 cruise for amplification of the nifH gene. At T0 and at the termination of the experiment, bottles were immediately filtered as described in [41] onto 25-mm, 0.2-mm Supor filters (GE Osmotics, Minnetonka, MN), and immediately flash frozen in liquid N2. All
filters were stored at 280uC thereafter.
DNA samples were extracted using the Qiagen All Prep kit (Valencia, CA), according to manufacturer’s guidelines, with modifications to include freeze-thaw and bead-beating steps to
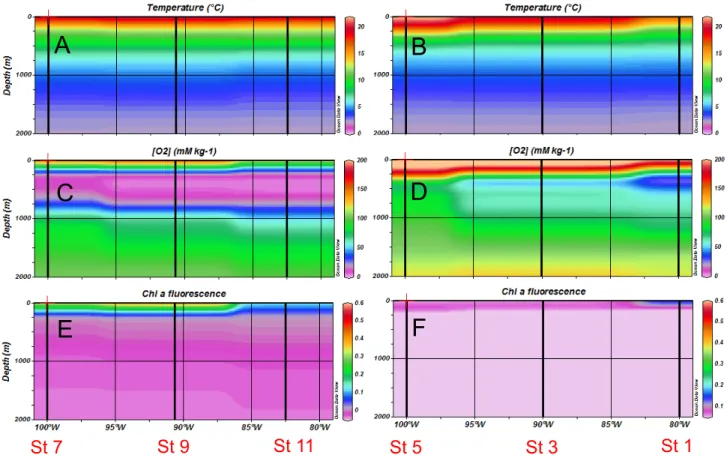
Figure 2. Horizontal and vertical distributions of hydrological and biogeochemical parameters during the 2010 cruise (R/V Atlantis). (A, B) temperature, (C, D) dissolved oxygen, (E, F) chlorophyll fluorescence in the northern transect (left panels) and southern transect (right panels).
disrupt the cells [42]. The wash steps of this protocol were automated using a QIAcube (Qiagen). DNA extracts were stored at 220uC until use.
Nested PCR amplification targeting a fragment of the nifH gene was carried out using degenerate primers nifH1-4 [43,44] using the reaction and thermocycling conditions described in [42]. Ampli-cons were purified using a QIAquick Gel Extraction Kit (Qiagen) and cloned using the TOPO TA Cloning Kit for Sequencing (Invitrogen, Carlsbad, CA) according to the manufacturer’s guidelines. Purified recombinant plasmids containing partial nifH sequences were recovered from clones using the Montage Plasmid Miniprep96 Kit (Millipore, Billerica, MA) and sequenced using Sanger technology at the UC Berkeley DNA Sequencing Center. All DNA extractions and as PCR preparations were performed in a PCR-amplicon free facility at UCSC described in [42].
Sequencher 5.1 sequence analysis software (Gene Codes Corporation, Ann Arbor, MI) was used to remove vector contamination and low-quality reads from raw sequences. All resulting partial nifH sequences were imported into a curated nifH database (http://pmc.ucsc.edu/,wwwzehr/research/database/), translated into amino acid sequences, aligned to the existing hidden Markov model alignment using the Quick Align function, and nucleic acids were realigned to the aligned amino acids in the ARB software environment. Sequences generated from the nutrient addition bioassays were clustered at 97% nucleotide similarity using CD-HIT-EST [45]. Nucleic acid trees used the Jukes-Candor correction for branch length. Trees generated in ARB were exported into iTOL for the display of associated metadata. All partial nifH sequences recovered were submitted to Genbank under Accession numbers KF515738 - KF515848.
Results
Hydrographic and nutrient profiles
During both cruises, oceanographic conditions were consistent with active wind-driven upwelling off the coast of Northern Chile and Peru (Fig. 1), associated with a vertically and horizontally extensive OMZ (Fig. 2C and 3B). During the 2010 cruise (R/V Atlantis, El Nin˜o), the zone of decreasing dissolved oxygen (oxycline) was located at ca. 70–100 m at stations 11 and 9, and suboxic conditions ([O2] ,20mmol kg21 [46]) were reached at
125 m and 130 m respectively at these two stations. The suboxic zone expanded from 130–750 m at Station 11. During the 2011 cruise (Fig. 3B, R/V Melville, La Nin˜a conditions), the oxycline was shallower (ca. 30–40 m) at stations 11 and 9 compared to 2010, and suboxic conditions were reached at 65 m at both stations. The suboxic zone expanded from 70–850 m at Station 11. On the southern transect (Stations 1, 3 and 5, Fig. 2D and 4B), the water column was well oxygenated during both cruises (ca. 200mmol kg21) over the first 200 m, and O2 concentrations
decreased with depth to reach minimum values of ca. 80mmol kg21at 300 m depth.
During the 2011 cruise, on the northern transect at Stations 7 and 9 (Fig. 3D), surface NOxconcentrations were ca. 6mmol L21,
increased quickly with depth (nitracline ca. 50 m) to reach ca. 37mmol L21in the core of the OMZ. Close to the coast (Station 11), the nitracline was shallower (ca. 25 m) than that of the oceanic stations, and NOx concentrations increased quickly to reach
concentrations of ca. 30–40mmol L21 in the core of the OMZ. On the southern transect (Fig. 4D), NOxconcentrations were ca.
0.10mmol L21 over the first 100 m of the water column. The depth of the nitracline was 85 m and 130 m at Stations 1 and 5,
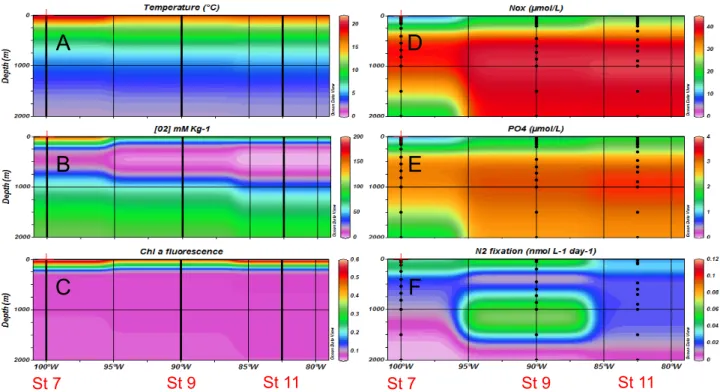
Figure 3. Horizontal and vertical distributions of hydrological and biogeochemical parameters during the 2011 cruise (R/V Melville) – Northern transect (106S). (A) temperature, (B) dissolved oxygen, (C) chlorophyll a fluorescence, (D) NO32 concentrations, (E) PO432
concentrations, (F) Mean N2fixation rates (n = 3).
respectively, and concentrations increased progressively to reach values of ca. 40mmol L21below the oxygen minimum and down to 2000 m. PO4concentrations (Fig. 3E and 4E) followed the same
trend as NOxin the northern transect, with surface concentrations
of 0.40–0.60mmol L21 and a shallower phosphocline near the coast (Station 11) compared to open ocean stations. In the southern transect, surface PO4 concentrations were lower
com-pared to those of the northern transect (0.03–0.30mmol L21) and the phosphocline was located deeper (ca. 150 m).
During both cruises, chorophyll a fluorescence (Fig. 2E–F, 3C, 4C) was highest at stations located along the northern transect. It was much lower in 2010 compared to 2011, especially at stations nearest the coast of Peru on the Northern transect.
Vertical profiles (0 to 2000 m) of N2fixation
During the 2010 cruise, N2fixation was detected in 34 of 40
samples representing all three stations (Fig. 5). The overall range of rates measured over the cruise was from the detection limit to 0.80 nmol L21d21. The highest rates were measured in O2
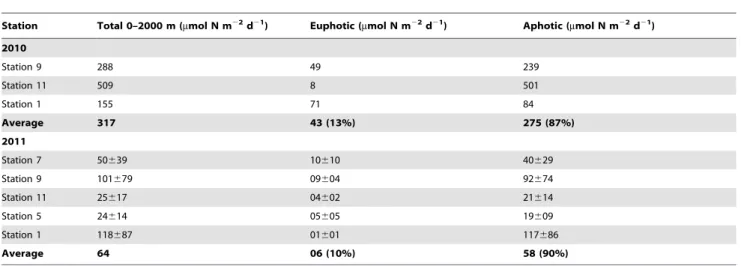
deficient waters at the oxyclines or in the core of the OMZ (Fig. 5), and reached values up to 0.57 nmol L21d21, 0.6 nmol L21d21 and 0.53 nmol L21d21 at Stations 1, 11 and 9, respectively. Below the OMZ, rates were always measurable and were at 1000 m depth 0.16 nmol L21d21, 0.23 nmol L21d21 and 0.06 nmol L21d21 at these stations. Integrated rates over the 2000 m water column were 155mmol N m22d21 at Station 1, 288mmol N m22d21 at Station 9, and 509mmol N m22d21at Station 11 (Table 1). The average integrated rate over the cruise was 317mmol N m22d21. Integrated N2 fixation rates in the
aphotic zone accounted for 73 to 99% of the rates measured over the entire water column depending on the station. When considering all the stations, the average areal rate in the aphotic zone was 87% of the total rate over the entire water column (Table 1).
During the 2011 cruise, N2 fixation rates were significantly
greater than zero in 140 of the 216 measurements made (Fig. 3F, Fig. 6). The overall range of rates measured was from detection limit to 0.2660.12 nmol L21d21. In the northern transect (Fig. 3F, Fig. 6), the highest rates of N2fixation over the vertical
profiles were measured in the oxycline as in 2010, and mean rates (n = 3) reached 0.1560.13 nmol L21d21 at Station 7 and 0.1960.28 nmol L21d21at Station 9 at the oxycline. At station 11, the highest rates were found in surface waters (0.2260.19 nmol L21d21) but rates at the oxycline were also measurable (0.0660.03 nmol L21d21). Below the OMZ (ca. 400–2000 m), rates were also measurable and ranged from 0.0060.01 to 0.2160.13 nmol L21d21, the highest rates being measured at station 9 at 1000 m depth. In the southern transect (Fig. 4F, Fig. 6), the rates ranged from 0.0060.01 to 0.2660.12 nmol L21d21, the highest rates being observed at Station 1 just below the second oxycline at 750 m depth. At this station, aphotic rates were measurable at 450 m, 750 m, 1000 m and 1500 m depth. Integrated rates over the 2000 m water column ranged from 24614mmol m22d21 at Station 5 to 118687mmol m22d21 at Station 1 (Table 1). The average integrated rates over the 2011 cruise were 64mmol m22d21. Integrated N2fixation rates over the aphotic zone accounted for Figure 4. Horizontal and vertical distributions of hydrological and biogeochemical parameters during the 2011 cruise (R/V Melville) – Southern transect (206S). (A) temperature, (B) dissolved oxygen, (C) chlorophyll a fluorescence, (D) NO32 concentrations, (E) PO4
32
concentrations, (F) Mean N2fixation rates (n = 3).
90% of total rates measured over the entire water column (Table 1) over the cruise.
Nutrient addition bioassays in the core of the OMZ
During the 2010 cruise, nutrient concentrations in the core of the OMZ (140 to 450 m) where experiments were performed ranged from 24.0 to 37.0mmol L21 for NOx and 1.20 and
3.00mmol L21 for PO432(data not shown). Mean N2 fixation
rates in control bottles at Stations 5, 7 and 11 were 0.1260.02, 0.1660.04 and 0.1760.02 nmol N L21d21, respectively (n = 3; Fig. 7). At the 2 most oceanic Stations 5 and 7, glucose amendments did not result in any significant increase of N2
fixation (p.0.05). At Station 11 near the Peruvian coast, glucose amendments resulted in a significant (p,0.05) increase in N2 fixation rates by a factor of 3.2, to reach 0.566
0.04 nmol N L21d21(Fig. 7).
During the 2011 cruise, nutrient concentrations in the core of the OMZ (320 to 475 m) where experiments were performed ranged between 33.12 and 38.72mmol L21 for NOx and from
2.33 to 3.03mmol L21 for PO4. Mean N2 fixation rates in the
control bottles ranged from 0.0060.01 at Station 11 to 0.0760.01 and 0.0760.04 nmol N L21d21at Stations 9 and 5, respectively (n = 3; Fig. 8). At Stations 1 and 9, N2 fixation rates were
significantly (p,0.05) stimulated by simple carbohydrate additions
Figure 5. Vertical profiles (0–2000 m) of N2fixation rates (nmol L 21
d21) during the 2010 cruise (R/V Atlantis). Open circles: individual N2fixation measurements at each depth. Black line: dissolved oxygen concentrations (mmol Kg21) divided by 500 to fit on the same scale.
doi:10.1371/journal.pone.0081265.g005
Table 1. Areal N2fixation rates (mmol N m22d21) calculated from measurements performed in the euphotic and aphotic zones
during the 2010 and 2011 cruises.
Station Total 0–2000 m (mmol N m22d21) Euphotic (mmol N m22d21) Aphotic (mmol N m22d21) 2010 Station 9 288 49 239 Station 11 509 8 501 Station 1 155 71 84 Average 317 43 (13%) 275 (87%) 2011 Station 7 50639 10610 40629 Station 9 101679 09604 92674 Station 11 25617 04602 21614 Station 5 24614 05605 19609 Station 1 118687 01601 117686 Average 64 06 (10%) 58 (90%) Uncertainties are derived from the standard errors of triplicate measurements for the 2011 cruise.
by a factor of 5.5 and 4.6, to reach 0.1460.07 and 0.3060.30 nmol N L21d21, respectively (Fig. 8). At all stations, the addition of amino acids resulted in a significant (p,0.05) increase in N2 fixation rates, by a factor of 4 to 7. The highest
rates were reached at Station 9 after AA additions with 0.2760.08 nmol N L21d21. ATP addition never resulted in any significant increase of N2fixation rates (p.0.05) and NO32
additions never resulted in any decrease of N2 fixation rates
(p.0.05). However, at Station 7, NO32 additions resulted in a
significant (p,0.05) increase of N2 fixation by a factor of 7 to
0.0760.02 nmol N L21d21.
Phylogenetic characterization of diazotrophs in 2010 glucose addition bioassays
A full phylogenetic characterization of diazotrophs in the upper 200 m of the ETSP water column was performed during the same cruises and is detailed in a companion paper [42]. In this study we report the complementary phylogenetic characterization of samples from the core of the OMZ (Fig. 8). Partial nifH sequences recovered during deep glucose addition bioassays during 2010 at Stations 5, 7 and 11, indicated that diazotrophs were present in the
deep waters of the OMZ. The diazotrophic community was comprised of non-cyanobacterial diazotrophs affiliated with nifH clusters 1K (predominantly comprised of a-proteobacteria), 1G (predominantly comprised of c-proteobacteria), and 3 (sulfate reducing genera of the d-proteobacteria as well Clostridium spp., Vibrio spp, etc.) (Fig. 9). Clear differences exist between OMZ diazotrophic community composition at each station. The Station 5 community was dominated by nifH cluster 1K sequences, many of which are closely related to a phylotype (94–97% nucleic acid similarity) originally reported at Hydrostation S (North Atlantic) from a depth of 1000 m (BT5167A10 (DQ481253) [47]), although a few putative c-proteobacteral (1G) sequences were also recovered that affiliated with cETSP3, a cluster recovered from the ETSP [42]. Although the lowest number of total sequences was recovered from Station 7, they were mainly affiliated with cluster 1G, along with a few 1K sequences. In contrast, clone libraries from Station 11 were dominated by cluster 3 sequences, along with a few 1G sequences, but no 1K sequences (Fig. 9).
Despite being prevalent in clone libraries, both aETSP1 and cIII-ETSP groups were not detected at abundances great enough to quantify using TaqmanH qPCR assays during the course of
Figure 6. Vertical profiles (0–2000 m) of N2fixation rates (nmol L 21
d21) during the 2011 cruise (R/V Melville). Open circles: individual N2fixation measurements at each depth. Black line: dissolved oxygen concentrations (mmol Kg21) divided by 500 to fit on the same scale.
these experiments (see Figuer S1 in File S1). Because the abundances of these targets did not increase as a result of nutrient amendments, it is difficult to speculate whether any of them were responsible for the increased N2fixation rates we measured after
glucose addition.
Discussion
Active N2fixation in deep and NO3-rich waters of the
ETSP
In this study, we measured during 2 consecutive years N2
fixation in surface waters affected by the OMZ, but reveal that N2
fixation below the euphotic zone is more important: 87 and 90% of total areal N2 fixation were measured in the aphotic zone in
2010 and 2011, respectively. In these aphotic layers, volumetric N2
fixation rates were relatively low (,1.00 nmol N L21d21), but when integrated over the whole aphotic layer, they ranged from 84 to 501mmol N m22d21 in 2010 and from 19609 to 117686mmol N m22d21 in 2011 (Table 1). In 2011, rate measurements were replicated (triplicates) and calculations performed very carefully using a real T0 for every depth. These 2011 measurements are thus more reliable than those measured in 2010. These measurements in aphotic waters add new information compared previously published studies [26,28] in the area. The hypotheses explaining the persistence of N2fixation in these high
NOx(ca. 40mmol L 21
) environments are largely developed in the companion paper [28]. First, fixed N loss processes occur in this region [31,48], creating a deficit of N relative to P, which is potentially favorable for N2fixation [24]. In particular, anammox
removes NH4+, which has an immediate inhibitory effect on N2
fixation [49]. Secondly, N2fixation is an anaerobic process [50]
due to the irreversible inactivation of the nitrogenase enzyme by O2[51]. It is possible that the low O2concentrations in the OMZ
and down to 2000 m contribute to the protection of nitrogenase [52], decrease the energy cost of maintaining intracellular
Figure 7. Effect of glucose additions on mean N2fixation rates
(n = 3) during the Atlantis cruise (2010). Data from bioassay experiments performed in the OMZ at Stations 5, 7 and 11. The error bars represent the standard deviation of triplicate incubations. Treatment means were compared using the 2-tailed non parametric Mann-Whitney mean comparison test (n = 3, a = 0.05, unpaired sam-ples). Means that are significantly different (p,0.05) from the control are labeled with an asterisk.
doi:10.1371/journal.pone.0081265.g007
Figure 8. Effects of nutrient additions on mean N2fixation rates (n = 3) during the Melville cruise (2011) (C: Control, AA: Amino
acids, CH: Carbohydrates). Data from bioassay experiments performed in the OMZ at (A) Stations 7, (B) Station 9, (C) Station 11, (D) Station 5, (E) Station 1, and (F) Station 6 during the Melville cruise (2011). The error bars represent the standard deviation of triplicate incubations. Treatment means were compared using the 2-tailed non parametric Mann-Whitney mean comparison test (n = 3, a = 0.05, unpaired samples). Means that were significantly different (p,0.05) from the control are labeled with an asterisk.
anaerobiosis [53], and thus facilitate N2 fixation. Finally, redox
conditions in the OMZ favor the equilibrium formation of the most bioavailable form of iron Fe2+ [54], which could help to
support the high Fe requirements of nitrogenase [16,17]. For these reasons, OMZs and deeper waters may represent favorable ecological niches for N2fixation, as shown in this study.
Potential impacts on N budgets in the ETSP
Aphotic N2fixation is currently ignored in oceanic N budgets
based on biogeochemical rate measurements. However, this dataset indicates that rates in aphotic waters of the ETSP are of the same order of magnitude than those commonly measured in the tropical and sub-tropical NO32-depleted surface ocean
(Table 2), where N2 fixation has commonly been studied. The
potential significance of the N2 fixation rates measured in our
study can be evaluated by comparing them with fixed N losses via denitrification and anammox measured in the same region. N losses in the ETSP have been estimated to range from 9 to 25 Tg N yr21 (Table 3, [31,55,56,57]) in the upwelling area extending 175 km offshore, and 1860 km along the Peruvian-Chilean coast with an area extant of 3.2661011m2[31,56]. If we consider the same spatial extent for N2fixation, this process could potentially
add 0.04 to 0.9 Tg N yr21 (Table 3), counterbalancing 0.16 to 10% of the estimated N loss processes in this area (calculations have been performed only using numbers from the 2011). However, the anammox and denitrification measurements men-tioned above [31] were performed under conditions of excess
substrate availability and therefore represent maximum estimates of N loss rates. In contrast, the 15N
2 bubble method used to
quantify N2fixation [58] may underestimate rates [38,39].
Secondly, denitrification and anammox are restricted to subsurface suboxic or anoxic waters [59], whereas N2 fixation is
not. Further, denitrification and anammox appear to be restricted to the coastal upwelling system within ca. 175 km of the Peruvian-Chilean coast (the few data available at open ocean stations indicate that N loss processes were below detection limit during the 2010 cruise, Hamersley et al., (Pers. Com.)). N2 fixation in the
ETSP is active over a much greater spatial extent than N loss processes. If we consider the spatial extent of the N2
fixation measurements in the ETSP covered by our cruises (2.2361012m2), we estimate that N2fixation could potentially add
0.3 to 1 Tg N to the system in this area and therefore could compensate for up to 11% of the estimated N loss processes in the upwelling region of the ETSP (Table 3) (without taking into account methodological under- or overestimations). These esti-mates of N gains are the minimum ones calculated by taking into account only the 2011 cruise. If we take into account the 2010 cruise, N2fixation could potentially compensate up to 0.3 to 7 Tg
N to the system (Table 3) (i.e. up to 78% of N losses). N2fixation in
deep waters of the ETSP may be a significant source of N for the ETSP, and needs to be taken into account in future N budgets. Further coupled measurements between N gain and loss processes at the same stations/depths need to be performed to better constrain the magnitude of N gains in this region.
Figure 9. Results from the molecular analyses of the 2010 glucose amendment experiments. Neighbor joining tree of partial nifH nucleotide sequences. Nodes are labeled with nifH cluster designations according to the convention established [74]. The number of sequences recovered from stations and treatments for each phylotype are indicated in boxes to the right of the tree.
Effects of nutrients on N2fixation
The diazotrophic community of the ETSP characterized in this study, as well as in a companion study [42] is comprised of an assemblage of non-cyanobacterial diazotrophs, and little can be inferred about their metabolism from partial nifH sequences. However, we performed nutrient addition bioassays using molecules representing common labile components of the dissolved organic matter pool in marine waters (simple carbohy-drates, amino-acids and ATP), which shed some light on nutrient control of N2 fixation in the core of the OMZ. Our results
indicated that simple carbohydrate additions significantly stimu-lated N2fixation at stations located nearest the coast during both
cruises and at Station 9 during the 2011 cruise (Figs. 7, 8). In OMZs, organic C is largely supplied by vertical flux of planktonic production from shallower layers or by horizontal transport [60]. Thus this supply of organic C is not constant but rather episodic, which could explain why N2fixation appears so variable in space,
in time, and between cruises and years, as reported in the present study and by [26]. This seems to be the case for N loss processes as well, since organic C supply has been correlated with regional denitrification [60] and anammox [31,61] rates in OMZs. Ward et al. [62] demonstrated that denitrification rates were significantly stimulated in the OMZ of the ETSP by organic C additions. To our knowledge our study is the first designed to study the response of diazotrophs to nutrient additions in the OMZ. In surface waters, significant stimulation of N2 fixation rates by glucose
additions have been reported during the same cruise at Station 9 [28]. A significant stimulation of bacterial production after glucose amendments in surface waters of the Chilean upwelling system have also been reported [63]. Finally, in surface waters of the southwest Pacific [64], reported a significant increase of nifH gene copies of unicellular diazotrophic cyanobacteria such as Group A (UCYN-A) and Crocosphaera after glucose and mannitol additions, hypothesizing that this capacity may allow conservation of energy
by rapid uptake and recycling of sugars. However, it has to be noted that the large variability in the response to carbohydrates addition (high standard deviation at Station 11 for example) could be explained by the fact that it may be coincidental whether the taxa that benefit from the enrichment possess the nifH gene.
Because the organic C molecules tested here are also energy-rich molecules easily entering catabolic pathways, one could interpret our results to be indicative of limitation either by energy or by assimilative C availability. However, in our experiments N2
fixation was not stimulated by ATP additions at any station, indicating that C and not energy might have been the proximate limiting factor. In some oligotrophic P-limited environments, ATP is also a source of P for bacteria and uptake rates of ATP exceed those of glucose [65]; however, in OMZs, P is not limiting relative to N, which may further restrict the ability of ATP to stimulate N2
fixation rates in our bioassays. In contrast, the addition of free amino acids stimulated N2fixation at all stations tested; this has
also been shown in aphotic oxynenated waters of the Red Sea [66]. Amino acids are a source of both C and N, and it has been suggested that it is energetically advantageous for microbes to use preformed compounds such as amino acids rather than glucose as C sources [67]. In terrestrial legume-rhizobium symbioses, the diazotrophic bacteria assimilate amino acids such as glutamic acid provided by the host, which facilitate both dicarboxylate oxidation and ammonium assimilation into asparagine [68]. In Azospirillum sp., additions of glutamic acid also stimulated N2fixation activity
[69] by providing a C and energy source to the diazotrophs, while N was still provided via N2fixation. It may be that similar nutrient
assimilation dynamics are occurring in diazotrophs in the ETSP OMZ.
Ambient NOxconcentrations were high (ca. 30–40mmol L 21
) at all stations where nutrient additions were performed, and NO32
additions (8mmol L21) never resulted in N2fixation inhibition at
any station. As the metabolic potential of diazotrophs present in Table 2. Examples of published studies showing the range of oceanic N2fixation areal rates measured in some contrasting
oceanic environments.
Location Areal rates (mmol m22d21) Integration depth (m) Reference Hypoxic basin (Southern California Bight) 150 885 [37] ETSP coastal OMZ 7–190 120 [26]
ETSP 0–148 150–200 [28]
ETSP subtropical gyre 12–190 150–200 [14] Eastern North Pacific gyre 520 mixed layer [20] North Atlantic 59–898 15 (Trichodesmium bloom) [3] ETSP aphotic zone 19–501 2000 This study doi:10.1371/journal.pone.0081265.t002
Table 3. Comparison between estimated fixed N losses via denitrification and anammox and fixed N gains via N2fixation
(estimated from the 0–2000 m depth integrated rates measured in this study) in the ETSP.
Area considered N losses N gains (based on 2011 cruise) N gains (based on 2010+2011 cruise) (m2 ) (Tg.yr21 ) (Tg.yr21 ) (Tg.yr21 ) *3.2661011 **9–25 0.04–0.9 0.05–1.1 2.2361012 9–25 0.3–1 0.3–7
*Upwelling area extending 175 km from, and 1860 km along the Peruvian-Chilean coast [31,56]. **Estimates from [31,55,56,57].
the OMZ have not yet been fully characterized, we do not know if they possess genes for reduction and assimilation of NO32 or
NO2 2
. Detailed studies at the single cell level would be needed to characterize the metabolism of these organisms and understand why microbes fix N2 in the presence of so much NO32. In
addition to possible energy and C, N and P sources derived from molecules like amino acids, carbohydrates or ATP, electron sources and donors are also very important to know for characterizing the physiology of the diazotrophs present in the ETSP. Molecules like O2, NO32 and less favorably SO422 are
common electron acceptor and they are used for different types of respirations like aerobic respiration, or anaerobic denitrification and sulfate reduction. These different respiratory pathways potentially supporting N2 fixation are performed by organisms
with different physiology which each have their own environmen-tal sensitivities for fixing N2.
Phylogenetic characterization of diazotrophs
Our characterization of the diazotrophic community in the core of the OMZ revealed the presence of potential N2-fixing
heterotrophs based on the presence of the nifH gene. We did not detect the cyanobacterial diazotrophs commonly found in other regions of the open ocean; in contrast, most of the nifH genes amplified from the OMZ clustered with a-, c- and d-proteobac-teria. This result is consistent with the observations of Turk-Kubo [42] in the upper 200 m of the ETSP water column, where 96% of sequences were also affiliated with proteobacteria. Based on these results, and other studies conducted in the ETSP and the South Pacific Gyre [14,26,70], it is clear that the ETSP diazotrophic community is different from other well-studied tropical and sub-tropical oceans such as that of the North Pacific, North Atlantic and Indian Oceans. The cyanobacterial diazotrophic phylotypes commonly found at high abundances in these other ocean provinces appear to be either sporadically present at low abundances (i.e. Trichodesmium, UCYN-A), or undetected altogeth-er (i.e. UCYN-B, diatom-diazotroph associations) in the ETSP.
The amplification of diverse non-cyanobacterial nifH-containing organisms from OMZ waters in the ETSP affiliated with nifH clusters 1K, 1G and 3, is consistent with the findings of other studies conducted in anaerobic waters [26,36,71] and in abyssopelagic waters [47]. However, the results from this study underscore the difficulty inherent in identifying the diazotrophic community responsible for N2fixation rates. It is important to note
that nifH cluster 1K sequences have been reported as contam-inants in many studies, including a study in the ETSP [42]. However, none of the sequences recovered here had greater than 90% amino acid similarity and 83% nucleic acid similarity to reported contaminants. Nevertheless, as a result of the use of highly degenerate primers and nested PCR cycles necessary to amplify this important but low-abundance gene target, contam-ination must always be considered as a source for heterotrophic diazotroph sequences, whether from PCR and DNA extraction reagents or from sampling or handling procedures, despite the screening of PCR and reagent blank controls as in this study.
Furthermore, although it is clear that a diverse assemblage of non-cyanobacterial nifH-containing organisms are present in the OMZ of the ETSP, the best methodologies currently available to characterize dominant members of the diazotrophic community (PCR amplification using degenerate nifH primers) often identify organisms present at extremely low levels when targeted using quantitative approaches (i.e. qPCR; Fig. S1 in File S1) [42,47,71]. This, in turn, makes it difficult to argue that these organisms are capable of fixing N2at cell-specific rates great enough to account
for measured bulk rates. An analysis of the expected N2fixation
rates based on abundances and plausible cell-specific N2fixation
rates in the ETSP discussed in [42] indicate that these proteobacteria are unlikely to be responsible for all the measured bulk rates and therefore other N2-fixing organisms could be
responsible for a part of N2fixation in this region but may remain
uncharacterized. Identifying which organisms are actively tran-scribing nifH using techniques such as reverse transcription (RT)-qPCR might provide more insight into which diazotrophic taxa are actively fixing nitrogen. However, the challenge of identifying which organisms are important N2-fixers remains the same when
designing qPCR primers from sequences derived from RT-PCR based clone libraries, and are further convoluted by potentially low transcript abundances per cell and/or the timing of sampling with respect to diel changes in nifH expression (even in the case of heterotrophs).
Conclusions
This study provides one of the first estimates of N2fixation rates
in aphotic waters of the ETSP. It reveals that N2 fixation in
aphotic environments is the largest contributor to total areal N2
fixation in ETSP. N2 fixation in high [NO3 2
] environments remains an enigma as it requires an additional energetic cost relative to NO3
2
or NH4+. Further physiological studies are
needed to understand the physiological regulation of N2fixation,
especially on newly discovered diazotrophic organisms. Contrary to N2 fixation performed in euphotic layer which sustains new
primary production [3], aphotic N2fixation may sustain organic
matter remineralization. These new sources of N could potentially compensate for as much as 78% of the estimated N loss processes in ETSP, indicating that they need to be taken into account in marine N budgets. Phylogenetic studies confirm the presence of diazotrophs in the deep waters on the OMZ, which are distinct from cyanobacterial phylotypes commonly found in surface oligotrophic waters of the tropical ocean. Organic and inorganic nutrient addition bioassays reveal that amino acids and simple carbohydrates stimulate N2fixation in the core of the OMZ, and
the episodic supply of these nutrients from upper layers may explain the large temporal and spatial variability of N2fixation in
the ETSP. Research on marine heterotrophic N2fixation is at its
beginning and significant progress needs to be made in the refinement of the methods to estimate planktonic N2 fixation in
OMZs (15N2bubble method versus 15
N2-enriched seawater) from
bulk measurements to single cells analysis. The 15N-enriched seawater method should be coupled to oxygen-free and trace metal-clean procedures to provide more accurate estimates. Progress also needs to be made in the characterization of the community responsible for N2fixation in these deep waters, as well
as the control of their population dynamics by the supply of organic matter. Estimates of global N2 fixation based on field
measurements [5,72] are presently lower than geochemically-based (nutrient stoichiometry and isotopic ratio) estimates [73]. Taking into account deep N2fixation might help to resolve some
of this discrepancy. However, progress also needs to be made in the quantification of N loss processes, as recent studies indicate that they may be less sensitive to oxygen than previously thought [59], further complicating the N budget in the ETSP. In future studies, N gain and loss measurements need to be coupled in space and time to further resolve the N budget in the ETSP.
Supporting Information
File S1 Supporting methods, Table S1, and Figure S1. (DOCX)
Acknowledgments
The authors thank the captains and crews from the R/V Atlantis and R/V Melville for outstanding shipboard operations and anonymous referees for constructive comments.
Author Contributions
Conceived and designed the experiments: SB JD. Performed the experiments: SB JD KT TM OG RH. Analyzed the data: SB JD KT JZ DC. Contributed reagents/materials/analysis tools: SB JD KT OG. Wrote the paper: SB.
References
1. Falkowski PG, Barber RT, Smetacek V (1998) Biogeochemical Controls and Feedbacks on Ocean Primary Production. Science 281: 200–206.
2. Karl D, Letelier R, Tupas L, Dore J, Christian J, et al. (1997) The role of nitrogen fixation in biogeochemical cycling in the subtropical North Pacific Ocean. Nature 388: 533–538.
3. Capone DG, Burns JA, Michaels AF, Montoya J, Subramaniam A, et al. (2005) Nitrogen fixation by Trichodesmium spp.: An important source of new nitrogen to the tropical and sub-tropical North Atlantic Ocean. Global Biogeochemical Cycles 19: 786–787.
4. Capone DG, Zehr JP, Paerl HW, Bergman B, Carpenter EJ (1997) Trichodesmium, a globally significant marine cyanobacterium. Science 276: 1221–1229.
5. Mahaffey C, Michaels AF, Capone DG (2005) The conundrum of marine N2 fixation. American Journal of Science 305: 546–595.
6. Carpenter EJ, Montoya JP, Burns JA, Mulholland M, Subramaniam A, et al. (1999) Extensive bloom of a N2-fixing diatom/cyanobacterial association in the Tropical Atlantic Ocean. Mar Ecol Prog Ser 185: 273–283.
7. Zehr JP, Waterbury JB, Turner PJ, Montoya JP, Omoregie E, et al. (2001) Unicellular cyanobacteria fix N2in the subtropical North Pacific Ocean. Nature
412: 635–638.
8. Zehr JP, Bench SR, Carter BJ, Hewson I, Niazi F, et al. (2008) Globally Distributed Uncultivated Oceanic N2-Fixing Cyanobacteria Lack Oxygenic Photosystem II. Science 322: 1110–1112.
9. Needoba JA, Foster RA, Sakamoto C, Zehr JP, Johnson KS (2007) Nitrogen fixation by unicellular diazotrophic cyanobacteria in the temperate oligotrophic North Pacific Ocean. Limnology and Oceanography 52: 1317–1327. 10. Zehr JP, Mellon MT, Zani S (1998) New nitrogen-fixing microorganisms
detected in oligotrophic oceans by amplification of nitrogenase (nifH) genes. Applied and Environmental Microbiology 64: 3444–3450.
11. Zehr JP, Jenkins BD, Short SM, Steward GF (2003) Nitrogenase gene diversity and microbial community structure: a cross-system comparison. Environmental Microbiology 5: 539–554.
12. Farnelid H, Riemann L (2008) Heterotrophic N2-fixing bacteria: overlooked in the marine nitrogen cycle?. In: Couto NG, editor. Nitrogen Fixation Research Progress. New York: Nova Science Publishers. pp. 409–423.
13. Riemann L, Farnelid H, Steward GF (2010) Nitrogenase genes in non-cyanobacterial plankton: prevalence, diversity and regulation in marine waters. Aquatic Microbial Ecology 61: 235–247.
14. Halm H, Lam P, Ferdelman TG, Lavik G, Dittmar T (2012) Heterotrophic organisms dominate nitrogen fixation in the South Pacific Gyre. ISME J 6: 1238–1249.
15. Codispoti LA (2007) An oceanic fixed nitrogen sink exceeding 400 Tg Na-1 vs the concept of homeostasis in the fixed-nitrogen inventory. Biogeosciences 4: 233–253.
16. Berman-Frank I, Quigg A, Finkel ZV, Irwin AJ, Haramaty L (2007) Nitrogen-fixation strategies and Fe requirements in cyanobacteria. Limnology and Oceanography 52: 2260–2269.
17. Kustka AB, Carpenter EJ, San˜udo-Wilhelmy S, Sunda WG (2003) Iron requirements for N2 and NH4+ supported growth in cultures of Trichodesmium (IMS 101): comparison with nitrogen fixation rates and Fe: C ratios of field populations. Limnology and Oceanography 48: 1869–1884.
18. Mills MM, Ridame C, Davey M, La Roche J, Geider JG (2004) Iron and phosphorus co-limit nitrogen fixation in the eastern tropical North Atlantic. Nature 429: 292–294.
19. Karl DM, Letelier R, Tupas L, Dore J, Christian J, et al. (1997) The role of nitrogen fixation in biogeochemical cycling in the subtropical North Pacific Ocean. Nature 388: 533–538.
20. Montoya JP, Holl CM, Zehr JP, Hansen A, Villareal T, et al. (2004) High rates of N2-fixation by unicellular diazotrophs in the oligotrophic Pacific. Nature 430:
1027–1031.
21. Dupouy C, Petit M, Dandonneau Y (1988) Satellite detected cyanobacteria bloom in the southwestern tropical Pacific. Implication for nitrogen fixation. International Journal of Remote Sensing 8: 389–396.
22. Montoya JP, Holl CM, Zehr JP, Hansen A, Villareal TA, et al. (2004) High rates of N2 fixation by unicellular diazotrophs in the oligotrophic Pacific Ocean. Nature 430: 1027–1031.
23. Bonnet S, Biegala IC, Dutrieux P, Slemons LO, Capone DG (2009) Nitrogen fixation in the western equatorial Pacific: Rates, diazotrophic cyanobacterial size class distribution, and biogeochemical significance. Global Biogeochemical Cycles 23: GB3012.
24. Deutsch C, Sarmiento JL, Sigman DM, Gruber N, Dunne JP (2007) Spatial coupling of nitrogen inputs and losses in the ocean. Nature 445: 163–167.
25. Landolfi A, Dietze H, Koeve W, Oschlies A (2013) Overlooked runaway feedback in the marine nitrogen cycle: the vicious cycle. Biogeosciences 10: 1351–1363.
26. Fernandez C, Farı´as L, Ulloa O (2011) Nitrogen Fixation in Denitrified Marine Waters. PLoS ONE 6: e20539.
27. Moutin T, Karl DM, Duhamel S, Rimmelin P, Raimbault P, et al. (2008) Phosphate availability and the ultimate control of new nitrogen input by nitrogen fixation in the tropical Pacific Ocean. Biogeosciences 5: 95–109. 28. Dekaezemacker J, Bonnet S, Grosso O, Moutin T, Bressac M, et al. (2013)
Evidence of active dinitrogen fixation in surface waters of the eastern tropical south pacific during El nin˜o and La nin˜a events and evaluation of its potential nutrient controls. Global Biogeochemical Cycles 27:768–779.
29. Zehr J, Capone DG (1996) Problems and promises of assaying the genetic potential for nitrogen fixation in the marine environment. Microbial ecology 32: 263–281.
30. Goering JJ (1968) Denitrification in the oxygen minimum layer of the eastern tropical Pacific Ocean. Deep Sea Research 15: 157–164.
31. Hamersley MR, Lavik G, Woebken D, Rattray J, Lam P, et al. (2007) Anaerobic ammonium oxidation in the Peruvian oxygen minimum zone. Limnology and Oceanography 52: 923–933.
32. Kuypers MMM, Sliekers AO, Lavik G, Schmid M, Jorgensen BB, et al. (2003) Anaerobic ammonium oxidation by anammox bacteria in the Black Sea. Nature 422: 608–611.
33. Helm I, Jalukse L, Vilbaste M, Leito I (2009) Micro-Winkler titration method for dissolved oxygen concentration measurement. Analytica Chimica Acta 648: 167–173.
34. Aminot A, Kerouel R (2007) Dosage automatique des nutriments dans les eaux marines. Cedex France: E´ ditions Quæ. 187 p.
35. Montoya JP, Voss M, Kahler P, Capone DG (1996) A simple, high-precision, high-sensitivity tracer assay for N2 fixation. Applied and Environmental Microbiology 62: 986–993.
36. Hamersley MR, Turk KA, Leinweber A, Gruber N, Zehr JP, et al. (2011) Nitrogen fixation within the water column associated with two hypoxic basins in the Southern California Bight. Aquatic Microbial Ecology 63: 193–205. 37. Mohr W, Groszkopf T, Wallace DRW, LaRoche J (2010) Methodological
underestimation of oceanic nitrogen fixation rates. PLoS ONE 9: 1–7. 38. Wilson ST, Bo¨ttjer D, Church MJ, Karl DM (2012) Comparative assessment of
nitrogen fixation methodologies conducted in the oligotrophic North Pacific ocean. Applied and Environmental Microbiology 78(18): 6516–6523. 39. Großkopf T, Mohr W, Baustian T, Schunck H, Gill Dea (2012) Doubling of
marine dinitrogen-fixation rates based on direct measurements. Nature 488: 361–364.
40. Bonnet S, Grosso O, Moutin T (2011) Planktonic Dinitrogen Fixation along a longitudinal gradient across the Mediterranean Sea during the stratified period (BOUM cruise). Biogeosciences 8: 2257–2267.
41. Turk-Kubo K, Achilles KM, Serros TRC, Ochiai M, Montoya J, et al. (2012) Nitrogenase (nifH) gene expression in diazotrophic cyanobacteria in the Tropical North Atlantic in response to nutrient amendments. Frontiers for microbiology. doi: 10.3389/fmicb.2012.00386.
42. Turk KA, Karamchandani M, Capone DG, Zehr J (2013) The paradox of marine heterotrophic nitrogen fixation: Abundances of heterotrophic diazo-trophs do not account for nitrogen fixation rates in the Eastern Tropical South Pacific. Environmental Microbiology. In revision.
43. Zehr J, McReynolds LA (1989) Use of degenerate oligonucleotides for amplification of the nifH gene from the marine cyanobacterium Trichodesmium thiebautii. Applied and Environmental Microbiology 55: 2522–2526. 44. Zani S, Mellon MT, Collier JL, Zehr JP (2000) Expression of nifH genes in
natural microbial assemblages in Lake George, NY detected with RT-PCR. Applied and Environmental Microbiology 66: 3119–3124.
45. Huang Y, Niu B, Gao Y, Fu L, Li W (2010) CD-HIT Suite: a web server for clustering and comparing biological sequences. 26: 680–682. Bioinformatics 26: 680–682.
46. Paulmier A, Ruiz-Pino D (2008) Oxygen Minimum Zones (OMZs) in the modern ocean. Progress In Oceanography 80: 113–128.
47. Hewson I, Moisander PH, Achilles KM, Carlson CA, Jenkins BD, et al. (2007) Characteristics of diazotrophs in surface to abyssopelagic waters of the Sargasso Sea. Aquatic Microbial Ecology 46: 15–30.
48. Lam P, Lavik G, Jensens MM, van de Vossenberg J, Schmid M, et al. (2009) Revising the nitrogen cycle in the Peruvian oxygen minimum zone. Proceedings of the National Academy of Sciences 106: 4752–4757.
49. Mulholland MR, Capone DG (2001) Stoichiometry of nitrogen and carbon utilization in cultured populations of Trichodesmium IMS101: Implications for growth. Limnology and Oceanography 46: 436–443.
50. Postgate J (1998) Nitrogen Fixation, 3rd edition. Cambridge: Cambridge University Press.
51. Burgess BK, Lowe DJ (1996) Mechanism of molybdenum nitrogenase. Chemical Reviews 96: 2983–3011.
52. Fay P (1992) Oxygen relations of nitrogen fixation in cyanobacteria. Microbiological Reviews 56: 340–373.
53. Großkopf T, LaRoche J (2012) Direct and indirect costs of dinitrogen fixation in Crocosphaera watsonii WH8501 and possible implications for the nitrogen cycle. Frontiers in microbiology 3.
54. Moffett J, Goepfert TJ, Naqvi SWA (2007) Reduced iron associated with secondary nitrite maxima in the Arabian Sea. Deep Sea Research Part I: Oceanographic Research Papers 54: 1341–1349.
55. Deutsch C, Gruber N, Key RM, Sarmiento JL, Ganachaud A (2001) Denitrification and N2 fixation in the Pacific Ocean. Global Biogeochemical Cycles 15: 483–506.
56. Codispoti LA, Packard TT (1980) Denitrification rates in the eastern tropical South Pacific. Journal of marine research 38: 453–477.
57. Lipschultz FS, Wofsy C, Ward BB, Codispoti LA, Friedrich G, et al. (1990) Bacterial transformations of inorganic nitrogen in the oxygen-deficient waters of the eastern tropical South Pacific Ocean. Deep Sea Research, Part A 37: 1513– 1541.
58. Montoya JP, Voss M, Kaehler P, Capone DG (1996) A simple, high precision tracer assay for dinitrogen fixation. Applied and Environmental Microbiology 62: 986–993.
59. Kalvelage T, Jensen MM, Contreras S, Revsbech NP, Lam P, et al. (2011) Oxygen Sensitivity of Anammox and Coupled N-Cycle Processes in Oxygen Minimum Zones. PLoS ONE 6.
60. Liu KK, Kaplan IR (1984) Denitrification rates and availability of organic matter in marine environments. Earth and Planetray Science Letters 68: 88– 100.
61. Kalvelage T, Lavik G, Lam P, Contreras S, Arteaga L, et al. (2013) Nitrogen cycling driven by organic matter export in the South Pacific oxygen minimum zone. Nature geoscience 6: 228–234.
62. Ward BB, Tuit CB, Jayakumar A, Rich JJ, Moffett J, et al. (2008) Organic carbon, and not copper, controls denitrification in oxygen minimum zones of the ocean. Deep Sea Research I 55: 1672–1683.
63. Van Wambeke F, Bonnet S, Moutin T, Raimbault P, Alarcon G, et al. (2008) Factors limiting heterotrophic bacterial production in the southern Pacific Ocean. Biogeosciences 5: 833–845.
64. Moisander PH, Zhang RF, Boyle EA, Hewson I, Montoya J, et al. (2012) Analogous nutrient limitations in unicellular diazotrophs and Prochlorococcus in the South Pacific Ocean. The ISME Journal 6:. ISME Journal 6: 733–744. 65. Alonso-Saez L, Gasol JM (2007) Seasonal Variations in the Contributions of
Different Bacterial Groups to the Uptake of Low-Molecular-Weight Compounds in Northwestern Mediterranean Coastal Waters. Applied and Environmental Microbiology 73: 3528–3535.
66. Rahav E, Bar-Zeev E, Ohayion S, Elifantz H, Belkin N, et al. (2013) Dinitrogen fixation in aphotic oxygenated marine environments. Frontiers in microbiology. doi: 10.3389/fmicb.2013.00227.
67. Del Giorgio PA, Cole JJ (1998) Bacterial growth efficiency in natural aquatic systems. Annu Rev Ecol Syst 29: 503–541.
68. Lodwig EM, Hosie AHF, Bourde´s A, Findlay K, Allaway D, et al. (2003) Amino-acid cycling drives nitrogen fixation in legume–rhizobium symbiosis. Nature 422: 722–726.
69. Hartmann A, Fu H, Burris RH (1988) Influence of amino acids on nitrogen fixation ability and growth of Azospirillum spp. Applied and Environmental Microbiology 54: 87–93.
70. Bonnet S, Guieu C, Bruyant F, Prasil O, Van Wambeke F, et al. (2008) Nutrient limitation of primary productivity in the Southeast Pacific (BIOSOPE cruise). Biogeosciences 5: 215–225.
71. Farnelid H, Bentzon-Tilia M, Andersson AF, Bertilsson S, Jots G, et al. (2013) Active nitrogen-fixing heterotrophic bacteria at and below the chemocline of the central Baltic Sea. ISME Journal 7: 1413–1423.
72. Carpenter EJ, Capone DG (1992) Significance of Trichodesmium blooms in the marine nitrogen cycle. In: Carpenter EJ, Capone DG, Rueter JG, editors. Marine Pelagic Cyanobacteria: Trichodesmium and Other Diazotrophs. New York: Springer. pp. 211–217.
73. Gruber N, Sarmiento JL (1997) Global patterns of marine nitrogen fixation and denitrification. Global Biogeochemical Cycles 11: 235–266.
74. Zehr JP, Crumbliss LL, Church MJ, Omoregie EO, Jenkins BD (2003) Nitrogenase genes in PCR and RT-PCR reagents: implications for studies of diversity of functional genes. Biotechniques 35: 996–1005.