HAL Id: hal-01065787
https://hal-paris1.archives-ouvertes.fr/hal-01065787
Submitted on 18 Sep 2014
HAL is a multi-disciplinary open access archive for the deposit and dissemination of sci-entific research documents, whether they are pub-lished or not. The documents may come from teaching and research institutions in France or abroad, or from public or private research centers.
L’archive ouverte pluridisciplinaire HAL, est destinée au dépôt et à la diffusion de documents scientifiques de niveau recherche, publiés ou non, émanant des établissements d’enseignement et de recherche français ou étrangers, des laboratoires publics ou privés.
Beliefs, media exposure and policy preferences on
immigration: Evidence from Europe
Jérôme Héricourt, Gilles Spielvogel
To cite this version:
Jérôme Héricourt, Gilles Spielvogel. Beliefs, media exposure and policy preferences on immigration: Evidence from Europe. Applied Economics, Taylor & Francis (Routledge), 2014, 46 (2), pp.225-239. �10.1080/00036846.2013.844330�. �hal-01065787�
Beliefs, Media Exposure and Policy Preferences on Immigration:
Evidence from Europe
∗J´erˆome H´ericourt† Gilles Spielvogel‡
July 2013
Abstract
This paper studies the joint determination of beliefs about the economic impact of immigration and immigration policy preferences, using data from the five rounds of the European Social Survey (2002-2010). In addition to standard socioeconomic characteristics, this analysis takes individual media consumption into account, as a determinant of opinion about immigration. Our results stress the important role of the endogenous determination of beliefs, which appears as a major determinant of policy preferences. Moreover, media exposure appears as a key determinant of beliefs: individuals who spend more time to get informed on social and political matters through newspapers and radio have a better opinion on the economic impact of immigration compared with individuals who devote time to other types of content.
JELcodes: F22, D72, D83, J15.
Keywords: International migration, beliefs, attitudes, media.
∗
The authors thank the Editor, Mark Taylor, and one referee for insightful comments. The authors are also grateful to seminar participants at the OECD, DIAL (Paris) and the S˜ao Paulo School of Economics for valuable comments.
†
Corresponding author. EQUIPPE-University of Lille, University Paris 1 - Centre d’Economie de la Sorbonne & CEPII. University Paris 1 - Maison des Sciences Economiques, 106-112 boulevard de l’Hˆopital, 75647 Paris Cedex 13, France. E-mail: jerome.hericourt@univ-lille1.fr.
‡
1
Introduction
Growing migration flows to developed countries over the past 20 years have transformed several Euro-pean countries of emigration into countries of immigration, while patterns of migration – countries of origin and types of migration – have become increasingly diversified. The changing situation, as well as the ongoing emergence of a European immigration policy, have prompted more frequent shifts in na-tional migration policies. Setting migration policies is a complex process, in which public opinion plays a significant role. The crisis which started with the Great Recession of 2008-2009 has been threaten-ing to revive the opposition to immigration. Concerns are bethreaten-ing expressed in some circles over what is seen as unfair competition from immigrants in the labor market and their potential negative impact on public finances. Managing these potential sources of social tension presents a serious challenge for the governments of developed countries.
A recent, growing literature in economics and political science has analyzed the determinants of individual preferences regarding migration policy, paying particular attention to the role played by per-ceptions of the economic effects of immigration and by concerns about the impact of immigration on the way of life of local populations (Scheve and Slaughter, 2001; Mayda, 2006; Sides and Citrin, 2007; Hainmueller and Hiscox, 2007; Card et al., 2012). Basically, this literature attempts to uncover the fun-damental motives which make some people more or less favorable to immigration. In dealing with the economic dimension, the literature has focused mainly on two issues: the impact of immigration on the national labor market, and the impact of new arrivals on public finances and social welfare systems.
The arrival of immigrants on the domestic labor market may be seen by local workers as a source of new competition for available jobs. Most of the literature so far has found only small or negligible effects of immigration on the wages of native-born workers (Card, 1990; Borjas, 2003; Manacorda et al., 2012; Ottaviano and Peri, 2012). However, the actual threat of competition has less influence on resi-dent workers’ opinions about immigration than the perceived threat does. Indeed, in 2002, almost 40% of Europeans were concerned about detrimental wage effects stemming from immigration1. As to the supposed implications for public finances, immigration may have two contradictory effects. A positive effect could be that the influx of immigrants provides an adequate solution to the growing problem of funding pay-as-you-go pension schemes. A negative effect could be that low-skilled immigrants become net beneficiaries of the social protection system if, for example, they draw sickness and unemployment benefits or receive family allowances. Overall, most studies find that immigration has a minimal or negligible impact on public finances (Rowthorn, 2008; Dustmann et al., 2010).
However, it is the subjective perception of the effects, and not an objective assessment, which could
1
lead individuals to come out for or against immigration. Furthermore, it seems quite likely that prefer-ences about immigration are influenced not only by economic factors, but also by political and cultural attitudes. Most of the empirical work that sets out to deal separately with the different roles played by economic factors and by political/cultural factors is faced with the problem of accounting for the influ-ence of education in each case. As Hainmueller and Hiscox (2007) show with referinflu-ence to the 2002 European Social Survey, the educational level is a key determinant of individual opinion about immi-gration, not only because it influences attitudes toward competition from immigrant workers in the job market, but also because it reflects differences in cultural values. At the same time, the factors that in-fluence the individual perceptions of the effects of migration and the individual views on allowing entry to immigrants are either the same or at least very closely related. This question of the endogenous na-ture of beliefs about the impact of immigration has been, to the best of our knowledge, neglected by the literature until now.
Moreover, the media’s influence on public opinion has been the subject of much research by political scientists and sociologists. A consensus has emerged that recognizes the unifying impact of the mass media on public opinion (Shaw and Martin, 1992; Mendelsohn and Nadeau, 1996). Because of their wide-ranging social and political implications, migration issues have been attracting constant media attention since the 1970s. A number of analytical studies have shown that the growing commercialization of the mass media networks has led them to adopt a routinely sensationalist approach to the issues, thereby reinforcing negative public perceptions (Benson, 2002; Benson and Saguy, 2005). At the same time, the effect of beliefs (individual as well as collective) on the debate is by no means negligible, and consequently helps to shape individual opinions (Boswell, 2009; Esses et al., 2001; Jackson and Esses, 2000).
The old and new media alike are therefore more inclined to focus on immigration if it can be linked to problems such as crime, the economic crisis, or violent political controversy. For example, Tsoukala (2002) studies the news coverage of immigration in several European countries during the 1990s. Using survey data for the United States, Facchini et al. (2009) note that media exposure is correlated with public opinion on illegal immigration. Nevertheless, most studies in this area had a qualitative approach of the phenomenon, and none of them attempted to assess precisely by which means media exposure influences beliefs and opinions about immigration, and the relative importance of the latter compared to the other standard determinants.
The study of the impact of standard socioeconomic determinants and the exposure to different types of media on beliefs (about the economic impact of immigration) as well as policy preferences (about immigration) in this paper aims at filling these gaps. Our empirical analysis is based on the five rounds
of the European Social Survey over the 2002-2010 time period (ESS, 2002-2010). Our contribution is twofold.
First, we address the issue of the joint determination of beliefs about the economic impact of immi-grationand immigration policy preferences. Since it is more directly related to policy options, most of the literature has focused on the latter, and usually neglected the former. A notable exception is Sides and Citrin (2007), who look at the individual determinants of both dimensions, but do not investigate the correlation between beliefs and preferences. Hainmueller and Hiscox (2007) include the belief vari-able as a determinant of policy preferences, but do not consider its potential endogeneity. In order to address these issues, we propose an empirical model which explicitly accounts for both the formation of beliefs and the link between beliefs and preferences. Second, we take individual media consumption into account, as a determinant of opinion about immigration. We hypothesize that different patterns of media consumption may lead to different perceptions and levels of knowledge about migration issues, especially relating to education levels. Our data allows us notably to distinguish between types of media (TV, press, or radio) and the content (news and politics as opposed to other topics) involved. We also check how sensitive our results are to the fact that individuals self-select into media exposure.
Our results show that beliefs about the economic impact of immigration are a major determinant of policy preferences, along with the traditional socioeconomic determinants highlighted by the literature. More precisely, we find that a part of the influence of traditional socioeconomic variables on policy preferences is actually shaped by beliefs. A second important finding of our study is the role of media exposure, which appears as a key determinant of beliefs. We also point out that the type of media content is crucial in explaining the shaping of beliefs regarding the economic impact of immigration: individuals spending more time to get informed on the news and political matters through newspapers and, to a lesser extent, radio have a better opinion on the economic impact of immigration.
The remainder of this paper is organized as follows. In the next section, we present the data used in our empirical analysis. Section 3 presents the analytical framework. Section 4 presents the results. A number of robustness checks are carried out in section 5, and section 6 concludes.
2
Data
2.1 Database
Our empirical analysis relies on five rounds of the European Social Survey (ESS2): 2002, 2004, 2006, 2008, and 2010. The ESS is an academically-driven social survey designed to explain the attitudes,
2
beliefs and behavior patterns of Europe’s diverse populations. The survey covers more than 30 nations. The central aim of the ESS is to gather data about changing values, attitudes, attributes and behavior patterns within European polities.
Our sample includes the 15 countries for which the survey is available for the whole period3. The data set is, however, not a panel of individuals since the samples are different for each survey.
2.2 Variables of Interest
Our focus is both on openness to migration and beliefs regarding the impact of immigration on the economy. The first variable scales from 1 (“Allow no people from the same race or ethnic group to live here”) to 4 (“Allow many to come and live here”)4, the second from 0 (“immigration is bad for the economy”) to 10 (“immigration is good for the economy”). In our analysis, to ease the interpretation of the coefficients, we rescaled both variables from 0 to 1. Turning to explanatory variables, we first use several sociodemographic variables typically used in the literature: age, sex, education (distinguishing between primary, secondary and tertiary education), type of area of residence (large cities and suburbs vs. small cities and rural areas)5, employment status (employed, unemployed, or inactive), and political partisanship (1 if the respondent claims to be left wing, 0 otherwise). We also include information related to the respondent’s immigrant background: this variable takes the value 0 for individuals born in their country of residence, and whose parents were also born in their country of residence, 1 otherwise. In order to get an idea of the importance of economic factors, the regional rate of unemployment, extracted from the Eurostat-Regio database (NUTS2 level), is also included. Moreover, one of the contributions of the paper is the introduction of variables representing media exposure. At most, six variables are included, representing the respondent’s consumption (in fraction of hours per day) of television, radio and print media, and discriminating between “news and politics” content and other topics.
Descriptive statistics are given in Tables 1 and 2. Table 1 displays some conventional statistics on our main variables over the whole sample. Unsurprisingly, respondents are on average a bit more open to the immigration of people from the same ethnicity as the majority than from a different ethnic group. Overall, one third of the respondents indicate that their country should allow no or only a few immigrants from the same ethnic background as the majority. This proportion increases to 45% for immigrants from a different ethnic background. Concerning their beliefs regarding the impact of immigration on the
3
Belgium, the Czech Republic, Denmark, Germany, Ireland, Finland, France, the Netherlands, Norway, Poland, Slovenia, Spain, Sweden, Switzerland and the United Kingdom.
4
The original variable was actually coded the reverse way. We recoded it so that any variation of right-hand side variables can be interpreted symmetrically.
5This distinction appears more relevant than a simple urban vs. rural one. Indeed, most immigrants are located in large cities, so that the respondents from this kind of area should be more sensitive/reactive to their presence.
economy, respondents appear on average almost neutral, with a mean close to the modal answer (5 on the original scale). More respondents, however, indicate a negative belief (36% between 0 and 4) than a positive one (27% between 6 and 10). The distribution of media consumption variables shows that respondents consume less content devoted to “news and politics” than to other topics. Among the three types of media considered, television is unsurprisingly the one which dominates (between 45 and 75 minutes per day), followed by radio (between 30 and 50 minutes), while print media are far behind (around 20 minutes). Table 2 reports the means of our main variables of interest for each year surveyed. If anything, it shows a remarkable stability of our sample across the years.
3
Empirical Framework
3.1 Model
We want to study the joint determination of beliefs regarding the economic impact of immigration (B) and preferences about immigration policy (P ). We estimate the following model at the individual level6:
Bi= γZi+ αXi+ βMi+ δUr+ λc+ ui (1)
Pi= θ bBi+ ωXi+ µMi+ ηUr+ λc+ vi (2)
where Xi is a vector of social, demographic and economic characteristics of the individual: gender,
age, education, employment status, immigration background, place of residence (urban vs. rural) and political preferences. Mi captures the exposure to different media contents and sources, measured by
the time devoted daily to media consumption along two dimensions: type of media source and type of content. Ur is the unemployment rate in the NUTS 2 region of residence of the individual. Zi contains
excluded instruments, which are assumed to be uncorrelated with immigration policy preferences (see the “Econometric Issues” section below). Therefore, bBi is the predicted value of beliefs, coming from
equation (1). λcis a collection of country dummies and u and v are error terms. In addition, when we
analyze data sets covering several years, we add time dummies.
The recursive structure of our empirical model reflects structural assumptions regarding the formation of beliefs and preferences in terms of migration policy. If beliefs and openness to immigration are likely to be co-determined by the same variables, we assume that beliefs have a causal impact on preferences, but not the other way around. In other words, the formation of beliefs comes first, and preferences are determined “afterwards”, conditional on beliefs.
6
3.2 Econometric Issues
The recursive structure of our empirical model and the nature of the dependent variables raise several es-timation issues, which are not easy to tackle simultaneously. Firstly, the joint determination of equations (1) and (2) may result in some correlation of error terms uiand vi. This would imply relying on a system
estimation methodology. Secondly, the assumption we make about the causality between beliefs and preferences clearly requires controlling for the endogeneity of the former. Thirdly, media consumption is likely to be partly determined by some of the same individual characteristics as beliefs and prefer-ences, which induces an additional endogeneity issue. Finally, both dependent variables – beliefs Biand
preferences Pi– are clearly ordinal.
Handling all these problems simultaneously would require combining a bivariate ordered probit esti-mation with an IV methodology. Such an estimator would be highly complex, and its efficiency question-able. Moreover, preliminary investigations showed that the correlation between residuals, if existent, had a negligible impact on the significance of our estimates. In such a context, turning to a single-equation methodology is the most efficient option. Finally, beyond having a very high computational cost, the use of ordered probit estimations, especially for equation (1), generates a large number of marginal effects which are not easy to interpret, with only little information gain.
Our estimation strategy relies therefore on linear methods, combined with an Instrumental Variable (IV) approach. We implement two-stage-least-squares (2SLS)-type estimations7. Equation (1), the first-stage equation, will be estimated using Ordinary Least Squares. The proper identification of θ therefore requires the inclusion of (at least) one variable Z in equation (1) that is not included in equation (2) (the excluded instrument). Since policy preferences and beliefs are partly the outcomes of a same set of variables, it is inherently difficult to find an instrument uncorrelated with policy preferences.
However, we found two variables in the survey that did a good job in this respect. The first is the individual opinion regarding the current action of the country’s government (“Now thinking about the [country] government, how satisfied are you with the way it is doing its job?”), the second relates to the individual perception of the performance of the national health system (“please say what you think over-all about the state of health services in [country] nowadays”). Both, initiover-ally scaled from 0 (“Extremely dissatisfied/bad”) to 10 (“Extremely satisfied/good”), were rescaled from 0 to 1, consistently with the policy preferences and beliefs variables. Individuals who have a negative assessment of their govern-ment’s actions or of the national health service are unlikely to believe that immigration has a positive impact on the economy, while those who have a positive outlook are unlikely to blame immigration.
7Note that the first equation is not just a reduced-form expression designed only to instrument for an endogenous regressor. It is a “structural” equation, belonging fully to the model.
However, there is no reason why the judgement individuals have on their government or health care sys-tem should affect migration policy preferences directly, independently from the link between beliefs and policy preferences.
In all IV estimations, we perform Hansen’s J-test of overidentifying restrictions. All test statistics are insignificant, indicating that the orthogonality of the instruments and the error term cannot be rejected. We also report the F-stat form of the Kleibergen-Paap statistic, the heteroscedastic and robust clustering version of the Cragg-Donald statistic suggested by Stock and Yogo (2005) as a test for weak instruments. Most statistics are comfortably above the critical values, confirming that our instruments are strong predictors of individuals’ beliefs regarding the economic impact of immigration. We also performed the Durbin-Wu-Hausman test for the exogeneity of beliefs. Unsurprisingly, the null hypothesis of exogeneity is rejected in most cases. This clearly shows that we need to use IV methodologies to identify exogenous variations of beliefs.
Endogeneity is also a concern for the media variables Mi. Since we use six different variables
mea-suring different dimensions of media consumption, an IV approach would require at least six additional excluded instruments, each specific to a given combination of media source (newspaper, radio and TV) and content (politics and current affairs vs. other contents). This would hardly be achievable in most common empirical studies. Instead, we implement a form of exact matching on some of the individual characteristics that are highly predictive of media consumption. We define groups of individuals accord-ing to criteria based on some variables used here, and which are likely to influence policy preferences and media consumption simultaneously: age8, political preferences, employment status and education. In the end, we are left with 42 groups. As shown by an abundant literature (Scheve and Slaughter, 2001; Mayda, 2006; Sides and Citrin, 2007; Hainmueller and Hiscox, 2007; Card et al., 2012), these four vari-ables are key determinants of individual opinion about immigration, not only because they influence attitudes towards competition from immigrant workers in the job market, but also because they reflect differences in cultural values. We can then compare the effect of different types and levels of media exposure among similar individuals. Therefore, in our empirical model, we will also include interaction terms between each media variable and the dummy variables (one for each of the 42 groups), in order to check if the heterogeneity between the groups has a significant impact on the relationship between policy preferences, beliefs and media consumption.
Additionally, section 5 will show that our results are robust to the use of alternative definitions of the dependent variables, estimation methods and subsamples. Finally, in all estimations, standard errors are robust to heteroscedasticity and clustered at the country-year level using the Froot (1989) correction.
8
4
Empirical Results
4.1 The Joint Determination of Beliefs and Opinions
We start with a simple estimation of equation (2) by OLS in columns (1) and (2) of Table 3, the latter including beliefs as an explanatory variable.9 This specification offers a benchmark estimation of the re-lationship between on the one hand, preferences regarding migration and beliefs concerning the impact of migration on the economy, and on the other hand, the other aforementioned determinants. The com-parison of columns (1) and (2) shows that omitting the beliefs variable tends to bias the other coefficients upward, confirming the relevance of this variable in the formation of preferences towards immigration. These results can be compared to the estimations where beliefs are instrumented, presented in columns (3) to (8). In the first IV model (columns (3) and (4)), we instrument beliefs only by the opinion about the state of health services; in the second one (columns (5) and (6)), we instrument beliefs only by the opinion about the government’s performance. In the third model (columns (7) and (8)), which is our preferred specification, we use both instruments jointly.
Insert table 3 here
First, the estimates presented in columns (2) and (8) appear qualitatively similar. Unsurprisingly, beliefs about the economic impact of immigration have a significant impact on the openness towards immigration, in the expected direction: people who believe that immigration has a positive impact favor more open policies. Both variables are positively influenced when individuals display left-wing political preferences and a higher level of education, live an urban area rather than a rural one and have an immigrant background. Conversely, unemployed people believe more frequently that immigration has a negative impact, and are consequently less open. A higher regional unemployment also impacts beliefs and preferences negatively. This comparison, however, also indicates that the IV estimates contrast quantitatively with the OLS ones, which are affected by a significant downward bias on the beliefs coefficient, and an upward one (in absolute terms) on all the other parameters in equation (2).
The interpretation is straightforward: in equation (2), the standard OLS estimates erroneously at-tribute a part of the explanatory power of beliefs to other variables. Individual opinions about the state of health services and the government’s actions seem to affect beliefs about the economic impact of im-migration strongly (see column (7)): the more negative these perceptions, the more negative the beliefs about immigration.
9Note that all estimations control for gender and age (in seven groups: 18-24, 25-34, 35-44, 45-54, 55-64, 65-74 and 75+). The coefficients for these variables are not shown in the tables, but are available from the authors upon request.
4.2 The Role of Media Exposure
As mentioned in the introduction, there are many reasons to think that the media impact public opinion and preferences regarding immigration, both by homogenizing public perceptions in this respect and fostering a sensationalist approach, thus producing a negative bias on the related issues. Using specific information on media consumption provided by the ESS, we propose to test these features directly, especially by discriminating between different types of media and content. When it is significant, the sign on the coefficients of the media variables will provide useful insight into the bias introduced by media influence (if any) on individuals’ beliefs and preferences.
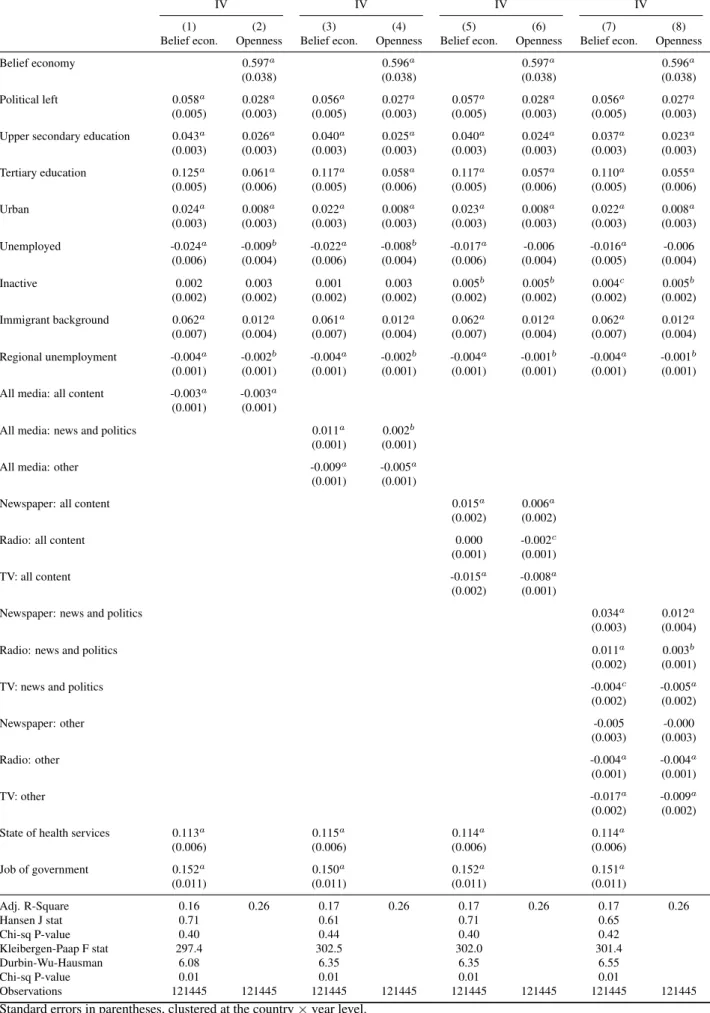
Table 4 adds variables indicating the time devoted to each type of media consumption in the basic regression presented above. In columns (1) and (2), the model includes a single variable indicating the overall time devoted to media consumption (all media and contents). Columns (3) and (4) discriminate between types of content, whereas columns (5) and (6) distinguish between types of media. Finally, columns (7) and (8) cross these two dimensions, with variables reflecting the time devoted to each type of media and content.
Insert table 4 here Insert Figures 1 and 2
While the results on all the other variables do not display any significant change, the estimated coef-ficients on the media variables are interestingly heterogenous, both quantitatively and qualitatively. Not distinguishing either the type of media or content (columns (1) and (2)) brings a significant negative im-pact of the time devoted to media consumption on both beliefs and preferences, which are quantitatively identical. This effect is small: one additional hour of overall media consumption is associated with a de-cline by 0.3% on the belief scale and in terms of policy preferences. But discriminating by either media type or content (or both) shows that media exposure seems to have a much higher influence on beliefs than on preferences (columns (3) to (8)). Going into further details (columns (3) and (4)), we observe that individuals who are more interested in news and political content display significantly more positive beliefs towards immigration, and to a lesser extent, a higher openness to immigration. Conversely, being exposed to other types of content induces both more negative beliefs and less openness. This seems to indicate that political and news content delivers information on immigration that makes individuals more positive about its impact. Turning to the type of media (columns (5) and (6)), it appears that radio does not exert a significant influence. There is however a clear opposition between reading the newspaper and watching TV, the former having a strong positive impact, and the latter, a negative one. Strikingly enough, the coefficients are very close in absolute value, which means that one hour spent reading the
newspaper offsets the effect of one hour of TV on both beliefs and policy preferences. We go one step further by distinguishing both media type and content (columns (7) and (8)), which confirms the positive impact of news and political content on beliefs through newspapers and radio: one additional hour of reading newspapers devoted to news and politics impacts beliefs and policy preferences positively by respectively 3.4 and 1.2%; similarly, an additional hour of listening to political or news programs on the radio triggers a rise by 1.1% on the beliefs scale, and 0.3% in terms of policy preferences. Conversely, TV broadcasts focused on news and politics only impact preferences, but this time, with a negative sign: one additional hour watching TV broadcasts related to news and politics induces a decrease by 0.5% in terms of policy preferences. Being exposed to other types of content through radio and TV (but not newspapers) exhibits a systematic negative influence both on beliefs and preferences, with a marginal impact for the additional hour of -0.4% for radio, and -1.7% for TV (beliefs) and -0.9% (preferences).
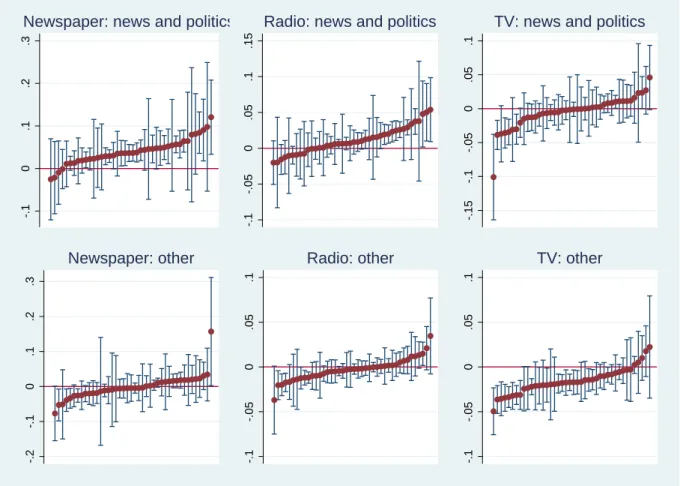
Figures 1 and 2 allow checking for the robustness of the coefficient estimates on the media variables. They display a graphic representation of the coefficients on all six media variables, together with the extremities representing confidence bands, estimated on 42 subgroups designed by exact matching on age group, political preference, employment status and education. The picture they give qualitatively supports the results presented above: media exposure appears to impact beliefs more significantly than preferences; reading newspapers related to news and politics has a positive effect in most cases, while watching other types of TV broadcasts also appears to be negative for most groups. Table 5 provides a summary of these results. For each media variable, it displays the proportion of respondents for which the coefficient is significantly positive or negative. For example, we obtain a significant positive impact on beliefs for reading newspapers with content related to news and politics for about 62% of the sample, while there is no subgroup for which we find a significant negative impact. However, the category “TV: other” is associated to a significant negative effect on beliefs for about 70% of respondents, while it never induces a positive effect.
In short, individuals who spend more time to get informed on news and political matters through newspapers and, to a lesser extent, radio have a more positive opinion of the economic impact of im-migration, not only relatively to average individuals, but also (and even more) relatively to individuals who devote time to other types of media content. More positive beliefs seem therefore dependent on information related to political and social matters. The picture is broadly the same for preferences (but once again, with a much smaller quantitative impact), with the exception of TV broadcasts on news and politics, which display a negative impact on openness to immigration. This result may be explained by editorial choices which focus more on a sensationalist/superficial approach (which on the whole is more anxiety-producing), or by different abilities to process information among individuals.
5
Robustness Checks
We check the robustness of our results to different alternative specifications and estimation methods, including: (i) an alternative variable regarding migration policy preferences; (ii) country-by-country estimations; (iii) the use of probit and ordered probit estimations for the preference equation.10
5.1 Openness toward Migration from a Different Ethnic Group
Table 6 presents the results of an estimation where the dependent variable in equation (2) is the degree of openness towards immigration from a different ethnic group than the majority of the local population. The construction of this variable is identical to the one used previously. Columns (1), (2), (3) and (4) replicate the estimates presented in Table 3 in columns (1), (2), (7) and (8).11 Columns (5) and (6) add the variables related to media exposure and are to be compared to columns (7) and (8) in Table 4.
Insert Table 6
The results regarding social, demographic and economic characteristics are qualitatively and quanti-tatively almost identical to the ones based on the alternative definition of openness. The coefficients of the beliefs variable are slightly higher, but the difference is not statistically significant. Turning to me-dia exposure, the estimates are also very similar, with only marginal differences. The picture described previously remains therefore largely unchanged.
5.2 Explorations of Potential National Specificities
We perform an exercise which is symmetric to the previous one by reestimating our two main equations on a country-by-country basis. For the sake of clarity, we do not report all the regression coefficients12,
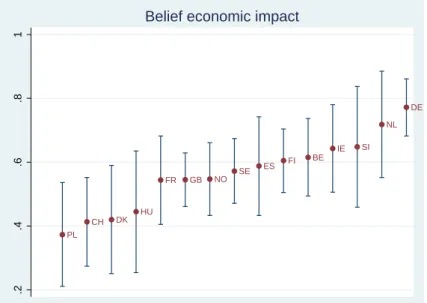
but focus on the beliefs coefficients for each country. This is what is reported in Figure 3, together with the extremities representing confidence bands.
Insert Figure 3
Figure 3 shows a noticeable homogeneity in the beliefs coefficient, ranging between 0.4 and 0.6 in most cases. The only exceptions are Germany and the Netherlands, where the coefficient is above 0.7,
10
We also estimated our model for each ESS round separately to assess the stability of the estimates across time. The results are consistent with the ones based on pooled regressions, and are remarkably stable across the different rounds of the survey. For the sake of brevity, the full results are not reported here but are available from the authors upon request.
11
Since equation (1) is not affected by this change of variable, column (3) in Table 6 is the same as column (7) in Table 3; similarly, column (5) in Table 6 is identical to column (7) in Table 3.
12
but the confidence bands are quite large for the latter, and in any case, these two estimates do not appear to be significantly different from most of the other ones.
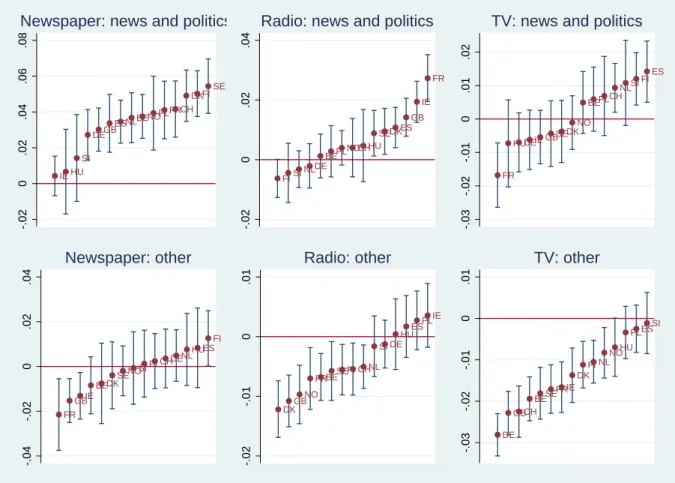
Finally, Figure 4 replicates the exercise of Figure 3 regarding the impact on beliefs of our six variables related to media exposure.
Insert Figure 4
A first striking fact is the strong cross-country heterogeneity regarding the media impact. However, it is confirmed that, for most countries studied, reading newspapers devoted to political topics has a signifi-cant positive impact on beliefs, whereas watching TV devoted to other subjects has a signifisignifi-cant negative impact on beliefs. Radio broadcasts on news and politics also display a slightly significant positive in-fluence for six countries, while other radio content has a small negative impact in nine countries. For the other two media categories (TV: news and politics; Newspapers: other), there is no significant impact for most countries considered. Overall, these results consistently fit with the one commented previously.
5.3 Alternative Functional Forms
Finally, we check the robustness of our specification to alternative estimation methods. We reestimate equation (2) using a probit model, relying on a binary dependent variable taking the value 1 if individuals agree to allow some or many people to immigrate to their country, and 0 if individuals agree to allow none or a few people to immigrate.
Insert Table 7
Table 7, which reports marginal effects computed at means, presents these alternative estimates. Column (1) presents the results of a standard probit model, and column (2) displays the estimates of an IV probit based on the same first-stage estimation and instruments as previously. Once again, the endogeneity of the beliefs variable makes the estimations of column (2) more reliable. The results are qualitatively identical to those presented previously. On the quantitative side, the elasticities are roughly equal to 1.5-2 times those produced by linear estimations (see column (8) in Table 4), consistently with the fact that the number of modalities has been reduced from four to two.13
6
Conclusion
Using a large cross-country database based on five rounds of the European Social Survey for 15 coun-tries, we have studied the impact of media exposure both on beliefs regarding the economic impact of
immigration and preferences concerning the immigration levels, taking the joint determination of these two variables into account. Our results stress the important role of the beliefs variable, which appears as a major determinant of policy preferences, along with the traditional socioeconomic determinants high-lighted by the literature. It also appears that the standard OLS estimates erroneously attribute a part of the explanatory power of beliefs to other variables. Moreover, media exposure seems to be a key deter-minant of beliefs: individuals spending more time to get informed on news and political matters through newspapers and to a lesser extent, radio have a better opinion on the economic impact of immigration, not only relatively to average individuals, but also (and even more) relatively to individuals who devote time to other types of content. More positive beliefs seem therefore dependent on information related to political and social matters. Conversely, TV broadcasts on news and politics display a negative impact on openness to immigration. Editorial choices focusing on a more sensasionalist/superficial approach (which on the whole is more anxiety-producing), and different abilities to process information among individuals may be possible explanations.
This paper contributes to the literature which documents the significant role played by socioeconomic determinants both on beliefs and policy preferences regarding immigration. Our results suggest that a part of the influence of these socioeconomic variables on policy preferences is actually shaped by beliefs. Together with the importance of media exposure, the present work also points out that the type of media content is crucial in explaining the way beliefs are formed regarding the economic impact of immigration.
References
Benson, R., 2002, The political/literary model of French journalism: Change and continuity in immigra-tion news coverage, 1973-1991, Journal of European Area Studies, 10, 49–70.
Benson, R. and A. C. Saguy, 2005, Constructing social problems in an age of globalization: A French-American comparison, French-American Sociological Review, 70, 233–259.
Borjas, G. J., 2003, The labor demand curve is downward sloping: Reexamining the impact of immigra-tion on the labor market, Quarterly Journal of Economics, 118, 1335 – 1374.
Boswell, C., 2009, Knowledge, legitimation and the politics of risk: The functions of research in public debates on migration, Political Studies, 57, 165–186.
Card, D., 1990, The impact of the Mariel Boatlift on the Miami labor market, Industrial and Labor Relations Review, 43, 245 – 257.
Card, D., C. Dustmann and I. Preston, 2012, Immigration, wages and compositional amenities, Journal of the European Economic Association, 10, 78–119.
Dustmann, C., T. Frattini and C. Halls, 2010, Assessing the fiscal costs and benefits of A8 migration to the UK, Fiscal Studies, 31, 1–41.
ESS, 2002-2010, European Social Survey Rounds 1-5 Data, Norwegian Social Science Data Services, Norway - Data Archive and distributor of ESS data.
Esses, V. M., J. F. Dovidio, L. M. Jackson and T. L. Armstrong, 2001, The immigration dilemma: The role of perceived group competition, ethnic prejudice, and national identity, Journal of Social Issues, 57, 389–412.
Facchini, G., A. M. Mayda and R. Puglisi, 2009, Illegal immigration and media exposure: Evidence on individual attitudes, CEPR Discussion Papers 7593, C.E.P.R. Discussion Papers.
Froot, K. A., 1989, Consistent covariance matrix estimation with cross-sectional dependence and het-eroskedasticity in financial data, Journal of Financial and Quantitative Analysis, 24, 333–355. Hainmueller, J. and M. J. Hiscox, 2007, Educated preferences: Explaining attitudes toward immigration
in Europe, International Organization, 61, 399–442.
Manacorda, M., A. Manning and J. Wadsworth, 2012, The impact of immigration on the structure of wages: Theory and evidence from Britain, Journal of the European Economic Association, 10, 120– 151.
Mayda, A. M., 2006, Who is against immigration? A cross-country investigation of individual attitudes toward immigrants, Review of Economics and Statistics, 88, 510–530.
Mendelsohn, M. and R. Nadeau, 1996, The magnification and minimization of social cleavages by the broadcast and narrowcast news media, International Journal of Public Opinion Research, 8, 374–389. Ottaviano, G. I. P. and G. Peri, 2012, Rethinking the effect of immigration on wages, Journal of the
European Economic Association, 10, 152 – 197.
Rowthorn, R., 2008, The fiscal impact of immigration on the advanced economies, Oxford Review of Economic Policy, 24, 560–580.
Scheve, K. F. and M. J. Slaughter, 2001, Labor market competition and individual preferences over immigration policy, The Review of Economics and Statistics, 83, 133–145.
Shaw, D. L. and S. E. Martin, 1992, The function of mass media agenda setting, Journalism & Mass Communication Quarterly, 69, 902–920.
Sides, J. and J. Citrin, 2007, European opinion about immigration: The role of identities, interests and information, British Journal of Political Science, 37, 477–504.
Stock, J. H. and M. Yogo, 2005, Testing for weak instruments in linear IV regression, in: D. W. K. Andrews and J. H. Stock (eds.), Identification and Inference for Econometric Models: Essays in Honor of Thomas Rothenberg, Cambridge University Press.
Tsoukala, A., 2002, Le traitement m´ediatique de la criminalit´e ´etrang`ere en europe, D´eviance et Soci´et´e, 26, 61–82.
Table 1: Descriptive Statistics, Pooled Sample
mean sd min max
Belief economy 0.49 0.24 0 1 Openness majority 0.60 0.27 0 1 Openness minority 0.52 0.28 0 1 Political left 0.32 0.47 0 1 Age 47.41 17.30 18 100 Women 0.51 0.50 0 1 Primary education 0.31 0.46 0 1 Secondary education 0.42 0.49 0 1 Tertiary education 0.27 0.44 0 1 Large cities 0.30 0.46 0 1 Employed 0.54 0.50 0 1 Unemployed 0.06 0.23 0 1 Inactive 0.40 0.49 0 1
Newspaper: news and politics 0.27 0.36 0 3.5
Radio: news and politics 0.48 0.70 0 3.5
TV: news and politics 0.73 0.62 0 3.5
Newspaper: other 0.22 0.39 0 3.5
Radio: other 0.89 1.09 0 3.5
TV: other 1.23 0.95 0 3.5
Observations 121445
Table 2: Descriptive Statistics, Mean by Year
2002 2004 2006 2008 2010 Belief economy 0.49 0.48 0.50 0.51 0.50 Openness majority 0.59 0.60 0.59 0.62 0.61 Openness minority 0.51 0.51 0.50 0.54 0.53 Political left 0.33 0.33 0.32 0.32 0.31 Age 46.67 46.67 47.90 47.64 48.05 Women 0.51 0.51 0.51 0.50 0.51 Primary education 0.33 0.33 0.30 0.30 0.30 Secondary education 0.42 0.42 0.43 0.40 0.41 Tertiary education 0.25 0.24 0.27 0.30 0.29 Large cities 0.31 0.32 0.30 0.30 0.28 Employed 0.52 0.53 0.55 0.55 0.54 Unemployed 0.06 0.06 0.05 0.05 0.06 Inactive 0.42 0.41 0.40 0.40 0.40
Newspaper: news and politics 0.28 0.28 0.27 0.27 0.24
Radio: news and politics 0.52 0.49 0.48 0.47 0.45
TV: news and politics 0.78 0.73 0.71 0.72 0.70
Newspaper: other 0.24 0.23 0.23 0.22 0.20
Radio: other 0.93 0.92 0.90 0.85 0.85
TV: other 1.23 1.25 1.23 1.21 1.24
Table 3: Basic Model, Exogenous vs. Endogenous Beliefs
OLS OLS IV IV IV
(1) (2) (3) (4) (5) (6) (7) (8)
Openness Openness Belief econ. Openness Belief econ. Openness Belief econ. Openness
Belief economy 0.469a 0.567a 0.618a 0.598a
(0.013) (0.045) (0.049) (0.038)
Political left 0.060a 0.035a 0.056a 0.030a 0.057a 0.027a 0.058a 0.028a
(0.004) (0.002) (0.003) (0.003) (0.005) (0.003) (0.005) (0.003) Upper secondary education 0.051a 0.031a 0.045a 0.027a 0.041a 0.025a 0.043a 0.026a
(0.004) (0.003) (0.003) (0.003) (0.003) (0.004) (0.003) (0.003) Tertiary education 0.141a 0.079a 0.130a 0.066a 0.126a 0.059a 0.126a 0.062a (0.006) (0.005) (0.005) (0.007) (0.005) (0.007) (0.005) (0.006) Urban 0.022a 0.011a 0.024a 0.009a 0.023a 0.008a 0.024a 0.008a (0.003) (0.003) (0.003) (0.003) (0.003) (0.003) (0.003) (0.003) Unemployed -0.029a -0.014a -0.032a -0.011a -0.023a -0.009b -0.025a -0.010a (0.006) (0.004) (0.006) (0.004) (0.006) (0.004) (0.006) (0.004) Inactive 0.005b 0.004c 0.001 0.003 0.003 0.003 0.002 0.003 (0.002) (0.002) (0.002) (0.002) (0.002) (0.002) (0.002) (0.002) Immigrant background 0.056a 0.022a 0.066a 0.015a 0.066a 0.011a 0.063a 0.013a (0.005) (0.004) (0.007) (0.004) (0.007) (0.004) (0.007) (0.004) Regional unemployment -0.005a -0.002a -0.005a -0.002b -0.004a -0.001b -0.004a -0.002b (0.001) (0.001) (0.001) (0.001) (0.001) (0.001) (0.001) (0.001)
State of health services 0.161a 0.114a
(0.007) (0.006) Job of government 0.188a 0.152a (0.012) (0.011) Adj. R-Square 0.12 0.27 0.14 0.26 0.15 0.25 0.16 0.26 Hansen J stat 0.72 Chi-sq P-value 0.39 Kleibergen-Paap F stat 494.2 244.9 294.4 Durbin-Wu-Hausman 4.50 5.44 6.09 Chi-sq P-value 0.03 0.02 0.01 Observations 121445 121445 121445 121445 121445 121445 121445 121445
Standard errors in parentheses, clustered at the country × year level.
All estimations control for age group and sex, and include country and year dummies. Reference categories for categorical variables: Primary education; Employed; Rural; No immigrant background.
c
Table 4: Role of Media Exposure
IV IV IV IV
(1) (2) (3) (4) (5) (6) (7) (8)
Belief econ. Openness Belief econ. Openness Belief econ. Openness Belief econ. Openness
Belief economy 0.597a 0.596a 0.597a 0.596a
(0.038) (0.038) (0.038) (0.038)
Political left 0.058a 0.028a 0.056a 0.027a 0.057a 0.028a 0.056a 0.027a
(0.005) (0.003) (0.005) (0.003) (0.005) (0.003) (0.005) (0.003) Upper secondary education 0.043a 0.026a 0.040a 0.025a 0.040a 0.024a 0.037a 0.023a
(0.003) (0.003) (0.003) (0.003) (0.003) (0.003) (0.003) (0.003) Tertiary education 0.125a 0.061a 0.117a 0.058a 0.117a 0.057a 0.110a 0.055a (0.005) (0.006) (0.005) (0.006) (0.005) (0.006) (0.005) (0.006) Urban 0.024a 0.008a 0.022a 0.008a 0.023a 0.008a 0.022a 0.008a (0.003) (0.003) (0.003) (0.003) (0.003) (0.003) (0.003) (0.003) Unemployed -0.024a -0.009b -0.022a -0.008b -0.017a -0.006 -0.016a -0.006 (0.006) (0.004) (0.006) (0.004) (0.006) (0.004) (0.005) (0.004) Inactive 0.002 0.003 0.001 0.003 0.005b 0.005b 0.004c 0.005b (0.002) (0.002) (0.002) (0.002) (0.002) (0.002) (0.002) (0.002) Immigrant background 0.062a 0.012a 0.061a 0.012a 0.062a 0.012a 0.062a 0.012a (0.007) (0.004) (0.007) (0.004) (0.007) (0.004) (0.007) (0.004) Regional unemployment -0.004a -0.002b -0.004a -0.002b -0.004a -0.001b -0.004a -0.001b (0.001) (0.001) (0.001) (0.001) (0.001) (0.001) (0.001) (0.001) All media: all content -0.003a -0.003a
(0.001) (0.001)
All media: news and politics 0.011a 0.002b
(0.001) (0.001)
All media: other -0.009a -0.005a
(0.001) (0.001)
Newspaper: all content 0.015a 0.006a
(0.002) (0.002)
Radio: all content 0.000 -0.002c
(0.001) (0.001)
TV: all content -0.015a -0.008a
(0.002) (0.001)
Newspaper: news and politics 0.034a 0.012a
(0.003) (0.004)
Radio: news and politics 0.011a 0.003b
(0.002) (0.001)
TV: news and politics -0.004c -0.005a
(0.002) (0.002) Newspaper: other -0.005 -0.000 (0.003) (0.003) Radio: other -0.004a -0.004a (0.001) (0.001) TV: other -0.017a -0.009a (0.002) (0.002)
State of health services 0.113a 0.115a 0.114a 0.114a
(0.006) (0.006) (0.006) (0.006) Job of government 0.152a 0.150a 0.152a 0.151a (0.011) (0.011) (0.011) (0.011) Adj. R-Square 0.16 0.26 0.17 0.26 0.17 0.26 0.17 0.26 Hansen J stat 0.71 0.61 0.71 0.65 Chi-sq P-value 0.40 0.44 0.40 0.42 Kleibergen-Paap F stat 297.4 302.5 302.0 301.4 Durbin-Wu-Hausman 6.08 6.35 6.35 6.55 Chi-sq P-value 0.01 0.01 0.01 0.01 Observations 121445 121445 121445 121445 121445 121445 121445 121445
Standard errors in parentheses, clustered at the country × year level.
All estimations control for age group and sex, and include country and year dummies. Reference categories for categorical variables: Primary education; Employed; Rural; No immigrant background.
c
Figure 1: Effect of Media Exposure on Beliefs by Groups Matched on Age, Education, Political Orientation and Employment Status -.1 0 .1 .2 .3
Newspaper: news and politics
-.1 -.05 0 .05 .1 .15
Radio: news and politics
-.15 -.1 -.05 0 .05 .1
TV: news and politics
-.2 -.1 0 .1 .2 .3 Newspaper: other -.1 -.05 0 .05 .1 Radio: other -.1 -.05 0 .05 .1 TV: other
Figure 2: Effect of Media Exposure on Policy Preferences by Groups Matched on Age, Education, Political Orientation and Employment Status -.4 -.2 0 .2 .4
Newspaper: news and politics
-.2
-.1
0
.1
Radio: news and politics
-.1 -.05 0 .05 .1 .15
TV: news and politics
-.3 -.2 -.1 0 .1 .2 Newspaper: other -.1 -.05 0 .05 Radio: other -.15 -.1 -.05 0 .05 TV: other
Table 5: Effect of Media Exposure on Beliefs and Policy Preferences by Groups Matched on Age, Education, Political Orientation and Employment Status: Share of the Sample for which Coefficients Are Significantly Positive or Negative (in %)
Belief econ. Preferences
Negative coeff. Positive coeff. Negative coeff. Positive coeff.
Newspaper: news and politics 0.0 62.4 0.0 8.6
Radio: news and politics 0.0 21.6 0.5 18.9
TV: news and politics 5.2 7.2 20.0 0.2
Newspaper: other 12.5 0.2 7.9 6.3
Radio: other 18.0 1.6 19.9 0.0
TV: other 69.5 0.0 34.6 0.0
Figure 3: Heterogeneity of the Belief Coefficient by Country
PL CH DK HU FR GB NO SE ES FI BE IE SI NL DE .2 .4 .6 .8 1
Table 6: Openness to Dissimilar Immigration, Basic Model and Role of Media Exposure
OLS OLS IV IV
(1) (2) (3) (4) (5) (6)
Openness Openness Belief econ. Openness Belief econ. Openness
Belief economy 0.539a 0.610a 0.607a
(0.012) (0.034) (0.034)
Political left 0.079a 0.050a 0.058a 0.046a 0.056a 0.045a
(0.004) (0.003) (0.005) (0.003) (0.005) (0.003) Upper secondary education 0.051a 0.028a 0.043a 0.025a 0.037a 0.023a (0.004) (0.003) (0.003) (0.004) (0.003) (0.003) Tertiary education 0.150a 0.079a 0.126a 0.069a 0.110a 0.061a (0.005) (0.004) (0.005) (0.005) (0.005) (0.005) Urban 0.028a 0.016a 0.024a 0.014a 0.022a 0.013a (0.003) (0.003) (0.003) (0.003) (0.003) (0.003) Unemployed -0.026a -0.008c -0.025a -0.006 -0.016a -0.001 (0.007) (0.005) (0.006) (0.005) (0.005) (0.004) Inactive 0.004 0.002 0.002 0.002 0.004c 0.003 (0.002) (0.002) (0.002) (0.002) (0.002) (0.002) Immigrant background 0.057a 0.018a 0.063a 0.012a 0.062a 0.011a (0.006) (0.003) (0.007) (0.003) (0.007) (0.003) Regional unemployment -0.005a -0.002a -0.004a -0.001b -0.004a -0.001b (0.001) (0.001) (0.001) (0.001) (0.001) (0.001)
Newspaper: news and politics 0.034a 0.010a
(0.003) (0.004)
Radio: news and politics 0.011a 0.006a
(0.002) (0.002)
TV: news and politics -0.004c -0.004b
(0.002) (0.002) Newspaper: other -0.005 -0.006c (0.003) (0.003) Radio: other -0.004a -0.005a (0.001) (0.001) TV: other -0.017a -0.010a (0.002) (0.002)
State of health services 0.114a 0.114a
(0.006) (0.006) Job of government 0.152a 0.151a (0.011) (0.011) Adj. R-Square 0.14 0.32 0.16 0.32 0.17 0.32 Hansen J stat 0.21 0.12 Chi-sq P-value 0.65 0.73 Kleibergen-Paap F stat 294.4 301.4 Durbin-Wu-Hausman 3.53 4.13 Chi-sq P-value 0.06 0.04 Observations 121445 121445 121445 121445 121445 121445
Standard errors in parentheses, clustered at the country × year level.
All estimations control for age group and sex, and include country and year dummies. Reference categories for categorical variables: Primary education; Employed; Rural; No immigrant background.
Figure 4: Heterogeneity of the Media Coefficients on Beliefs by Country IE HU SI DEGB ESNLBENO PLFRCH DKFI SE -.02 0 .02 .04 .06 .08
Newspaper: news and politics
FISI NL DE BEPLNOCH HU SEDKES GB IE FR -.02 0 .02 .04
Radio: news and politics
FR HUDEIEGBSE DK NO BEPLCH NLSI FI ES -.03 -.02 -.01 0 .01 .02
TV: news and politics
FR GBIE BEDK SENOSI PLCHDENL HUES FI -.04 -.02 0 .02 .04 Newspaper: other DK GBNO FRBESEFI CH NL SI DE HUES PLIE -.02 -.01 0 .01 Radio: other DE GBCH BESEFR IE DK FI NL NOHU PLES SI -.03 -.02 -.01 0 .01 TV: other
Table 7: Probit Estimations
(1) (2)
Openness - probit Openness - IV probit
Belief economy 0.730a 0.973a
(0.021) (0.044)
Political left 0.059a 0.046a
(0.005) (0.006)
Upper secondary education 0.053a 0.042a
(0.008) (0.008) Tertiary education 0.132a 0.103a (0.011) (0.013) Urban 0.022a 0.017a (0.006) (0.005) Unemployed -0.021b -0.014c (0.009) (0.008) Inactive 0.010c 0.008 (0.005) (0.005) Immigrant background 0.026a 0.008 (0.010) (0.010) Regional unemployment -0.004a -0.002c (0.001) (0.001)
Newspaper: news and politics 0.030a 0.021a
(0.007) (0.007)
Radio: news and politics 0.008a 0.005c
(0.003) (0.003)
TV: news and politics -0.011a -0.010a
(0.004) (0.004) Newspaper: other -0.005 -0.003 (0.005) (0.005) Radio: other -0.007a -0.006a (0.002) (0.002) TV: other -0.018a -0.013a (0.003) (0.003) Observations 121445 121445
Standard errors in parentheses, clustered at the country × year level.
All estimations control for age group and sex, and include country and year dummies. Reference categories for categorical variables: Primary education; Employed; Rural; No immigrant background.
c


![[PDF] Cours d'informatique générale pdf | Cours informatique](data:image/gif;base64,R0lGODlhAQABAIAAAP///wAAACH5BAEAAAAALAAAAAABAAEAAAICRAEAOw==)