HAL Id: hal-03094081
https://hal.archives-ouvertes.fr/hal-03094081
Submitted on 4 Jan 2021
HAL is a multi-disciplinary open access
archive for the deposit and dissemination of
sci-entific research documents, whether they are
pub-lished or not. The documents may come from
teaching and research institutions in France or
abroad, or from public or private research centers.
L’archive ouverte pluridisciplinaire HAL, est
destinée au dépôt et à la diffusion de documents
scientifiques de niveau recherche, publiés ou non,
émanant des établissements d’enseignement et de
recherche français ou étrangers, des laboratoires
publics ou privés.
SIMULATING THE IMPACT OF CLIMATE CHANGE
ON VITICULTURAL SYSTEMS IN VARIOUS
EUROPEAN VINEYARDS
Cyril Tissot, Mathias Rouan, Théo Petitjean, Laurence David, Renan Le
Roux, Hervé Quénol, Etienne Neethling, Laure de Resseguier, Cornelis van
Leeuwen, Irima Liviu, et al.
To cite this version:
Cyril Tissot, Mathias Rouan, Théo Petitjean, Laurence David, Renan Le Roux, et al..
SIMULAT-ING THE IMPACT OF CLIMATE CHANGE ON VITICULTURAL SYSTEMS IN VARIOUS
EU-ROPEAN VINEYARDS. XIIIth International Terroir Congres, Sep 2020, Adelaide, Australia.
�hal-03094081�
SIMULATING THE IMPACT OF CLIMATE CHANGE ON VITICULTURAL SYSTEMS
IN
VARIOUS EUROPEAN VINEYARDS
Authors:
Cyril Tissot1*, Mathias Rouan1, Théo Petitjean2, Laurence David1, Renan Le Roux3, Hervé Quenol4,Etienne Neethling5, Laure de Resseguier2, Cornelis van Leeuwen2, Irima Liviu6, Cristi Patriche6
1 UMR 6554 CNRS LETG, Brest, France 2 ISVV, Villenave-d'Ornon, France
3 CIRAD, Montpellier, France 4 UMR 6554 CNRS LETG, Rennes, France
5
ESA, Angers, France
6 University of Agricultural Sciences, Iasi, Romania
*Corresponding author: cyril.tissot@univ-brest.fr
Aim: Global climate change affects regional climates and hold implications for wine growing regions worldwide
(Jones, 2007 and 2015; Van Leeuwen and Darriet, 2016). The prospect of 21st century climate change consequently is one of the major challenges facing the wine industry (Keller, 2010). They vary from short-term impacts on wine quality and style, to long-term issues such as varietal suitability and the economic sustainability of traditional wine growing regions (Schultz and Jones 2010 ; Quénol 2014). Within the context of a global changing climate, we have decided to develop a modelling approach, able to simulate the impact of environmental conditions and constraints on vine behaviour and to highlight potential adaptation strategies according to different climate change scenarios.
Methods and results: Our modeling approach, named SEVE (Simulating Environmental impacts on Viticultural
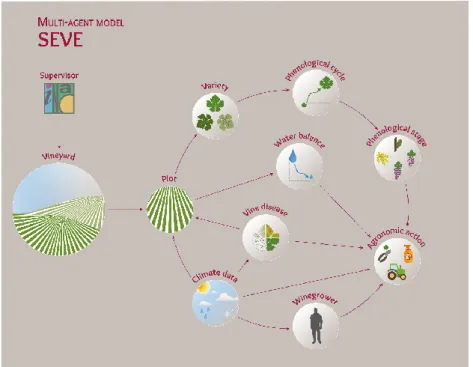
Ecosystems), present a generic modeling environment for simulating grapevine growth and berry ripening under different conditions and constraints (slope, aspect, soil type, climate variability...) as well as production strategies and adaptation rules according to climate change scenarios. Each activity is represented by an autonomous agent able to react and adapt its reaction to the variability of environmental constraints. Agents are distinguished according to their objectives: "Supervisors" Agent plays an overseeing role in the model, “Winegrower” Agents aim to grow grapes and produce wine that meets precise specifications according to their end-product goals and "Vine" Agents are grape production entities. The relationships between these three types of agents determine the production strategies adopted by the winegrowers.
According to two scenarios of climate change, several prospective simulation have been implemented, in the context of the european ADVICLIM project (http://www.adviclim.eu/), to compare adaptation strategies on a European scale. Through different experiments in France, United Kindgom, Romania, Germany and Spain, SEVE model provide potential adaptation strategies tendencies from short-term to long-term adjustment. Simulation results underline that small scale variability is strongly linked with vine phenology stages and ripeness potential. Over the next century, winegrowers will likely be confronted by increasing temperatures and changing rainfall patterns that will have important impacts on agronomic practices (increase/decrease of fungicide treatments or soil management practices depending on site and scenario) and adaptation strategies (management of frost risk or heat waves, plant material adaptation, change in vine training system…).
Conclusion: The modelling approach presented in this paper addresses the impact of environmental conditions
and constraints on vine behaviour and management strategies. SEVE model is able to reproduce the dynamics of vine growing and agronomic choices and practices according to climate variability. In the context of climate change, such a dynamic model will help to better assess potential impacts on vine behaviour and to identify potential adaptation pathways.
1. Introduction
Global climate change affects regional climates and hold implications for wine growing regions worldwide (Jones, 2007 and 2015; Van Leeuwen and Darriet, 2016). Grapevine growth and health, grape yield and quality are strongly related to local environmental conditions and constraints (Jackson and Lombard, 1993; Tesic et al., 2002; Van Leeuwen et al., 2004; Carey et al., 2008, Bonada and Sadras, 2015). To that end, spatial and temporal climate variations play a major role on the seasonal rhythm of vine phenology and grape ripeness at harvest (Huglin and Schneider, 1998).
The prospect of 21st century climate change consequently is one of the major challenges facing the wine industry (Keller, 2010). They vary from short-term impacts on wine quality and style, to long-term issues such as varietal suitability and the economic sustainability of traditional wine growing regions (Schultz and Jones 2010 ; Quénol 2014). These environmental variations together with grapevine behaviour and winegrowers' end-product objectives will greatly influence vineyard management practices and decision making at plot- to farm-level (Coulon et al., 2012; Neethling et al., 2016).
Although winegrowers are constantly adapting to internal and external factors, it seems relevant to develop tools, which will allow them to better define actual and future agro-climatic potentials and therefore ensure quality and unique wine production. Within this context, we have decided to develop a modelling approach, able to simulate the impact of environmental conditions and constraints on vine behaviour and agronomic practices. Thanks to the ADVICLIM project (http://www.adviclim.eu/) a multi-agents model has been implemented and tested in 6 pilots sites in Europe in order to simulate vine phenology, viticultural practices and highlight potential adaptation strategies according to two scenarios of climate change.
2. Materials and methods
The proposed modelling approach aims to link environmental and agronomic observations with the need to optimize farming strategies at plot scales (Barbeau et al., 2001 ; Asselin et al., 2003). To address all the factors leading to viticultural management we have chosen to implement a generic model focus on simulating agronomic practices and production strategies depending on environmental conditions an constraints (vine phenology, water balance and water stress, end-product objectives, winegrowers strategy…).
2.1 The SEVE model
The baseline of SEVE model has three main class of Agents:
- the "Supervisor" Agent plays a overseeing role in the model. It sets the specifications of the various wine designations and imposes specific grape and wine production regulations. It is directly related to the “Winegrowers” and ‘Plot” Agents, who provide synthetic information about phenology (i.e. bioclimatic indices values) and agronomic action (i.e. number of fungicide treatment). According to this information, the “Supervisor” agent may modify production policies and regulations;
- “Winegrower” Agents aim to grow grapes and produce wine that meets precise specifications according to their end-product goals. This action involves growing the grapevine in optimal conditions given the agronomic specificities of the wine grower’s plots;
- "Plot" Agents are grape production entities. They generally represent a vineyard plot or an entity deemed homogeneous in terms of agronomic features (definition based on local terroir units; Bodin and Morlat., 2006). The role of these agents is to reproduce grapevine growth and grape ripening dynamics, according to spatial and temporal environmental variations.
These three main classes are complemented by specific agents. The "Winegrowers" agents have "Winegrowing workers" and "Tractors" agents which enable them to implement agronomic actions. The "Plot" agents are associated with a "Pathogen" agent that simulates the dynamics of diseases such as mildew depending on climatic conditions. Finally, "Sensor" agents provide climate information (meteorological data, bioclimatic indices) useful to "Plot", "Winegrower" and "Supervisor" agents. According to biophysical properties of plots (topography, soils type, water reserve…) and climate condition SEVE model provide a general framework to simulates vine's phenological cycle and agronomic action (figure 1).
Figure 1: simplified modeling sequence of SEVE model 2.2 Knowledge base and calibration data
SEVE model mobilizes therefore an important knowledge base informing all biophysical and agronomic parameters of the grapevine. This database allows simulating grapevine phenology under environmental constraints and viticultural practices executed by the "Winegrower" agents. Hosted in a postgresql/postgis database server, this knowledge base is organised according to four main themes (figure 2).
Biophysical data Climate data Vine data Winegrower
Soil nature and type Maximum soil water holding capacity Topography (digital elevation model) Slope Geographical position and boundaries of vineyard plots
From weather stations (rainfall, humidity, temperature, wind speed, potential evapotranspiration) From data-loggers (temperature) From global climate model (CORDEX data at regional scale, same data as weather stations)
From statistical model (temperature simulated at local scale)
Vine variety and rootstock Training system
Planting density Row orientation Vine age
Dates of phenological stages for several years according to their climate profile
Working periods Agronomic practices Techniques and machinery involved Favourable and unfavorables climatic variables
Figure 2: Main themes of SEVE model database
Spatio-temporal data are integrated as individual or combined constraints on agent behaviour. In return, each agent is endowed with responsive capacities expressed through behaviour that changes according to environmental evolution. This process allows simulating grapevine phenology under environmental constraints and viticultural practices executed by the "Winegrower" agents. The "Vine" agent has many attributes related to the characteristics of the production plots (soil water reserves, slope index, soil specificity, ...). This agent following phenological stages during its growth cycle and reacts to climatic variability, and other disturbances (e.g. fungal diseases).
Informations concerning grapevine and agronomic practices have been collected through surveys conducted in the different pilot sites of the ADVICLIM program. These data have been useful to define criteria and constraints leading to the choice of agronomic actions. Management practices and decision-making process are based on decision trees. These decision trees allow to determine an agronomic itinerary for each vineyard plot according to the climatic profile of the year and the winegrower’s production strategies. The agronomic itinerary can integrate general agronomic actions (e.g. winter pruning, trimming,...) but also adaptation responses to climate
constraints (soil tillage, weed maintenance ... ). Therefore, the choice of an agronomic action or an adaptation tool is not only determined by grapevine behaviour or climate variability, it is also strongly dependent on production strategies, which vary among winegrowers according to their end-product objectives. In SEVE model, winegrower agents are created from three production profiles: conventional (traditional viticulture), integrated (limitation of pesticides, fertilizers and weeding) and organic (strong limitation of pesticides, mechanical weeding... ).
3. Main results.
Across different spatial and temporal scales, the modelling outputs provided results on:
The values of climate variables and bioclimatic indices that are specific to climatic requirements of grape growth and production.
The timing and duration of the key grapevine growing stages, in particular the stages related to grape development (flowering, veraison and harvest).
The agronomic practices undertaken during each simulated growing season, which not only varied because of environmental conditions and constraints, but also because of the production profile of each simulated winegrower.
With regards to the issues surrounding viticultural adaptation to climate change, the objective is to use these multi-scale results to respond to the need of developing local solutions to a changing climate. Firstly, model outputs for climate variables and bioclimatic indices are presented, followed in the second part by the evolution of agronomic practices. Finally, in a third part, some adaptation strategies are highlighted.
3.1 Climate variables and bioclimatic indices
In SEVE model grapevine growth dynamics uses simple algorithms based on bioclimatic indices (Winkler, GFV and Huglin) specific to grapevine behaviour. These indices allows to study climate variability and change in relation with local environment characteristics and type of grapevine variety. Looking at the pilot sites as a whole, there has been a significant increase in the value of bioclimatic indices on a European scale. If we consider Huglin Index this evolution is more or less significant depending on the site and the selected climate scenario (figure 3).
Figure 3: Evolution of the value of the Huglin Index in the different pilot sites according to two
climate change scenarios (RCP 4.5 and RCP 8.5)
This increase leads to a change in climate class for several vineyards. The evolution of temperatures affects the phenological cycle of the vine and leads to an advance in the phenological stages and an earlier reaching of technical maturity.
In St-Emilion pilot site (figure 4), for the most pressimistic scenario, the maturity can be reached one month before the current average date (at the end of the century). This precocity can be observed whatever the simulated pilot site.
Figure 4: Timing of key phenological stages according to different climate scenarios
This results show a strong annual variability in the grapevine development cycle. Indeed, key phenological stages (e.g. flowering, veraison) are much depended on the climatic characteristics of each season. For historical period the agreement with the agronomic observations that were carried, validating the model outputs on grapevine phenology.
3.2 Agronomic practices
Climate variability affects agronomic practices, i.e. their timing and frequency depending on the conditions of each growing season. In hot and dry climate contexts, shallow soil tillage activities were favoured to reduce the grapevine water stress and allow a more optimal soil water availability. In normal to wet years, inter-cropping management practices were used to manage grapevine vigour, increase soil tractability and reduce erosion risks. For specific practices such as the use of pesticides, they were less correlated to the global climatic profile of the growing season as they depended more on daily temperatures and rainfall amounts, which are highly variable over time.
The agronomic actions are simulated at plot scale in SEVE model. According to winegrower strategy an agronomic itinerary can be calculated for each year. The results are displayed in dynamic graphs integrated into a story map1
(figure 5). The more general practices such as pruning or trimming only varied in timing depending the grapevine phenology, but not significantly in frequency. Understanding the human dimension of decision making is extremely important in the context of climate change, as each winegrower will respond differently to changing environmental conditions. Simulation outputs highlight an increase in the number of actions varying according to the pilot site and the winegrower's production profile. The comparison of the number of actions on a global scale is not very relevant because the agronomic itinerary is very different depending on the vineyard and the style of wine produced.
1 A story map is a dynamic tool that allows end users to explore a subject through various communication tools
(images, videos, interactive maps, data, figures, and text). The interactive document can be consulted at the following address https://www.adviclim.eu/storymap
Figure 5: Agronomic action variability at plot scale in Cotnari pilot site for scenario 8.5
At the local scale, for example at the Layon pilot site, simulation results show a significant increase in the number of actions, especially for organic plots (figure 6). This result is largely related to the increase in the number of fungicide treatments. In organic production, the use of contact products requires a high spray frequency during periods of pathogenic risk (a few days between each spay depending on rainfall frequency). In conventional production, by using systemic product, wine growers reduce significantly this frequency (usually at least 15 days between spraying).
Figure 6: Comparison of agronomic action numbers between two climate change scenarios
(RCP 4.5 and RCP 8.5) during 2030-2050 period for Coteaux du Layon pilot site
These results show that with a changing climate, The risk of disease is higher in most of the pilot sites. In some cases, the increased earliness of the grapevine partly compensates this risk by reducing the exposure period.
3.3 Adaptation strategies
With an expected increase in temperatures over the next century, the prospective simulations show that phenology will become earlier (e.g. in Bordeaux as shown in figure 4), regardless of the climate scenario. One of the principal challenges for winegrowers will be to manage increasing temperatures in order to delay grapevine phenology. Indeed, optimal grape ripening should occur in Europe during the month of September. A too early onset of ripening will lead to unbalanced grape compositions.
There are several options that winegrowers can employ, where each option vary in its effectiveness. They vary from short-term and less effective adjustments in harvest management practices to long-term and effective measures in varietal selection (e.g. clonal selection or choice in grapevine variety).
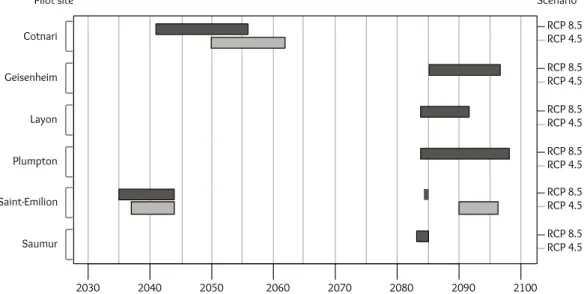
Simulations were carried out to test the conditions for a change of grape variety. They are based on a decision rule of the winegrower who makes a change of grape variety when the technical maturity of the vine occurs 1 month before the current average maturity date at least 4 years out of 10. At global scale, the model outputs show that all sites are affected by a change of grape variety which occurs more or less early depending on local climate conditions (figure 7)
Figure 7: Potential period of vine variety change according to two climate change scenarios
(RCP 4.5 and RCP 8.5)
On a local scale, the change of grape variety can take place at different periods depending on the initial variety cultivated in the plot and the differences in temperature observed in the vineyard concerned. In Romania, on Cotnari pilot site for example (figure 8), differences of several years can be observed between changes of grape varieties. The choice of the replacement grape variety varies according to the style of wine targeted. In this vineyard the Merlot and Cabernet Sauvignon grape varieties could be suited to future climate projection and local environmental conditions.
Figure 8: Comparison of variety change dates in three test plots in the Cotnari pilot site
3. Conclusion
The modelling approach presented in this action addresses the impact of environmental conditions and constraints on grapevine behaviour and the dynamics of viticultural activities. Through the development of this modelling approach, the impact of climate variability on grapevine performance and winegrowers’ production strategies was specifically targeted, both over time and space. The results obtained during the ADVICLIM project show that SEVE model is able to reproduce the dynamics of vine growing and agronomic choices and practices according to climate variability. In the context of climate change, such a dynamic and complex model will help to better assess potential impacts on viticulture and to frame adaptation solutions at different temporal and spatial scales.
Thanks to this approach, simulation outputs illustrate some potential agronomic strategies among a set of potential strategies. However, even if we used bias-corrected climate data, there is uncertainty in the data included in SEVE and the model at different scales propagates this uncertainty. Therefore, the results must be interpreted with caution given this uncertainty.
Cotnari Geisenheim 2030 2040 2050 2060 2070 2080 2090 2100 Scenario Pilot site Layon Plumpton Saint-Emilion Saumur RCP 8.5 RCP 4.5 RCP 8.5 RCP 4.5 RCP 8.5 RCP 4.5 RCP 8.5 RCP 4.5 RCP 8.5 RCP 4.5 RCP 8.5 RCP 4.5
V2-sFe / Feteasca alba V1-rFe / Feteasca alba
2030 2040 2050 2060 2070 2080 2090 2100 Scenario Plot / Vine variety
T1-vFe / Feteasca alba
Vine variety change: Cabernet sauvignon Merlot
RCP 8.5 RCP 4.5 RCP 8.5 RCP 4.5 RCP 8.5 RCP 4.5 T1-vFe V1-rFe V2-sFe
Many perspectives are still considered. They are mainly focused on improvements for assessing various adaptation measures on grapevine growth and grape quality. Technically, this means introducing feedback loops in the model in order to simulate the implications of viticultural practices on the grapevine (level of vigour, vine earliness, resistance to pathogens, etc.). The integration of other indicators including measuring the potential quality of grapes at harvest is also considered.
4. Acknowledgments
This research are supported by the european comission LIFE program (ADVICLIM project, ADapatation of VIticulture to CLIMate change: High resolution observations of adaptation scenarii for viticulture, LIFE13 ENVFR/001512). The authors gratefully acknowledge winegrowers involved in this research program.
5. References
ASSELIN C.,BARBEAU G.,MORLAT R., 2003. Les terroirs viticoles : du concept au produit. In « Terroir, Zonazione,
Viticoltura. Trattado internazionale » de Mario Fregoni, Danny Schuster, Andrea Paoletti (Ed), Phytoline Editore, 159-186.
BARBEAU G.,CADOT Y.,STEVEZ L.,BOUVET M.H.,COSNEAU M.,ASSELIN C.,MEGE A., 2001. Role of soil physical
properties, climate and harvest period on must composition, wine type and flavour (Vitis vinifera L, cv chenin), Coteaux du Layon, France. Proceedings of the 26th world congress of the OIV Adelaide, Australia, 105-118.
BONADA M.,SADRAS V.O., 2015. Review: critical appraisal of methods to investigate the effect of temperature on
grapevine berry composition. Aust. J. Grape Wine Res. 21, 1-17. doi: 10.1111/ajgw.12102.
CAREY V.,SAAYMAN,D.,ARCHER,E.,BARBEAU G.,WALLACE,M.,2008. Viticultural terroirs in Stellenbosch, South Africa. I. The identification of natural terroirs units. J. Int. Sci. Vigne Vin, 42(4), 169-183.
COULON-LEROY C.,MORLAT R.,BARBEAU G.,GARY C.,THIOLLET-SCHOLTUS M.,2012. The Vine Functioning Pathway, A New Conceptual Representation. Sustainable Agriculture Reviews, volume 11, 241-264. doi : 10.1007/978-94-007-5449-2_10
JONES G.V., 2007. Climate Change: Observations, Projections, and General Implications for Viticulture and Wine
Production, Practical Winery and Vineyard, 44-64.
JONES,G.V., 2015. A Global Perspective in Grapevine in a Changing Environment. In Grapevines in a Changing
Environment: A Molecular and Ecophysiological Perspective. Edited by Hernâni Gerós, Maria Manuela Chaves, Hipolito Medrano Gil, Serge Delrot. Wiley-Blackwell, 400 p.
KELLER M., 2010. Managing grapevines to optimise fruit development in a challenging environment: A climate
change primer for viticulturists. Aust. J. Grape Wine Res., 16, 56-69. doi:10.1111/j.1755-0238.2009.00077
LESCOT,J.,ROUIRE,M.,RAYNAL,M.ROUSSET S., 2014. Bio-economic modeling of wine grape protection strategies
for environmental policy assessment, Operational Research International Journal, 14, 283-318. doi:10.1007/s12351-014-0152-y
NEETHLING,E.,PETITJEAN,T.,QUÉNOL,H.,&BARBEAU,G., 2016. Assessing local climate vulnerability and winegrowers’
adaptive processes in the context of climate change. Mitigation and Adaptation Strategies for Global Change, Springer Verlag, 1-27. doi:10.1007/s11027-015-9698-0
QUÉNOL H.,GROSSET M.,BARBEAU G.,VAN LEEUWEN K.,HOFMANN M.,FOSS C.,IRIMIA L.,ROCHARD J.,BOULANGER J.P., TISSOT C. AND MIRANDA C., 2014. Adaptation of viticulture to climate change: high resolution observations of
adaptation scenario for viticulture: the adviclim european project. Bulletin de l'OIV, 87, 395-406.
SCHULTZ H.R.,JONES G.V., 2010. Climate induced historic and future changes in viticulture. J Wine Res 21,
137-145. doi: 10.1080/09571264.2010.530098
TESIC,D.,WOOLLEY,D.J.,HEWETT,E.W.,MARTIN,D.J., 2002. Environmental effect on cv Cabernet Sauvignon (Vitis
Vinifera L.) grown in Hawkes Bay, New Zealand, 1. Phenology and characterization of viticultural environments: Aust. J. Grape Wine Res., 8, 15-26. doi:10.1111/j.1755-0238.2002.tb00207.x
VAN LEEUWEN,C.,DARRIET,P., 2016. The impact of climate change on viticulture and wine quality. Journal of
Wine Economics, 11(1), 150-167. doi:10.1017/jwe.2015.21
VAN LEEUWEN C.,FRIANT P.,CHONE X.,TREGOAT O.,KOUNDOURAS S.,DUBOURDIEU D. (2004). The influence of climate,