An Adaptive User Interface for Open Educational
Content
by
Vijay Umapathy
Submitted to the Department of Electrical Engineering and Computer
Science
in partial fulfillment of the requirements for the degree of
Master of Engineering in Electrical Engineering and Computer Science
at the
MASSACHUSETTS INSTITUTE OF TECHNOLOGY
June 2011
c
Massachusetts Institute of Technology 2011. All rights reserved.
Author . . . .
Department of Electrical Engineering and Computer Science
May 3, 2011
Certified by . . . .
Dr. Eric Klopfer
Associate Professor
Thesis Supervisor
Accepted by . . . .
Dr. Christopher J. Terman
Chairman, Department Committee on Graduate Theses
An Adaptive User Interface for Open Educational Content
by
Vijay Umapathy
Submitted to the Department of Electrical Engineering and Computer Science on May 3, 2011, in partial fulfillment of the
requirements for the degree of
Master of Engineering in Electrical Engineering and Computer Science
Abstract
For my Masters of Engineering thesis project, I have developed a framework of meta-data around open educational resources that are used by students to master a given concept. Based on the assumption that a course can be broken down into specific concepts and that there are several resources available to students both on sites such as OpenCourseWare and also peer-managed resources like Wikipedia, I develop a model for ”relevance” of a resource to the learning of a given concept, where relevance is defined by assignment to a concept by a teacher as well as usage data from students viewing the resources. I combine both active feedback (clicking a ”like” button) and passive feedback (view duration and count across all users) to score each resource for a given concept. This score is then used to create an adaptive user interface that indicates which resources may be the most relevant for students learning a given concept based on their peers’ feedback. In addition to designing this framework, I provide an implementation of the adaptive user interface on Apple’s iPad device, and I provide an evaluation of the educational benefits of this adaptive interface by designing and executing a controlled user study on students in MIT’s introductory physics course.
Thesis Supervisor: Dr. Eric Klopfer Title: Associate Professor
Acknowledgments
I would first and foremost like to thank my parents, Mala Umapathy and Murrali Rangarajan, as well as my three sisters, Shalu, Taara, and Vinitha, for their love and support over the years and especially through this past year. I would also like to thank and acknowledge my late father, Dr. Srinivasan Umapathy, whose dream it was for me to one day attend MIT.
I would like to thank my thesis supervisors, Professor Eric Klopfer, Brandon Mu-ramatsu, and Dr. M.S. Vijay Kumar, for providing me with mentorship on this project, from conceiving an idea, designing a thesis project, turning that project into a reality, and assessing its performance.
I would like to thank Professor Peter Dourmashkin for volunteering his time and resources to help me create a user test that could be successfully implemented with his own Electricity and Magnetism students this Spring. I would also like to thank Professor John Belcher and Eric Hudson for helping me reach out to their students as well.
I would like to thank Judith Medeiros-Adams of the MIT COUHES office for her professionalism and patience in teaching me about how to design a proper user study and helping me ensure that my user study was compliant with human subjects regu-lations.
Last, I would like to thank all the professors over the last five years who have helped shape me into the engineer I am today. You have not only taught me, but empowered me, and there is no greater gift.
Contents
1 Introduction 13
1.1 Motivation . . . 13
1.2 Thesis Goals . . . 14
2 Related Work 17 2.1 Open Educational Resources for Self-Paced Learners . . . 17
2.2 Content Rating Systems . . . 20
2.2.1 Content Filtering . . . 20 2.2.2 User Metadata . . . 21 3 System Design 23 3.1 Overview . . . 23 3.2 Data Model . . . 24 3.3 Client Application . . . 26 3.4 Client-Server Interaction . . . 29 3.4.1 Server Architecture . . . 29 3.4.2 Client-Server Protocol . . . 30 3.5 Teacher Interface . . . 34 4 User Study 37 4.1 Study Goals and Research Question . . . 37
4.2 Participants . . . 38
4.4 Conditions . . . 40 4.5 Measurements . . . 41 4.5.1 Survey Responses . . . 41 4.5.2 Standardized Test . . . 42 4.6 Further Observations . . . 43 5 Results 45 5.1 Performance Metrics . . . 45 5.2 Usage Patterns . . . 46
6 Conclusions and Contributions 53 6.1 Conclusions . . . 53
6.2 Further Work . . . 55
6.2.1 User Modeling and Collaborative Filtering . . . 55
6.2.2 Enhanced Content Modeling . . . 56
6.3 Contributions . . . 57 A Client Application Screenshots 59 B List of Server-Side Scripts and Description 63 C Server-Side Database Schema 65
List of Figures
3-1 System Overview . . . 25
3-2 Domain Model . . . 25
3-3 Resource Cells in Client Interface . . . 28
3-4 Client-Server Protocol . . . 32
5-1 View Distribution in Control Group studying Biot-Savart Law . . . . 48
5-2 View Distribution in Experimental Group studying Biot-Savart Law . 48 5-3 View Distribution in Control Group studying Ampere’s Law . . . 49
5-4 View Distribution in Experimental Group studying Ampere’s Law . . 49
5-5 Total Viewing Time vs. Like Count for All Resources . . . 52
A-1 Concept Search View . . . 60
A-2 Adaptive Resource List View . . . 61
List of Tables
4.1 Rating Scale for Confidence in Ability to Articulate Concepts . . . . 42
4.2 Rating Scale for Ease of Finding Most Helpful Information . . . 42
5.1 Quantitative Results of Concept Quiz and Surveys . . . 46
C.1 Server-Side Database Schema: Concepts . . . 65
C.2 Server-Side Database Schema: Resources . . . 65
C.3 Server-Side Database Schema: Concept-Resource Relations . . . 66
Chapter 1
Introduction
1.1
Motivation
What will be the educational experience of the future? I envision that in this future, all information that students interact with is dynamic, ever changing and updating with the goal of always being able to convey knowledge to students in the most effec-tive way possible.
Already, as the internet has enabled high quality multimedia and the most rural of areas in the world begin to develop high bandwidth internet infrastructure, access to world- renowned professors in any subject is available at any time from anywhere in the world. It is in this spirit that OpenCourseWare was created as “a free and open digital publication of high quality university-level educational materials”, as stated by the OpenCourseWare Consortium. This content allows millions of students around the world to take courses - that is, view lecture videos, read lecture notes, and practice course content with the same exams and problem sets offered in the real classes.
However, this content, like a physical textbook, is only updated from time to time to add or correct the media itself rather than in response to needs or use, despite the fact that there is a significant amount of usage data that can be used to
im-prove the learning experience of students when using this content. In addition to being an archival form of information that is used by students enrolled in full-time courses, there is a growing population of self-learners who leverage web-based open educational resources to master entire subjects without the support of a classroom environment. These users could benefit from intelligent learning resources the most, as they do not have the layer of feedback from physically nearby students regarding the most relevant and helpful resources to view when attempting to learn a new con-cept.
To address the needs of self-paced learners, I believe that we need to create a medium of open educational resources that can intelligently leverage feedback from the very users that view these resources, taking into account the fact that today’s students have a choice in what resources they use to learn a new concept, and peer students are the best providers of feedback on which resources are best to use.
1.2
Thesis Goals
For my Master of Engineering thesis project, I propose to design a system that at-tempts to create a dynamic, constantly improving user experience for navigating OpenCourseWare materials. This system makes a series of assumptions about the manner in which students use these resources and the nature of the content presented in these systems:
1. A course that is archived on OpenCourseWare can be represented by some discrete set of concepts, or learning objectives.
2. A given educational resource such as a lecture video, a set of lecture notes, or a homework assignment can be related to one or more of these concepts. 3. A student who is using the system is actively trying to learn one of these
Given these assumptions, my system models a course as a discrete set of concepts and defines OpenCourseWare materials not as videos and documents but rather as learning resources in the context of specific concepts. With this framework and model of a course in place, we can now create an educational system that makes use of user data by modeling how relevant a resource really is when attempting to learn a given concept.
In my project, I present a ‘relevance model’ that is based solely on measurable usage information. The model takes as inputs passive usage information such as the amount of time that a user spends viewing a resource and the number of times that a resource was viewed in the context of a given concept, as well as active usage information such as a user click on a ‘thumbs-up’ button (an indication that the user found this re-source relevant to learning the concept that he or she was learning). This information is then used to compute a single ‘relevance value’ for a given resource, and this value is used to order the resources presented to the student by how relevant other students found that resource to be in the context of learning the same concept.
Ultimately, I seek to answer the following research question: If we create a framework of specific user-defined meta-data around open educational resources and define mea-surable metrics by which a system using this framework can learn from user feedback, can we create significant learning value for students who are using these resources to achieve specific learning goals?
Using the framework, relevance model, and dynamic user interface that this sys-tem presents, I hope to contribute a proof of concept for a completely new way of browsing OpenCourseWare materials that is context-specific and dynamically adapts its user interface based on both active and passive user feedback.
Chapter 2
Related Work
2.1
Open Educational Resources for Self-Paced
Learn-ers
In Opening Up Education, a collection of essays edited by Toru Iiyoshi and M.S. Vijay Kumar in 2008, a chapter by David Kahle introduces a framework of design for open educational technology and highlights one implementation of this method-ology. The framework suggests that open educational technologies must be designed for access, agency, ownership, participation, and experience [5]. While these terms are elaborated on individually, the core tenets of this design philosophy are that ed-ucational technology should be designed for a meaningful interaction with students, including access to information, the use of that information for productive learning, and active participation in building upon that information both on an individual and on a community level.
This chapter describes the work done at Tufts University in 2008 on a project called the Visual Understanding Environment (VUE), which was an open-source applica-tion that allowed teachers and students to visualize concepts and resources on a map and and navigate this map and establish relationships between ideas and the many multimedia resources that were uploaded onto the web and related to these ideas.
VUE is said to employ the aforementioned design philosophy to create a novel way of exploring content for a course in a map rather than in a pre-defined sequence that may be restrictive to students and is more common of currently existing Course Man-agement Systems.
I believe that this framework directly applies to the design of my system in that I am focusing on enabling both active and passive participation from students in rat-ing educational resources as well as framrat-ing open educational content in a way that empowers individual students to locate the resources that best help them learn from a course that they are already pursuing or even to discretize and conquer individual con-cepts of a course that they are taking using purely open educational materials. While the Visual Understanding Environment offers a great deal of flexibility, it requires a great deal of content creation on the part of the instructors, whereas my system re-quires instructors only to create metadata around resources to indicate their relevance to specific concepts. In the iteration of my system presented in this thesis, a teacher specifies these relationships, while metadata around student interest is generated by usage data and updated in real time.
Another research study, conducted by Dana Thomson of Northwestern University in 2010, examined student-teacher and student-content interaction in both classroom and online versions of the same courses in a variety of areas, specifically targeting the effects of independent learning on the experience of gifted students. Through a series of surveys and interviews, the study found that one of the biggest benefits of online learning was that students were able to learn at their own pace and make use of a large variety of multimedia resources in the context of their learning experi-ence, and for some students, taking control of their learning experience made them feel more accountable for their own learning [9]. Students tended to appreciate flexi-bility in deadlines and a choice of resources when given the task of learning a concept.
”Fragmen-tation of Culture, Learning, Teaching, and Technology” also agrees with this notion of breaking the mastery of knowledge domains into the mastery of small, ”just-in-time” chunks of learning that blend more with the tasks of life rather than existing as laborious work that must be conducted in large chunks. McCalla suggests that future students will not be burdened by textbooks and lectures, but rather will learn inde-pendently at their own pace, using technology to discover specific learning resources at the moment of need and, as educational technology advances, using technology to discover the moments of need and intervene when necessary [6].
This is exactly the kind of learning environment that is a key use case for the system developed in this thesis. Rather than assigning one chapter of a book, a teacher sim-ply asks that the student, either in a class or learning independently using an open curriculum, try to master a concept by looking at several of many choices of learning resources. My system would both provide an interface for students to discover these resources and also use their usage information to make easier the resource selection process for future students.
Since the beginning of my thesis research, MIT’s OpenCourseWare has made an effort to adapt its educational resources for individual learners and also connect these learners to one another through a program called OCW Scholar [3]. This part of OpenCourseWare is currently in its pilot stages and works in conjunction with a website called OpenStudy.com, which allows independent learners to join a virtual classroom with open educational materials and declare themselves as ‘peers’ to other students enrolled in the open course. This is very much in the spirit of my research, and while these programs currently make no use of usage data and adaptive interface elements when displaying a set of resources, it is my hope that my research can per-haps inspire a large-scale implementation of such features in a system such as OCW Scholar.
2.2
Content Rating Systems
There has been a variety of research conducted in the area of providing metadata around content to provide the best recommendations to both individual users and a population of users.
2.2.1
Content Filtering
A 2004 paper released by TiVo Inc. at the ACM SIGKDD conference described the system that TiVo, a television recording and recording system, uses to provide rec-ommendations of television shows to users based on their input of ‘thumbs-up’ or ‘thumbs-down’ for a given television show, which can be entered by pushing the ap-propriate button on the TiVo remote control when watching the show [1]. One of the key issues that TiVo faced when determining an implementation of this system was whether or not to keep an individual record of each user and his/her preferences, as both the number of total shows and the number of total users was very large. To address this problem, they created a system that simply sends the full set of all thumbs-up presses for a given user, which turns out to be a very small amount of data, and then returns a set of recommendations by using a matching algorithm called Collaborative Filtering to determine recommendations based on the thumbs-up data from similar users. Shows are cross-correlated based on the number of users that give them thumbs up or thumbs down ratings, so a constant size matrix is all that is required to be stored for each correlation, and this matrix can be updated in constant time with each update from the individual TiVo machines. The updated correlations can then provide individual users with up-to-date recommendations of shows that are predicted to be appealing to their individual taste.
Another system, developed by Basu et al., used an approach similar to collabora-tive filtering, in that movies were broken down into feature vector representations based on genre, keywords, actors, directors, etc [2]. However, instead of using col-laborative features and a colcol-laborative filtering algorithm (which leverages a series of
linear regressions to estimate the unknown rankings), the researchers turn the prob-lem into a binary classification probprob-lem (where each user has a learned classifier that determines whether he or she will either like or dislike a given movie). Their system uses a rule learning algorithm from a system called Ripper to predict the class (like or dislike) for a new movie based on the training sets of users who liked the movie, users who disliked the movie, and movies liked by the test user.
The server architecture of the TiVo system is very relevant to my project, since one of the key technical problems with an open educational system is providing high quality performance to millions of simultaneous users. A system that stored the state for each individual user or was inefficient in processing user updates would potentially face storage issues when scaled to be used as a fully functional open educational re-source where the number of users is very large. However, one of the problems faced by collaborative filtering systems is that they rely on a large number of provided ratings in order to provide accurate recommendations, since they are performing a series of linear regressions to estimate a very sparsely populated matrix, and unless feature vectors truly represent the underlying characteristics that define both content and users, it is difficult to achieve high performance with an online recommendation system. Instead of using machine learning with collaborative filtering or with a rule learning system such as that of Basu et. al., I use the fact that learners who are study-ing the same course are inherently similar in their learnstudy-ing goals, and by breakstudy-ing the course into concepts rather than creating a system for recommending any educational resource in any context, I significantly reduce the scope of the recommendation prob-lem to one where student attention and interest, if measured properly, can create a metric that will provide beneficial content recommendations in a context-appropriate way.
2.2.2
User Metadata
A 2006 study by Erik Duval et. al. described the notion of creating ‘Attention Meta-data’ from Apache server logs using data like page views, the duration that a user
was on a page, etc [7]. They used this information to create records in a format that they called AttentionXML, which tracked the context in which a user viewed information, the user’s level of interest in specific web resources, and any annotations or ratings of content provided by the user. The system that I create uses a metadata architecture that is very similar to AttentionXML, but I intend to use data that is calculated on each local iPad client rather than gathered from server logs. This way, the data-cleaning portion of many metadata server processes can be distributed to all the client systems.
Another study by Duval and Ochoa examined a variety of metrics for ranking the “relevance” of learning objects to a given user who is exploring a repository of open educational resources. Among these were “topical relevance”, or the number of times an object is used in similar courses, “personal relevance”, or the relevance based on the learning style of the user and his or her perceived information need, and ”situ-ational relevance”, or the learning task or context of the learning task that defines a specific learning objective or ability [4]. While my system does not focus on all of these metrics, its use of concepts, or concrete learning objectives, to define a course, allow resources to be strictly categorized based on situational relevance. Using the assumption that all students in the same classroom environment will benefit from peer feedback and share some similarities in their learning style, I use usage data as well as active feedback to provide a metric for personal relevance within the set of resources that are deemed situationally relevant. Rather than creating an overar-ching score as Duval and Ochoa propose in their paper, I instead use a hierarchical relevance scoring mechanism that reduces the scope of the relevance scoring problem but instead requires more concrete definition of metadata by the teacher.
Chapter 3
System Design
3.1
Overview
Ultimately, the goal of the system is to improve the user experience of learning from open educational resources. I seek to create a system that can achieve this goal while still leveraging existing open educational resources in their current form rather than requiring the creation of new, specialized resources. I also want to create a system that does not create a burdensome amount of data that must exist alongside the educational resources themselves and that scales well with a large number of users and a large set of educational resources.
With these design principles in mind, I create a framework of metadata around these resources that is based on two key assumptions:
• Students seek out and view resources in the context of learning a specific concept (a single idea or technique like “Kirchhoff’s Voltage Law” rather than a broad subject matter like “Electronics”)
• Resources that appear in the context of one concept may be relevant to learning multiple other concepts as well (i.e. resources that explain a technique for integration in a Calculus class may be helpful in learning Ampere’s Law in a college Physics class)
By splitting a course into concepts and allowing a given concept to have multiple resources, we can now present students with the choice of educational media that they already have by virtue of the internet, but in a more structured way that can benefit from peer feedback regarding the effectiveness of a given educational resource in helping a student independently learn and understand a concept (much like the way that students ask other students whether a chapter of the textbook, a website, or a lecture video was ‘helpful’).
There are three core components to the system, outlined in Figure 3-1:
• A client application that is used to view a variety of different educational media (i.e. lecture slides, course notes, assignments, videos, etc.)
• A server that provides the client devices with an up-to-date list of concepts and educational resources and retrieves information regarding student usage of educational resources
• A web-based application that is used by instructors to enter both concepts and resources into the system.
The following sections describe in detail each of these subsystems as well as the data model they use and protocol by which they communicate information regarding meta-data around concepts and resources as well as usage data from the client devices.
3.2
Data Model
As described earlier, the system created in thesis models courses not as a series of lectures, but rather as a set of concepts to be mastered, and it takes into account that the process of learning a given concept includes viewing more than one resource in a variety of media, and some resources may be more or less relevant as interpreted by the users of the system, who are modeled as peers in the same classroom learning environment. Figure 3-2 illustrates the domain model for my system, which provides a visual illustration of how objects are modeled in data.
Figure 3-1: System Overview
Since the system in its current implementation focuses on a single course, an OCW course is stored merely as a String. A Concept is described by a name (stored as a String), course information (stored as a String), and a unique ID (stored as an integer). A Resource is described by a name (stored as a String), a type (stored as a String), a URL (stored as a string), a start time (usually a zero integer or if the resource is a movie, an integer representing the number of seconds of video after which to start playing), and a unique ID (stored as an integer). In order to facilitate a many-to-many relationship between concepts and resources, instead of directly relating concepts to resources, I instead use an additional data object known as a Concept-Resource Relation. This object represents the relationship between one concept and one resource and stores a concept ID (stored as an integer), a resource ID (stored as a integer), a view count (stored as an integer) and a like count (stored as an integer). View count and like count for these relations are originally set to zero, and they are updated with each user session, as explained in the Client-Server Protocol section of this chapter. This data come from the last type of object, a User Session, which represents one studying experience between one user and one resource in the context of learning one concept. The User Session stores a start time and end time (as integers representing seconds since the Epoch, or January 1st, 1970, a common time unit), a user ID (stored as a String), a concept ID (stored as an integer), a resource ID (stored as an integer), and a boolean indicating whether the user pressed the ”like” button when viewing the resource. The following section shows how this model of metadata can be used to create adaptive user interface elements based on both active and passive feedback regarding relevance and helpfulness of a resource in learning a given concept.
3.3
Client Application
The client application is designed as an interface with which students can view con-cepts, search for a concept of interest, view the available resources for that concept, and then view individual resources. The client application is also responsible for
tracking usage data and reporting this to the server.
When the user opens the application, he or she is presented with a list of concepts that each have a list of relevant course information (in the case of this application, I chose to include the MIT course number of each concept as its course information). At the top of the screen is a search bar with auto-complete functionality that does a full-text search of the names of all the concepts and can be used to filter concepts by name.
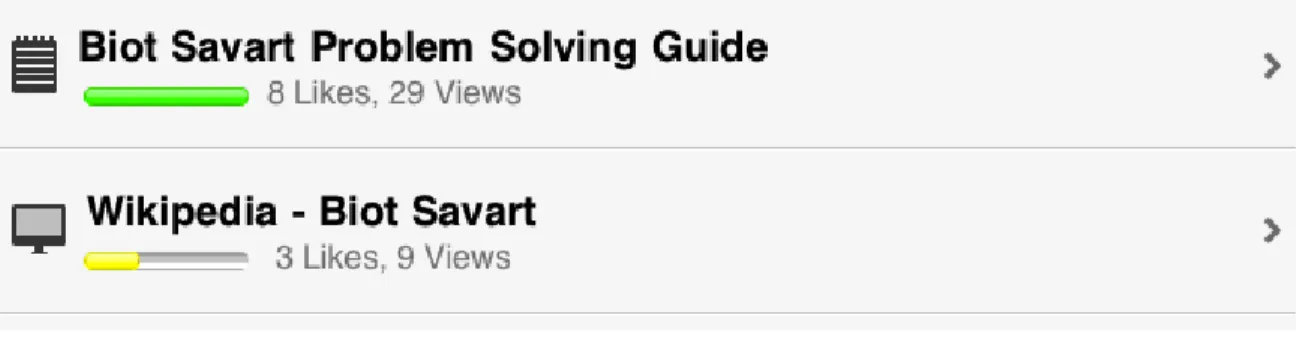
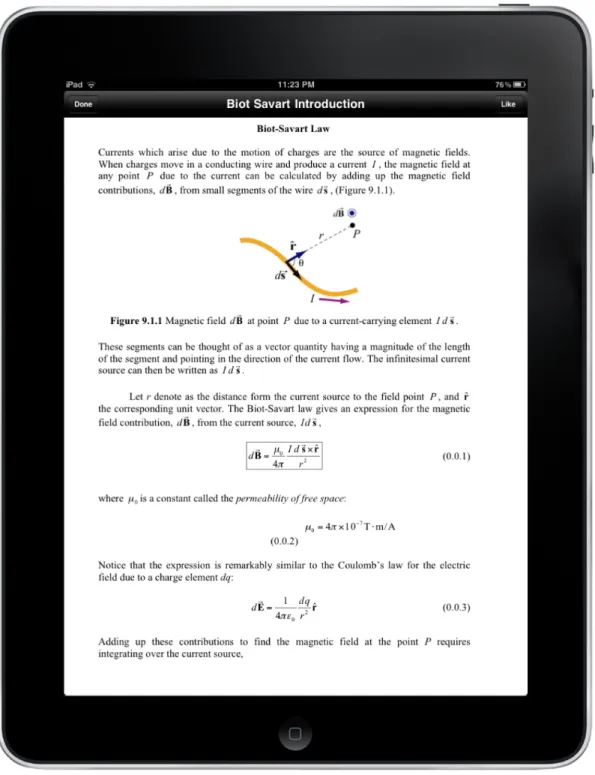
The student can select a concept by simply pressing the concept’s name. When a concept is selected, a new view appears that lists all of the resources that have been associated with this concept. Resources for a given concept are listed in a table view, where each cell represents an available resource, shown in Figure 3-3. On the left side of the cell, an icon indicates the resource type, where a notepad indicates lecture notes, a computer indicates a web resource, a slide projection indicates a set of slides, a pencil and paper indicate an assignment, and a film strip indicates a movie. In addition to listing the name, each resource cell also lists the number of ‘views’ and ‘likes’ for a given resource, where a view is defined as a user session that lasts longer than a predefined threshold length (in the case of this thesis project, I chose 20 sec-onds as a minimum viewing time to limit noise due to accidental or fleeting viewings of resources). A ”like” is a user session in which users click the ”like” button for a resource, indicating actively that the resource was especially helpful.
Each resource cell also has a ‘relevance bar’ that provides a single metric for the ‘relevance’ of a resource to a concept. While there are many ways in which this score could be calculated, I chose to use a linear weighted sum of the view count and the like count for each resource, where the score sr,c of resource r in the context of learning
Figure 3-3: Resource Cells in Client Interface
these students clicked the ”like” button, is given by: sr,c = α ∗ vr,c + β ∗ lr,c
The constants α and β in this model should be chosen such that β > α, to indicate a higher influence of active positive student feedback from pressing the ‘like’ button than influence from sheer number of views. In the user test used in this thesis project, I chose to use α = 1 and β = 3. After the score is calculated for each resource in the context of learning a given concept, the scores are then normalized across all the re-sources for a given concept. This normalized score is shown visually using the colored bar element in each resource cell. Both the amount of the filled in bar and the color of the bar indicate the normalized relevance score (a normalized relevance score of greater than 0.8 has a green bar, 0.2 to 0.8 has a yellow bar, and less than 0.2 has a red bar). The list of resources is then sorted by normalized relevance score, with the resources with the highest normalized score on top. The colored bar, like count, view count, and list order are considered the ‘adaptive’ components of the interface, and they are constantly updated by the server side of the system as per the client-server protocol, defined later in this section.
The resource view consists of a small toolbar on the top of the screen with a ‘Done’ button that allows the user to indicate that he or she is done viewing the resource, and a ‘like’ button that appears only after 20 seconds, to indicate that the user actively likes the resource. The delayed onset of the ‘like’ button is a design decision to
mini-mize the ability for students to repeatedly ‘like’ a resource quickly during testing. A more robust system that takes into account user login could perhaps keep a mapping of user accounts to concept-resource pairs to prevent students from ‘liking’ a given re-source more than once when studying a given concept. The rest of the rere-source view is dedicated to the resource itself, using the iOS framework’s built-in UIWebView class, which renders both PDF and web resources, and the iOS framework’s MPMoviePlay-erController class, which renders MPEG4 movies. One important observation from this implementation was that while my application is designed to support starting a movie from any desired start point (i.e. multiple video resources can point to different start times in the same video file), I found that I still had to use small video clips that started at t = 0 seconds, since the iOS movie player class appeared to buffer all the frames prior to the desired start time, so start times late in a file would result in an unacceptable loading latency. I later discovered that this may have been caused by the fact that videos on the hosting location (for this project, MIT’s Athena File System) may not have been configured for the Quicktime “fast-start” mode. Future work with this system should definitely make sure to enable this option to allow my model of video resources to be fully functional.
3.4
Client-Server Interaction
3.4.1
Server Architecture
The server-side of this system consists of a SQL database that stores the appropriate information regarding concepts, resources, the relationships between concepts and resources, and each individual view of a resource when studying a given concept on a specific client device. The concepts table stores the name of the concept as well as its “class information”, or a string of any information pertaining to the concept itself, and a unique concept ID. The resources table stores the name of the resource, its type (represented by a string representing either assignment, lecture notes, slides, movie, or web), a start time (used only with video resources), a string that stores the
resource’s URL, and a unique resource ID. To define relationships between concepts and resources, there is also a table that stores a conceptID, resourceID, view count, and like count for each relationship between concept and resource. To record student usage of the application, there is also a table that stores user sessions, which consist of a start time, an end time, a concept ID, a resource ID, and a user ID. This architecture allows a many-to-many relationship between concepts and resources, so a resource can be listed for more than one concept and a concept can list more than one concept. The following section describes in detail the protocol of communication between client devices and the server via a series of scripts, all written in PHP, and Appendix C contains a set of tables explaining in detail the server-side SQL schema used in this thesis.
3.4.2
Client-Server Protocol
The core principle driving the design of the client-server interaction in this system is scalability in number of simultaneous users, number of concepts and resources, and total size of usage data. With a small number of concepts and resources, it is almost always the case that the size of the metadata being shuttled from server to client regarding the list of available concepts and resources will be very small relative to the size of an individual resource itself. However, as the number of concepts grows, the size of the metadata regarding the full list of available concepts will be significant compared to the size of an individual resource. While one could create a system that simply loads this data once, that system would soon become out of date as teachers add and remove concepts from the list.
This presents a tradeoff in having accurate, up-to-date data versus increasing net-work traffic on the client device (and dealing with associated latencies in the user interface) and more importantly dealing with a significant increase in traffic to the single server. To deal with this tradeoff, I made the assumption that the number of resources for a given concept will change frequently but will not explode to a very large number. Given this assumption and the fact that it is very important that
students view up-to-date information regarding the number of ‘views’ and ‘likes’ for resources related to the concept they are learning, I chose to have each client device contact the server each time it loads the set of resources for a given concept, within any window of 2 minutes (i.e., if a user selects a concept from the concept browsing view and then returns and selects the same concept within 2 minutes, the view will not contact the server for a new list). Since the list of concepts is likely not to change significantly within a short period of time, I configured the client application to only load a new list of concepts if its current list is more than 24 hours old. These delays are stored as constants in the code of the client application and can be modified over time based on the demands of the users and size of the repository of educational resources.
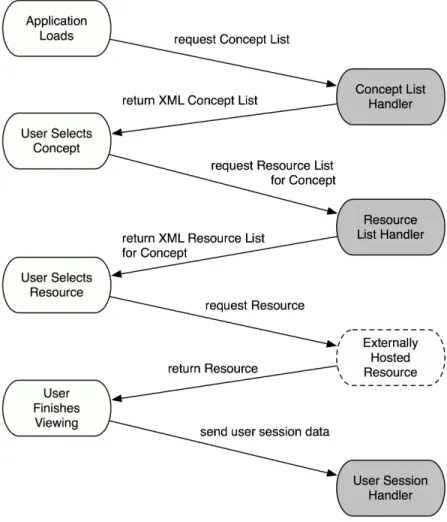
Figure 3-4 shows the full client-server interaction, where gray boxes represent user ac-tions on the client device, white boxes represent server-side request handlers, and the dashed box represents an external hosting location that handles a traditional HTTP GET request. All calls sent from client to server pass data as URL parameters which are read by the PHP server scripts as HTTP GET environment variables. All re-sponses sent from the server to the client are in the form of XML, which are read by a custom-designed XML parser within the client application. The XML parser is designed in a very modular way, allowing for an add, remove, or update operation on both concepts and resources, and storing relationships between concepts and re-sources in the data model (on the client, rere-sources simply ‘belong’ to concepts and when a resource is used by multiple concepts, it is simply stored as a redundant object in memory, which adds a trivial amount of memory usage).
When the application loads, if the concept list is out of date, it sends a request to the server asking for a full list of all the concepts stored in the system. This is returned in XML and added to the internal model data, and it allows the application to show the user a list of all of the available concepts. The user then at some point
selects a concept. If the user has not selected the same concept within the last 2 minutes, the system contacts the server for an updated list of resources associated with that concept, along with any metadata associated with those resources (i.e. like counts, view counts, and a normalized relevance score). One notable scalability issue is that in a system with n users, rcresources for a given concept c, the number of SQL
queries required for this “resources for concept” operation is O(n ∗ rc), which becomes
unmanageable with a very large user population. One idea for future optimization that is not implemented here but can easily be added is a script that periodically updates the resource information (say, every 2 minutes) by creating a constant XML string that can be accessed in a single query from each client, reducing the runtime of this operation to O(n).
Once the list of resources is received by the client system, the client can create the adaptive interface components and display the list of resources, ordered by relevance score. At some point, the user selects a given resource. This opens the resource view, performs an HTTP GET or movie load operation using the URL stored for the resource. The client also creates a User Session object and logs the start time of the resource view. When the user clicks the ‘Done’ button, the view controller logs the end time of the view and passes the User Session object to a session uploader object that uploads the user session using an HTTP GET request to the user session handler of the server. One scalability issue that one encounters with client-server communication is the process of updating the relevance scores of a set of resources associated with a given concept. In an early iteration of my system, I interpreted this task literally and created a server script that iterated through all the user sessions, adding the appropriate information regarding view counts to a hash that could then be used to quickly create relevance scores. However, with s user sessions, rc resources
associated with a given concept, and c concepts, this operation would have a runtime of O(s ∗ c ∗ rc) to create the hash and O(c ∗ rc) to create the scores. Since s is
signifi-cantly larger (over time, several orders of magnitude) than rc and c, this would result
linear combination of view count and like count, and relevance scores are not so much for resources but for concept-resource relations, which are stored in their own SQL table, I added the component of this updating operation that involves creating a hash of like and view counts to the user session script. When a user session is uploaded, its handler script stores the raw data of the user session (for evaluation or further use later), verifies that the start and end time indicate a view (difference between start and end greater than 20 seconds), checks whether the like button was pressed, and then updates the appropriate row of the concept-resource relation table, which stores a like count and a view count for each relation. This drastically reduces the runtime of the metadata updating operation, since the number of SQL queries no longer scales with the number of user sessions, which can be allowed to grow very large as they provide rich data about user interaction but do not limit the speed of client server interaction and ultimately user experience.
3.5
Teacher Interface
In this thesis project, I have provided a simple teacher user interface using HTML and PHP. There are three core interface pages: a page to add concepts, a page to add resources, and a page to add relations between concepts and resources. All of these pages consist of web forms that conform to the model descriptions defined in the “Model” section of this chapter. While this interface is very rudimentary as my thesis project focuses primarily on a user interface that changes for students using client iPad devices, there is much that can be done to provide feedback to teachers regarding the combined interest and usage of resources to learn concepts in a given class. For example, a teacher could be presented with a dashboard showing which resources are most and least viewed as well as get feedback on the reading progress or habits of individual students to better understand the students’ learning patterns. However, it is not encouraged for teachers to use this system as a means to grade students on participation or completion of reading, as the current measures of reading time can be easily forged by students who are incentivized to create fake usage data
for a grade, and this would also detract from the usefulness of the usage data in helping evaluate and improve learning resources, which is one of its primary goals.
Chapter 4
User Study
4.1
Study Goals and Research Question
A significant part of my thesis research was the design and execution of a controlled user study to understand the effects of the adaptive elements of my user interface. While there are a variety of contexts in which students may be exploring a set of open educational resources (i.e. studying concepts already covered in class in preparation for an exam), in this user test I focus on the learning scenario where a teacher has not yet covered a concept in class, but in preparation for the class asks the students to individually attempt to learn the concept. In a typical classroom scenario today, a professor would simply assign as homework a chapter or section of a book to read. However, today’s students have access to a variety of resources, both from curated sources like OpenCourseWare as well as from peer-managed resources like Wikipedia.
In my research, I seek to understand if adaptive user interface features introduced in the context of a studying medium (specifically, the ability to actively ‘like’ an ed-ucational resource and the ability for that medium to constantly update the way it presents resources to students based on these peer-driven ratings) can provide a signif-icant practical improvement in the learning experience of students over the existing open educational resource lists that are available to students either on an Open-CourseWare website, a professor’s website, or a course management system such as
MIT’s Stellar Course Management System.
Since assessing a ‘significant practical improvement’ is a subjective matter and diffi-cult to do in a controlled study, I instead used a combination of survey responses and answers to a concept quiz, all completed within a controlled studying environment, to attempt to answer this question using a series of statistical significance tests. My results hinge on the following assumptions:
• A learning experience is significantly improved if students report a significantly higher level of confidence in articulating the concept they have just studied • A learning experience is significantly improved if students are able to perform
significantly better at a task of applying those concepts to new situations in a problem solving exercise
• A learning experience is significantly improved if students report a significantly easier ability to access educational resources that lead to individual learning (i.e. the most helpful resource)
With these assumptions in mind, I created a user study that simulates an environment in which the professor asks the students to independently explore two concepts in Electromagnetism: the Biot-Savart Law and Ampere’s law, which relate to magnetic fields and their relationship with moving electrical charges, before they cover the concepts in the classroom.
4.2
Participants
Undergraduate students taking MIT’s introductory Electricity and Magnetism course (also referred to as 8.02) were given the chance to participate in this study, which occurred over their spring break, immediately before the two test concepts were to be covered in class (i.e. the students had not seen any materials regarding these two concepts prior to the test). Students were contacted via email list and signed up for the study using an online form, which was later deleted to preserve anonymity.
Participants were given a random Subject ID number at the start of the test, so no testing materials could be linked to individual students or included in their grades for the class. This test received approval from MIT’s independent review board (See Appendix A for documentation of this approval).
4.3
Procedure
After signing a consent form, participants were asked to first complete a short 5-10 minute quiz that involved two concept questions, one on the Biot-Savart law and one on Ampere’s law. Students were informed that this was a quiz on content they should not already know and that writing that they “do not know” is acceptable if applicable. This was designed to act as a control to eliminate data from students who had already taken a course in electromagnetism and were familiar with the materials presented in the concept quiz later in the user test. However, of all the participants, only two answered the questions correctly, but they did not provide enough justifica-tion for their answers to indicate that they were already familiar with the concepts covered in the study.
After the pre-test quiz was completed, students were given an iPad, briefed on how the app works and given up to 2 hours to read and take notes on the Biot-Savart law and Ampere’s law in preparation for an open-note quiz. After the students were done reading, their reading time was recorded and they were given a more in-depth quiz with new problems that were not present in the pre-test quiz or in any of the educa-tional materials. The students were free to use the notes and take up to 30 minutes to complete the quiz. After completing the quiz, students were asked to complete two surveys: one regarding background information about their use of the iPad and of open educational resources, and one that is specific to their experience in this study.
Subsequent sections explain in detail the control and experimental conditions as well as quantitative and qualitative measurements taken.
4.4
Conditions
There were two groups in this experiment, a control group and an experimental group. Students were not informed which group they were in until the end of the study, when they were debriefed. The independent variable used to differentiate the groups was the presence of adaptive user interface elements, which consisted of the following:
• A subroutine called every 2 minutes that updates the list of resources for a given concept to be sorted in descending order of relevance score (a linear combination of both views and presses of a “like” button by other students who previously viewed the resource)
• A bar that indicates the relevance score of each of the resources in the list of resources for a given concept and also changes color based on the relevance score, where scores below 0.2 are red, scores between 0.2 and 0.8 are yellow, and scores greater than 0.8 are green (Note: since relevance scores are normalized, they by definition fall between 0 and 1)
• A line of text that shows the number of views (where a view is defined as a viewing of a resource in the context of learning a given concept that lasts longer than a threshold time - in this case 20 seconds) and the number of presses of a “like” button
The experimental condition of the experiment included all of these features, and the control condition omitted all of the features, though instead of sorting the resources in one initial order (which could potentially bias the student to only choose the resource that appeared at the top of the list), I used as a control condition a subroutine that refreshed the set of resources every 2 minutes and sorted the list of resources in a random order. A couple of students reported that this was slightly frustrating, but all students were debriefed and understood that experimental design decision when it was explained after the study was completed.
4.5
Measurements
To compare the performance of the experimental system with the performance of the control system, I used a combination of both quantitative metrics and qualitative metrics that are quantified by using a numeric rating scale. The core performance metrics are as follows:
• Students’ self-reported confidence in articulating the Biot-Savart Law after the studying period and concept quiz
• Students’ self-reported confidence in articulating Ampere’s Law after the study-ing period and concept quiz
• Students’ opinion of the ease of use of the interface in finding educational re-sources that were particularly helpful given a choice of rere-sources
• Students’ score on a standardized concept quiz covering both the Biot-Savart Law and Ampere’s Law, using a rubric that awards points for both the right answer and showing proper work / justification to indicate understanding and ability to apply the concepts
4.5.1
Survey Responses
Students’ self-reported confidence in articulating the concepts were reported by the students on a 1-5 scale, where each rating had an associated description to calibrate students’ responses across a group. The null hypothesis for this metric would be that the control and experimental groups would show no statistically significant difference in rating using this 5 point scale and averaged across all students in each group. Table 4-1 shows the set of ratings as well as their associated descriptions.
Students’ opinions of ease of use of the system was also rated on a scale from 1 to 5, relative to the course website (shown in Table 4-2). I used the course website because it represents a control condition of simply listing educational resources and is also an interface that the 8.02 students would surely be familiar with enough to draw
description rating I am sure that I do not understand the concept and cannot articulate it 1 I am not very confident in my understanding of the concept 2 I am somewhat confident in my understanding of the concept but I am unsure about my ability to properly articulate it
3 I am confident in my understanding of the concept, but I am unsure about my ability to properly articulate it
4 I am very confident in my understanding of the concept and I could definitely articulate it
5
Table 4.1: Rating Scale for Confidence in Ability to Articulate Concepts a comparison with the user interfaces used in the study. Again, the null hypothesis for this metric would be that the control and experimental groups would show no statistically significant difference in rating using this 5 point scale and averaged across all students in each group.
description rating
Much worse than using the course website it 1 Somewhat worse than using the course website 2 No noticeable difference vs. the course website 3 Somewhat better than using the course website 4 Much better than using the course website 5
Table 4.2: Rating Scale for Ease of Finding Most Helpful Information
4.5.2
Standardized Test
The last quantitative metric of performance of the user interface was a standardized test designed to measure whether students in the experimental condition performed significantly better than students in the control group at applying the newly learned concepts in the context of a new situation. There were two free-response questions on the quiz, each with multiple parts and each focused on either the Biot-Savart law or Ampere’s law. The quiz was scored out of a total of 17 points, though the recorded data is given as a percentage (with a maximum score of 100).
Using a standardized test given to students when trying to measure the performance of the user interface of the studying medium is vulnerable to many confounding vari-ables that can result from students’ individual studying abilities. I attempted to control for these conditions as much as possible in this study. First, I made the test open-note and informed all participants that they may take notes during the read-ing period and use those notes durread-ing the concept quiz. This is designed to control for students’ individual abilities to memorize equations and principles covered in the educational resources. Second, I made all of the quiz questions free response rather than multiple choice, to minimize the chance that students would answer correctly due to guessing rather than actual ability to effectively utilize the concepts to solve the problem. Last, I created a standardized rubric that awarded points both for the correct answer and a proper justification for each part of the quiz, with added weight allocated to the justification component of each problem to emphasize articulation of the concept and its utilization in addition to simply being “correct”. The null hypothesis for this metric is that the control and experimental groups would show no statistically significant difference in score on the quiz using the standardized grading rubric and averaged across all students in each group.
4.6
Further Observations
In addition to the performance metrics, I can also make some qualitative measure-ments regarding the way in which the adaptive user interface features, and specifically peer-based feedback of the “relevance” of resources to a given concept can influence the way in which students view a set of resources when attempting to learn a new concept. As mentioned in the System Design section of this thesis, each time a user views a given resource, a User Session is recorded that takes note of the start and end time of each viewing session. By using a threshold duration (where duration is end time minus start time) to denote the minimum viewing duration for a “view”, I can eliminate the noise due to accidental viewings of resources that only last a few seconds.
Given the set of valid views of resources from both groups, I can then examine how the ratings influence two key variables in the viewing patterns of students given the same set of resources and the same set of concepts to master in the same allowed amount of time: the range and standard deviation of view counts for a given set of resources in the context of learning a given concept, where increased range and standard deviation indicate an amplification of interest in resources with higher relevance scores and a dampened interest in resources with a lower relevance score. These observations can then provide insights into how resources and concepts should best be defined to max-imize the usefulness of the system in highlighting the most relevant resources while also minimizing the extent to which resources are ignored due to the amplification or dampening of student interest in resources due to the adaptive interface features.
Chapter 5
Results
5.1
Performance Metrics
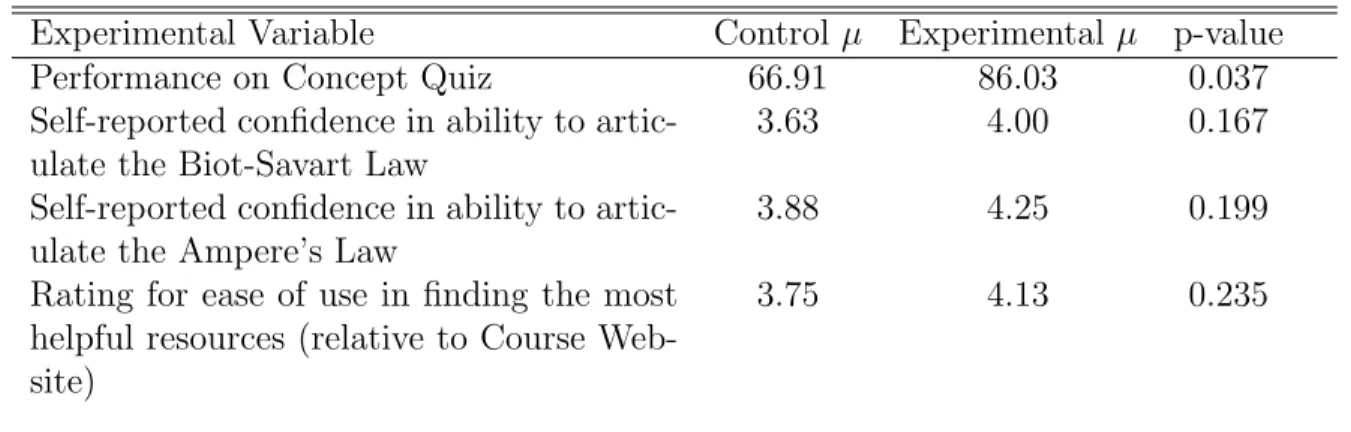
Based on the user test design specified in the previous section, there are four key quantitative performance metrics of the adaptive system: self-reported confidence in ability to articulate the Biot-Savart Law, self-reported confidence in ability to artic-ulate Ampere’s Law, rating of ease of use of the system in finding the most helpful resources for a given concept, and performance on the standardized concept quiz given at the end of each subject’s reading period.
Since there were 8 students in the experimental group and 8 students in the con-trol group, and students were randomly assigned to exactly one group, I performed a test appropriate for a between-subjects study, the unpaired student-T test. I chose to use the 1-tailed t-test, and I made the assumption that the variances in both groups were equal, as both groups were samples of students from the same class and likely shared the same distribution.
Table 5-1 shows the results of running this T-test for the four variables, as well as the associated p-value. Based on the results, there was a statistically significant difference in test performance between students in the control group and students in the experimental group, with a p-value of 0.0374 (for a small group size of n=8, it is
standard to consider p-values less than 0.1 to be statistically significant). However, in all three other metrics - self-reported confidence in ability to articulate the Biot-Savart Law, self-reported confidence in ability to articulate Ampere’s Law, rating of ease of use of the system in finding the most helpful resources for a given concept - the difference in score between the groups was not statistically significant, though the experimental group did score higher in every case. This may have resulted from the fact that responses on a 1-5 scale for questions of self confidence are notoriously centered at 3 or 4 with little deviation. While these results are not ideal, they are definitely a compelling motivator for further research in the area of creating adaptive user interfaces to augment the effectiveness of educational media.
Experimental Variable Control µ Experimental µ p-value Performance on Concept Quiz 66.91 86.03 0.037 Self-reported confidence in ability to
artic-ulate the Biot-Savart Law
3.63 4.00 0.167 Self-reported confidence in ability to
artic-ulate the Ampere’s Law
3.88 4.25 0.199 Rating for ease of use in finding the most
helpful resources (relative to Course Web-site)
3.75 4.13 0.235
Table 5.1: Quantitative Results of Concept Quiz and Surveys
5.2
Usage Patterns
In addition to the observations regarding performance of the adaptive system over a control, I was able to also make a variety of observations regarding the effects of the adaptive user interface features on the way that students view a set of resources in the context of learning a new concept. As described in the User Study chapter, I was able to collect a variety of user sessions for both control and experimental groups.
After filtering out user sessions from irrelevant concepts as well as all user sessions that were less than 20 seconds in duration, I recorded a total of 176 views for the
experimental group and 106 views for the control group. Each of these views has as-sociated with it a concept and a resource, indicating which resource was viewed and which concept was being explored when the user viewed that resource. One should note that the choice of a minimum viewing duration of 20 seconds was an empirical one and data from this study should be used to choose an optimized ‘minimum valid viewing time’ for future user studies. In the case of this study, there were 66 user sessions rejected from the experimental group, averaging 15.15 seconds in duration, and there were 29 sessions excluded from the control group, averaging 9.03 seconds in duration.
Given a set of views V , I first create a dictionary mapping each concept c in the set of all concepts C to a set of views in the context of learning c, denoted by Vc.
I can then repeat this filtering process to find all views Vr,c that correspond to a
given resource r in the set of all resources R in the context of learning c. From this information I can obtain and plot for a given concept c a distribution of Vr,c for each
r that is related to concept c.
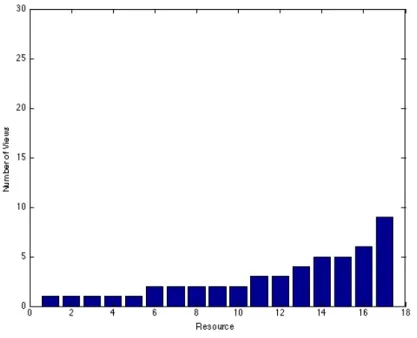
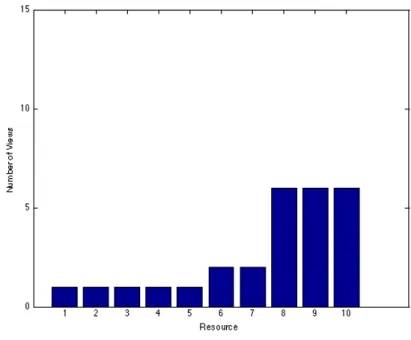
As hypothesized in the User Study chapter, I observed that there was a distinct difference between the two groups in the range of the number of views for each re-source in the context of learning a given concept. Figures 5-1 and 5-2 show a bar plot of the view counts for each resource in the set of resources that are related to the Biot-Savart Law, sorted from least viewed resource to most viewed resource. The plots are shown with the same scale of y-axis (view count) to highlight the differences between the view distribution in each group.
In the case of the control group, when studying the Biot-Savart Law, the set of 17 resources had a range of 8 associated views and a standard deviation of 2.221 views. In the case of the experimental group, when studying the Biot-Savart Law, the set of 17 resources had a range of 28 associated views and a standard deviation of 6.257
Figure 5-1: View Distribution in Control Group studying Biot-Savart Law
Figure 5-3: View Distribution in Control Group studying Ampere’s Law
views. From this data, we can qualitatively observe that there is in fact an amplifica-tion in interest in resources that have a high relevance score. Looking at Figures 2-1 and 2-2, it is clear that when studying the Biot-Savart Law using an interface with adaptive elements, the most popular resource made up a significant proportion of the views, and there were many resources with significantly less views. When studying the Biot-Savart law without these adaptive elements, students viewed no resource more than 9 times, and there was no observed amplification in interest in the most viewed item.
It is also worth noting that the most observed resource for the experimental group when studying the Biot-Savart law was the only resource that seemed to be influenced significantly by the interest amplification effect discussed earlier. While it is unclear why this occurred, one possible cause could be that many students used the adaptive elements to begin their browsing of the resources and then proceeded to methodically view a subset of those resources. Another key observation from these plots is that the total number of views of resources related to the Biot-Savart law in the experimental group was significantly higher than the total number of views of resources for the same concept in the control group (116 views in the experimental group, and only 50 in the control group). Since each group had 8 students and there were 17 resources for this concept, if every student viewed every resource, there would be a total of 136 views for this set of resources, so in both groups, there were students who did not view all of the resources, but students viewing resources with the adaptive user interface features viewed a significantly larger portion of those resources.
All of the aforementioned observations could also be made of the students when observing the resources related to Ampere’s law. These view distributions are shown in Figures 5-3 and 5-4. In the case of the control group, the set of 10 resources had a range of 5 associated views and a standard deviation of 2.312 views, whereas in the experimental group, I observed a range of 10 in views and a standard deviation of 4.522 views. This data indicate that the interest amplification effect seems to be
present across multiple concepts.
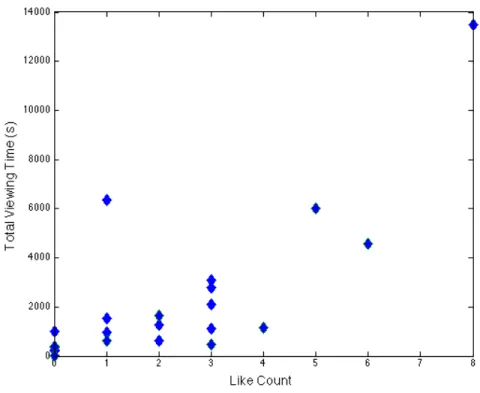
I also used my user session data to try to understand better the relationship be-tween active user feedback (via a “like”) button and the collective group’s interest in a resource in the context of a given concept, which I measure by total time across the whole user group spent viewing the resource. Figure 5-5 shows the results of plotting such a relationship, where each point corresponds to a concept-resource combination, with points aggregated for both the Biot-Savart and Ampere’s law in a single plot (I first plotted them separately, but they had very similar distributions). The x-axis denotes the aggregated number of presses of the “like” button and the y-axis displays in seconds the total viewing time. To make this plot, I did eliminate one outlier data point that had 4 likes and a view time of 497,273 seconds, which was 2 orders of mag-nitude greater than the other points. With this point eliminated, there appears to be a positive trend, but this trend does not appear to have a specific function associated with it. This is in some ways to be expected, since the metric for “relevance” of a resource to a concept is in large part a function of the aggregated number of “likes”, and based on this data, it appears that the number of “likes” as well as the adaptive interface did indeed result in more viewing of a resource.
While these observations point to notable trends in the way that adaptive user in-terface elements influence the way that students view their educational medium, it is important to note that these observations are qualitative in nature and do not make a claim of statistical significance. To make such a claim, one would have to design a controlled study to control for the many confounding variables that influence viewing behavior. For example, while this study was a between-subjects study, a study that focuses on answering the specific question of how view distribution is influenced by adaptive interface elements could use the same experimental setup as my study but present the same set of students with two different user interfaces. My results in this respect are purely qualitative but are nonetheless included in this thesis, as they may be considered compelling evidence to motivate further study of these behaviors.
Chapter 6
Conclusions and Contributions
6.1
Conclusions
The results discovered in this user test point to a variety of conclusions regarding the influence of adaptive user interface features in a medium of open educational resources. The statistically significant increase in standardized test performance of students using an educational medium with adaptive user interface features implies that there may in fact be an underlying value of these features to the learning experi-ence. While a significance test did show positive results, there are a variety of factors that could have influenced the outcome of the experiment, most importantly of all the number of participants and duration of the study period. Ultimately, these posi-tive results should serve as a motivation to conduct studies of adapposi-tive user interface features on a larger group of students (where group sizes exceed at least 30 students) over a longer period of time (ideally an entire semester or year). While the results regarding student self-reported confidence in articulating concepts were not statis-tically significant, the experimental group did have a stronger rating in both areas, which is also motivation for further and more comprehensive user studies. Ultimately, these results represent a positive initial test of this architecture for an adaptive user interface, and there is definitely a significant enough improvement in the learning experience based on a variety of parameters to warrant further investigation.
In addition to discovering measurable data on the effectiveness of an adaptive user interface based on peer feedback, I was also able to analyze qualitatively the way in which the adaptive user interface features changed the way that students viewed a given set of resources. The idea that peer ratings of resources will “amplify” student interest in the most viewed resources and “dampen” student interest in the least viewed resources was evident in the distribution of views across the experimental groups in both test concepts. This not only acts as a motivation for further research in this area, but it also suggests some basic design principles for defining concepts and the appropriate resources when populating an architecture such as the one used in this thesis. Since peer feedback results in students ignoring some of the lower-rated resources, it would be wise for educators to ensure that concepts and resources are de-fined such that resources for a given concept are redundant (i.e. resources encompass multiple ways of describing the same concept, and it is not imperative that students read all resources for a given concept). This was not the case in this study, and as a result, some resources that were intended to be viewed by students were not viewed, regardless of the experimental group. As with the quantitative data, understanding these behaviors and consequently being able to provide concrete content design guide-lines would require a more extensive study with more students over a longer testing period.
To summarize, I feel that there are a variety of concrete implications for the de-sign of open educational resource repositories and their user interfaces that can be taken away from this thesis project:
• Students today use more than one resource when attempting to master a given concept, and open educational media should take that into account by providing students with a selection of learning mechanisms
• Educational resources should be constantly graded and improved just as much as the students who learn from them, and usage data can be a driving force in this improvement