AR Model of The Torque Signal For Mechanical
Induction Motor Faults Detection and Diagnosis
S. Haroun, A. Nait Seghir, S. Hamdani Laboratory of Electrical and Industrial Systems (LSEI)
Department of Electrical Engineering, U.S.T.H.B El Alia, BP. 32, Bab Ezzouar, 16111, Algiers, Algeria
haroun.smail@yahoo.com; naitseghir_a@yahoo.fr; ham_samir@yahoo.fr
S. Touati
Electrical Engineering Department (DGE) Nuclear Research Center of Birine (CRNB)
Bp 180, Ain Oussera, Algeria saidtouati@yahoo.fr
Abstract— Mechanical faults present a large portion of
induction motor failures, if left undetected, it can lead to partial or total breakdown of the machine. This paper propose a scheme to detect and diagnose mechanical faults in an induction motor by the AR model coefficients of the Torque signal. First, the torque signal obtained from experiment in different conditions: healthy condition, motor with dynamic eccentricity fault, and motor with misalignment fault are normalized to exclude the load effect. Then the AR model coefficients are extracted as features to reduce the dimension data while keeping the effective information. Finally, the Self Organizing Map neural network is used for classification of the different conditions. The experimental results show the effectiveness of the proposed method, were both eccentricity and misalignment faults might be easily detected and discriminated from each other.
Keywords—Mechanical Torque; AR model; excentricity; misalignement; Self Organizing Map; fault detection and diagnosis
I. INTRODUCTION
Electrical rotating machines are vital components of various industrial applications. Although, these electromechanical devices are highly robust and reliable, they are susceptible to many types of faults in severe working environments or undesired stress. Such faults can became catastrophic and cause production shutdowns, personal injuries, and waste of raw material. Among these faults, mechanical faults like eccentricity and misalignment are very common cases. Eccentricity fault is defined as an unequal air gap between stator and rotor. It can be static, dynamic or a mixture of both forms which called mixed eccentricity [1]. The consequences of the eccentricity fault can be austere; it can lead to a breakdown of the machine due to rotor-to-stator rub [2]. Coupling misalignment is a condition where the shafts of the driver machine and driven machine are not on the same center line. Misalignment may be either due to two categories namely: parallel, and angular or presence of a combination of both [3]. Possible causes of misalignment include improper installation, wearing of the machine components and damage of the installed bases due to vibration from machines [4].
High levels of misalignment may lead to fatigue cracks or
rotor to stator rubbing [5]. Therefore, mechanical faults detection and diagnosis is quite necessary for successful operation, avoid catastrophic malfunction and increase availability in the industrial systems. A review of the literature shows that the detection of mechanical fault in induction motors has received extensive attention.
Most of the proposed techniques uses the vibration analysis [6]. However, distinguishing misalignment is a challenging task using vibration signals alone [7]. In view of the limitations of vibrations signals, many recent studies uses different signals such as stator current [8], acoustic emission [9], thermal [10], magnetic flux [1], apparent power [11] and electromagnetic or mechanical torque [7][12]. This last one is most suitable for mechanical and load faults detection since it contain the primary effects of such faults.
This paper aims at developing a mechanical fault detection and diagnosis methodology based on measured torque signal and the AR Model coefficients. For the classification process, the Self-Organizing Map (SOM) neural network was chosen as it has been applied successfully in many fault diagnosis applications.
The remainder of this paper is organized as follows: In section 2 we present the theoretical back ground of the AR model technique and the SOM neural network. The global fault detection system is presented in section 3. Section 4 presents the experimental implementation and results. Conclusions and future works are shown in section 5.
II. THEORETICAL BACKGROUND
A. Autoregressive model
Autoregressive model is a widely used parametric modeling technique with applications in speech processing, mechanical system modeling, system identification, and fault diagnosis [13]. Parametric methods are available for modeling mechanical systems [14]. Theoretically, a deterministic random process can be predicted based on infinite past observations [15].
1 [n] [k] [n k] k x ∞ α x = = −
¦
− (1)where x[n] is time-series data point, and Į[k] represents the autoregressive coefficients. Parameters n and k represent the time index and dummy number, respectively. Eq. (1) can be approximated by its finite (p) preceding values, expressed by a linear regression on the time series points plus an error term [13]: 1 [n] [k] [n k] e[n] p k x α x = = −
¦
− + (2)where p is the model order, e[n] is the error term, which is a Gaussian white noise series with zero means and the variance ı2. The AR coefficients can be estimated by different
approaches, such as the least square method or Yule–Walker equations. In this paper, the Yule–Walker method has been used for its enhanced computational efficiency [14]. An important challenge in AR modeling is to select the model order. Three popular model order selection criteria are: Akaike Information Criterion (AIC) [16], Final Prediction Error (FPE), and Minimum Description Length (MDL) [17], which are shown below:
2 ( ) log d AIC d V N = + (3) 1 ( ) 1 d N FPE d V d N § + · = ¨ − ¸ © ¹ (4) ln ( ) 1 d N MDL d V N § · = ¨ + ¸ © ¹ (5)
In the above equations, V is the loss function, d is the order of the AR model, and N is the number of observations for fitting the model. According to these three criteria, the most accurate model has the smallest criterion value. It is known that the AIC criterion suffers from over fitting, and FPE and MDL yield better order selection performance.
Using features related to AR models in fault detection, two scenarios of have been reported in the literature. The first one is to use residue signal derived from the AR coefficient of normal condition [18], whereas the second is to use the AR coefficients as features [19]. In this study, we opt for the use of the coefficients of AR model as features.
B. Kohonen Self-Organizing Map
The Self-Organizing Map (also known as Kohonen map) is an unsupervised artificial neural network which is a powerful method for clustering and visualization of high dimensional data [20]. The SOM algorithm implements a nonlinear topology preserving mapping from a high dimensional input data space onto structural units called neurons.
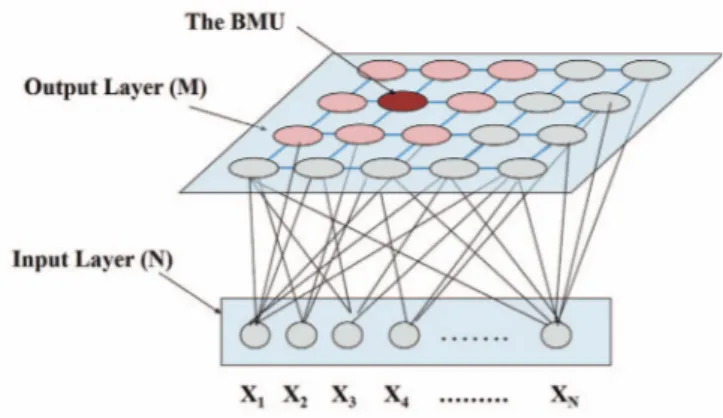
A SOM model is composed by two layers of neurons.
The first one, called input layer (composed by N neurons, one for each input variable), is responsible for receiving and transmitting information from outside to the output layer. The output layer (formed by M neurons) is in charge of information processing and the construction of map features. Usually, neurons in the output layer are organized in two dimensional map [21], as shown in Fig. 1. Note that each neuron of the network is defined by its location on the map grid and completely connected to all the nodes of the input layer through an n dimensional reference vector (prototype vector).
The SOM algorithm is a form of unsupervised learning. The network is initialized by sampling random values for the preliminary reference vectors from a uniform distribution having limits defined by the input data. Another option is to use linear initialization, which is faster and less computationally arduous than the classic random initialization [20]. During training the input vectors are mapped one by one to particular neurons, called the best matching units (BMU) on
the basis of the smallest n dimensional distance (Euclidean distance) between the input vector and the reference vectors. Next, the nearest neighbors of an activated neuron are likewise activated according to a neighborhood function (e.g. Gaussian distribution) dependent on the network topology. Finally, the reference vectors of all activated neurons are updated, and the next input vector is processed in the same manner. In summary, the training of a SOM consists of the following stages:
1. Initialize the map.
2. present an input vector to the SOM;
3. Find the BMU for the input vector by means of the Euclidean distance.
4. Move the prototype vector of the BMU and those of the neighboring neurons towards the input vector.
5. Repeat from steps.
III. PROPOSED FAULT DETECTION STRATEGY
In this work, the analysis of the torque signal is used for eccentricity and misalignment faults detection in induction motor. The adopted procedure of diagnosis system uses the AR model coefficients of measured torque as features after being normalized to reduce the load effect. The classification system is based on the Kohonen Self organizing map neural network. The developed algorithm is depicted by the flowchart in Fig.2.
IV. EXPERIMENTAL SETUP A. Test rig and measurement
In order to validate the proposed fault diagnosis technique, a collected data from an experimental set up located at LAPLACE laboratory of ENSEEIHT in Toulouse are used.
It consists of a 400 V, 5.5 kW three phase induction motor with 2 poles pairs and 36 Nm nominal torque. It is coupled to a DC motor used as load. The induction motor is supplied by a standard industrial inverter operating in open loop condition.
The torque signal is measured by a rotating torque transducer through a 24 bit data acquisition board at 25.6 kHz sampling frequency. The general schematic of the test rig is illustrated in the Fig.3.
In this experimentation, the motor was tested in the healthy case and two faulty cases with 40% mixed eccentricity fault, and a misalignment fault for three different load levels 10, 50 and 80% corresponding to 4, 18 and 29 Nm torque.
B. Application of the diagnostic strategy
In order to reduce the computation complexity, and to preserve only the relevant information, we have lows-pass filtered the acquired torque signals and down sampled it to 5
kHz sampling rate.
To overcome the load level problem, we use the z-score normalization that centers the signal at zero mean and scales it to unit standard deviation [22], as given in eq (6):
v normalised v v v μ σ − = (6)
where, ȝv is the mean value, and ıv, is the standard deviation of the signal v.
To elaborate the training database, the collected signals from experiment has been divided into 216 segments of 4096 samples (72 representatives from each case), and each segment is processed to extract the AR model coefficients as features. The selected model order is 30 based on FPE and MDL criteria. So, the first thirteen coefficients of the AR model were extracted from the motor torque signal. Accordingly, we construct a database with the size of 216x30. After feature calculation and data set construction.
The self-organizing map network was implemented by using the SOM toolbox [23], developed in the Helsinki University of Technology. The data array was normalized before being admitted to the neural network, by normalization of the variance of vector components to unity, and its mean to zero. Then, a label and color is associated to each case: (HEA)
green for the healthy case, (ECC) yellow for the eccentricity fault, and (MIS) red for the misalignment fault. Two thirds of the constructed data set will serves to train the SOM, while the
Fig. 2. Proposed fault detection approach.
rest were kept for the testing.
C. Results and discussion
The result of the SOM can be interpreted by two ways: a topological two-dimensional grid containing the labels associated to the classes or by the Unified distance matrix (Umatrix), after the training stage. The first representation offers a topological knowledge of the projection of the whole data on the map, whereas the second gives visualization of the distance between closest units in the map.
The Figure (4) show the trained map using the extracted features. It consists of 66 (11x6) neurons. By visual inspection of the trained map, the U-matrix shows no clear separation between different classes, but from the associated labels it seems that they correspond to tree classes, were we get a very clear separation between the different motor conditions.
Classification performance of the SOM can be analyzed by projection of the testing data sets on the trained maps then find, for each data sample, the best matching unit from the map. Then, the class label of that unit is given to the sample [19].
The classification accuracy can be defined as the fraction of correctly classified input samples. The classification performances of the trained SOMs is given in Table 1.
TABLEI CLASSIFICATIONPERFORMANCES. Training time (s) Training accuracy (%) Test accuracy (%) 1.29 100 98.61 This results show the effectiveness of the proposed approach for detecting both eccentricity and misalignment faults, were we get a very good classification performances in
a reduced training time.
V. CONCLUSION
This study presents the possibilities of using the AR model coefficients of the measured torque as useful technique for the detection and diagnosis of mechanical faults in rotating machines. Experimental results for both eccentricity and misalignment faults at different load condition are reported.
The experimental results show the effectiveness of the proposed approach in mechanical fault detection were it’s not only capable to discriminate the faulty case from the health case, but it also might be easily distinguish between different faults.
Further investigation will also be conducted to test the capability of the proposed fault detection strategy to detect other faults, and its online implementation.
REFERENCES
[1] N. Halem, S. E. Zouzou, K. Srairi, S. Guedidi, F. A. Abbood, “Static eccentricity fault diagnosis using the signatures analysis of stator current and air gap magnetic flux by finite element method in saturated induction motors”, Int J Syst Assur Eng Manag, vol. 4(2), pp. 118–128, Apr-June 2013.
[2] V. Climente-Alarcon, J. Antonino-Daviu, M. Riera-Guasp, J. Pons-Llinares, J. Roger-Folch, P. Jover-Rodriguez, A. Arkkio, “Transient tracking of low and high-order eccentricity-related components in induction motors via TFD tools, Mechanical Systems and Signal Processing vol. 25, pp. 667–679, 2011.
[3] D. P. Behera, R. Behera, and V. N. A. Naikan, “Virtual Fault Simulation for Diagnosis of Shaft Misalignment of Rotating Machine” in Proc. 2014 International Conference on Advances in Computing, Communications and informatics (ICACCI)., pp. 2476-2480.
[4] J. L. Lin, J. Y. C. Liu, C. W. Li, L. F. Tsai, and H-Y. Chung, “Motor shaft misalignment detection using multiscale entropy with wavelet denoising”, Expert Systems with Applications vol. 37 pp. 7200–7204, 2010.
[5] S.R. Bognatz, “Alignment of critical and non-critical machines”. Orbit, pp. 23–25, 1995.
[6] H. Yang, J. Mathew, L. Ma, “Vibration Feature Extraction Techniques for Fault Diagnosis of Rotating Machinery - A Literature Survey”, In: Asia-Pacific Vibration Conference, 12-14 November 2003, Australia. [7] M. C. S. Reddy, A.S. Sekhar, “Detection and monitoring of coupling
misalignment in rotors using torque measurements”, Measurement vol.
61 pp. 111–122, 2015.
[8] A. K. Verma, S. Sarangi ,and M. H. Kolekar, ” Experimental Investigation of Misalignment Effects on Rotor Shaft Vibration and on Stator Current Signature”, J Fail. Anal. and Preven. 14 pp.125–138,
2014.
[9] J. L. F. Chacon, E. A. Andicoberry, V. Kappatos, G. Asfis, T. H. Gan, W. Balachandran, “Shaft angular misalignment detection using acoustic emission”, Applied Acoustics vol. 85 pp.12–22, 2014.
[10] A. G. Garcia-Ramirez, L. A. Morales-Hernandez, R. A. Osornio-Rios, J. P. Benitez-Rangel, A. Garcia-Perez, R. de J. Romero-Troncoso, “Fault detection in induction motors and the impact on the kinematic chain through thermo-graphic analysis”, Electric Power Systems Research vol.
114 pp. 1–9, 2014.
[11] M. Drif, A. J. M. Cardoso, “Airgap Eccentricity Fault Diagnosis, in Three- -Phase Induction Motors, by the Complex Apparent Power Signature Analysis”, In: SPEEDAM 2006 International Symposium on Power Electronics, Electrical Drives, Automation and Motion
[12] M.-C. Tsai, E.-C. Tseng, M.-Y. Cheng, “Design of a torque observer for detecting abnormal load”, Control Engineering Practice vol. 8 pp.
259-269, 2000
[13] J. Wang, S. Liu, R. X. Gao, R. Yanb, “Current envelope analysis for defect identification and diagnosis in induction motors”, Journal of
Manufacturing Systems vol. 31 pp. 380-387, 2012
[14] S. M. Kay, “Model spectral estimation: theory and application”. Prentice
Hall; 1988.
[15] W. Wang, A. K. Wong, “Autoregressive model-based gear fault diagnosis”. Journal of Vibration and Acoustics vol. 124 pp. 172-179,
2002
[16] H. Akaike, “A new look at the statistical model identification”. IEEE Transactions on Automatic Control vol. 19 pp. 716-723, 1974
[17] J. Rissanen, “Modeling by shortest data description”, Automatica vol. 14
pp. 465-471, 1978
[18] L. Bornn, C. R. Farrar, G Park, K. Farinholt, “Structural health
monitoring with autoregressive support vector machines”, Journal of
Vibration and Acoustics vol 131, 021004. 2009
[19] J. Wang, S. Liu, R. X. Gao, R. Yan, “Current envelope analysis for defect identification and diagnosis in induction motors”, Journal of
Manufacturing Systems vol. 31 pp. 380-387, 2012
[20] T. Kohonen, “Self-Organizing Maps”, Berlin, Edition Springer, 2001. [21] J. M. Bossio, C. H. De Angelo, G. R. Bossio, G. O. García, “Fault
Diagnosis on Induction Motors Using Self-Organizing Maps”, 9th IEEE/IAS International Conference on Industry Applications INDUSCON 2010
[22] R. O. Duda, P. E. Hart, and D. G. Stork, Pattern Classification, 2nd ed.
New York: Wiley-Interscience, 2000.
[23] J. Vesanto, J. Himberg, E. Alhoniemi, J. Parhankangas, “Self organizing map in Matlab: the SOM Toolbox”, Proceedings of the Matlab DSP Conference 1999, Espoo, Finland, pp. 35-40, November 16-17, 1999. http://www.cis.hut.fi/projects/somtoolbox