HAL Id: hal-01790601
https://hal-amu.archives-ouvertes.fr/hal-01790601
Submitted on 19 May 2018
HAL is a multi-disciplinary open access
archive for the deposit and dissemination of
sci-entific research documents, whether they are
pub-lished or not. The documents may come from
teaching and research institutions in France or
abroad, or from public or private research centers.
L’archive ouverte pluridisciplinaire HAL, est
destinée au dépôt et à la diffusion de documents
scientifiques de niveau recherche, publiés ou non,
émanant des établissements d’enseignement et de
recherche français ou étrangers, des laboratoires
publics ou privés.
Rita El-Haij, Carla Khater, Thierry Tatoni, Adam Alaa, Errol Véla
To cite this version:
Rita El-Haij, Carla Khater, Thierry Tatoni, Adam Alaa, Errol Véla. Indicators for ecosystem
con-servation and protected area designation in the Mediterranean context. Concon-servation and Society,
Medknow Publications, 2017, 15 (2), �10.4103/cs.cs_16_42�. �hal-01790601�
INTRODUCTION
IUCN’s World Database on Protected Areas (WDPA 2014)
records over 100,000 protected areas worldwide, covering over
12% of the Earth’s land surface. Protected areas are recognized
as the most important core units for in situ conservation
(Gaines et al. 2010; Game et al. 2009; Gray 2010; Lester
et al. 2009; Lubchenco et al. 2003, 2007; Pimm et al. 2001).
Conservationists and protected area managers around the world
spend millions of dollars each year to conserve biodiversity
and create new protected zones (Castro and Locker 2000).
However, measuring the number and extent of protected areas
provides only a unidimensional indicator of political and
national commitments to biodiversity conservation (Chape
et al. 2005).
Protected areas play a vital role in biodiversity conservation.
Yet they are not islands, they are components of their
Article
Indicators for Ecosystem Conservation and Protected Area Designation in the
Mediterranean Context
El-Hajj Rita
a,b#, Khater Carla
a, Tatoni Thierry
b, Ali A. Adam
c, Vela Errol
daNational Council for Scientific Research, Center for Remote Sensing, BP 11-8281, Riad el Solh, Beirut, Lebanon bInstitut Méditerranéen de Biodiversité et d’Ecologie marine et continentale (IMBE), Aix Marseille Université, CNRS, IRD, Avignon
Université - Campus de St-Jérôme, 13397, Marseille Cedex 20, France
cInstitut des Science de l’Evolution de Montpellier (UMR 5554, CNRS/UM/EPHE, IRD), Institut de botanique, 163, rue
Auguste-Broussonet, 34090 Montpellier, France
dUniversité Montpellier II, AMAP (botAnique et Modélisation de l’Architecture des Plantes et des végétations) - Boulevard de la Lironde
TA A-51 / PS2, 34398 Montpellier cedex 5, France
#Corresponding author. E-mail: ritahajj.sa@gmail.com
Abstract
Protected areas constitute a key foundation for national and international strategies of effective biodiversity and
ecosystems conservation. Yet, they are not islands; they are components of their surrounding social and ecological
contexts. Reconciling biodiversity conservation, people, protected areas and sustainable livelihoods requires a
focused strategic planning for conservation and development. The designation of new reserves must be thus based
on sound indicators within ecological, socioeconomic, institutional, and financial contexts. Many of the ecological
and socioeconomic indicators have been designed for this purpose by practitioners and conservation planners around
the world. Although these indicators are crucial to orient conservation priorities and protected areas’ designation
patterns, their identification remains a big challenge, largely due to the fact that an indicator is a simplification
of a system (whether natural or social) which is characterized by high structural complexity, considerable spatial
heterogeneity and temporal fluctuations. This paper presents a review of ecological and socioeconomic indicators
globally used to orient conservation planning on the global and national levels. It also suggests a set of suitable,
relevant, and practical set of indicators, adapted to Mediterranean-type continental environments.
Keywords: Socio-ecological systems, Indicators, Decision-support tool, Biodiversity, Mediterranean, Protected
areas
Access this article online
Quick Response Code:
Website:
www.conservationandsociety.org
DOI:
10.4103/cs.cs_16_42
Copyright: © Rita et al. 2017. This is an open access article distributed under the terms of the Creative Commons Attribution License, which permits unrestricted use and distribution of the article, provided the original work is cited. Published by Wolters Kluwer - Medknow, Mumbai | Managed by the Ashoka Trust for Research in Ecology and the Environment (ATREE), Bangalore. For reprints contact: reprints@medknow.com
surrounding social and ecological contexts (Brandon et al.
1998). The most significant challenge facing both conservation
and development is the need to support rural livelihoods by
adequately assessing and capturing the value of environmental
services (Kremen et al. 2000). Reconciling biodiversity
conservation, people, protected areas and sustainable
livelihoods thus requires a focused strategic planning for
conservation and development, which upholds biodiversity and
ecosystem services without imposing serious restrictions on
livelihoods (Brandon et al. 2005; Ferraro and Pressey 2015).
Still, the creation of new protected areas remains essential to
maintain biodiversity and avoid major species losses (Brandon
et al. 2005; Geldmann et al. 2013). The designation of new
reserves that halt habitat degradation and species extinction
must be based on sound information on the ecological,
socioeconomic, institutional, and financial contexts (Cowling
and Pressey 2003). Building on such information, it is possible
to design protected areas that are integrated into the landscape
and that support, rather than detract from, local livelihoods.
Understanding such complex systems requires simplification,
and essential to this understanding is the construction of a
simple picture with a limited set of relevant factors: indicators
(Turnhout et al. 2007).
What indicators to orient conservation priorities and
prioritize protected area designation patterns in complex
socio-ecological contexts? Conservation efforts usually
emphasize the preservation of individual species, landscapes,
indicator species, and endemic or rare species, rather than
socio-ecological processes (Margules and Pressey 2000).
This is partially due to a lack of informative indicators on
ecosystem function and socio-ecological dynamics (Bowker
et al. 2008; El-Hajj et al.2016). Unfortunately, many reserve
systems throughout the world are highly biased toward
particular subsets of natural features, usually small habitats
with less economic value and fewer species, while larger
and biologically richer areas are inadequately protected
(Pressey 1994). Therefore, although individual reserves may
be valuable, existing reserve networks often fail to represent
adequately the biodiversity within a particular region (Brandon
et al. 2005; El-Hajj et al.2016; Gaston et al. 2008; Le Saout
et al. 2013; Rodrigues et al. 2004). The ideal design of a
protected area has to be based on numerous factors, including
habitat assets, species diversity, conservation status, suitability
of the area, and the socioeconomic context in and around the
proposed reserve (Brandon 2002; Cowling and Pressey 2003;
Pressey1998). Several frameworks were tailored in this context
to address ecosystem conservation, mainly the
Pressure-State-Response (PSR) and the
Driver-Pressure-State-Impact-Response (DPSIR) models (OECD 2001; Kristensen 2004).
These models suggest “pressure” and “response” indicators,
both on the ecological and socioeconomic levels to assess the
fittingness of an area for conservation, such as (inter alia) the
impact of anthropogenic pressures on the ecological state of a
given ecosystem (i.e. number of threatened or extinct species),
Arising from this complex understanding of protected areas
and their socio-ecological importance, this paper presents
a review of key ecological and socioeconomic indicators
used by practitioners and conservation planners around
the world to establish new protected areas. Consequently,
it suggests a justified set of suitable, practical and adapted
indicators to pertinently orient protected areas’ designation
in Mediterranean-type continental environments. The
Mediterranean basin constitutes a particularly interesting case
study due to the long history of human impact and the complex
socio-ecological embedded dynamics. This systematic review
brings forward research contributions investigating indicators
and criteria related to protected areas’ designation worldwide,
and thus highlights the main findings in this field, while
underlining the most fitted options for Mediterranean-type
ecosystems.
METHODOLOGY
A systematic assessment of peer reviewed and grey literature is
applied to investigate ecological and socioeconomic indicators
and the criteria used for setting conservation priorities and
designing protected areas worldwide. This comprehensive
review brings forward the diversity of criteria employed in
conservation initiatives and highlights major conservation
schemes and processes. It constitutes an important contribution
to the literature as it compiles research studies gathered
from around the world to address a common multifaceted
question. Based on this bibliographic review, a specific set
of indicators is identified to orient designation of protected
areas in Mediterranean environments. This minimum number
of pertinent indicators describes the maximum ecological and
socioeconomic features of a specific site. These indicators
cover key ecological and socioeconomic variables that reflect
the major processes and aspects that orient protection patterns.
They do not overlap with each other (no redundancy) but
are instead complementary, and are specifically adapted to
Mediterranean environments. They are also integrative, easy
to measure, practical, customized for continental environments
(at least), and above all, address both the ecological and
socioeconomic aspects of conservation. Justification of their
adaptation to Mediterranean environments is provided for
each indicator. Mediterranean continental-type ecosystems are
recognized for their particularly interesting socio-ecological
complexity, shaped by human impacts and globally recognized
for their irreplacability and vulnerability (Cody 1986; Cowling
et al. 1996; Dallman 1998; Underwood et al. 2009).
ECOLOGICAL INDICATORS: SIMPLIFYING
COMPLEXITY
In connection with the growing focus on conservation,
ecologists must develop sound methods for monitoring,
assessing and managing ecological integrity through the use
of indicators. Ecological indicators represent key information
and provide a simple and efficient method to examine the
ecological structure, function, and composition of an ecological
system while capturing the complexities of the ecosystem (Karr
1981). Yet, these indicators should remain simple enough to
be easily and routinely monitored and modeled (Dale and
Beyeler 2001). However, this is not an easy task. This has to
do with the fact that an ecological indicator is a simplification
of nature, which is perceived to be a system characterized by
high structural complexity, considerable spatial heterogeneity,
and temporal fluctuations. Ecological indicators attempt to
measure the ecological quality of ecosystems and can be
used as instruments to evaluate the effects of policies on
nature (Turnhout et al. 2007). Many different levels exist for
ecological indicators, making it a complex and potentially
confusing concept.
The concept of biological or ecological indication goes a long
way back in history. Kolkwitz and Marsson (1902) were among
the first to describe aquatic systems in terms of indicator species.
For terrestrial systems, Ellenberg (1974) made an important
contribution by systematically linking abiotic soil factors with
existing vegetation. Margules and Usher (1981) examined
nine published schemes concerned with the assessment of
conservation potential and ecological value. In each case,
they listed the criteria used to judge the suitability of a habitat
for conservation. These include diversity (including species
richness and habitat diversity), rarity, naturalness, numbers
of biological interactions (e.g. predatory, competition), area,
threat of human interference, typicality, representativeness,
educational value, amenity value, recorded history, scientific
value, uniqueness, wildlife reservoir potential, ecological
fragility, position in ecological/geographical unit (spatial
position), potential value, availability, replaceability, ease of
acquisition, and management considerations.
To date, the use of ecological indicators to assess biodiversity
status and prioritize conservation needs has been growing
worldwide and new conservation systems and protected areas
based on a set of specific indicators are emerging despite the
presence of a wide set of criteria used for ranking the relative
ecological and conservation values of potential reserves. The
design of conservation reserves has been widely debated
for decades. At the global scale, several schemes have been
employed to identify areas that may be particularly important
for the long-term maintenance of biodiversity. As decision
criteria, these schemes have variously used data on patterns
of species richness, endemism, phylogenetic age of species,
vulnerability, irreplaceability, as well as other habitat features.
They have led to the recognition of, for example, biodiversity
hotspots (Mittermeier et al.1998; Myers et al. 2000); centres
of plant diversity (Davis et al. 1994, 1995); endemic bird areas
(Bibby et al. 1992; Balmford and Long 1994; Stattersfield
et al. 1998); key biodiversity areas (Eken et al. 2004); alliance
for zero extinction sites (Ricketts et al. 2005); eco-regions
(Olson and Dinerstein 1998) and many other priority areas
for conservation. To varying degrees, such schemes have
influenced both thoughts and actions.
In prioritizing areas for conservation at the national
(administrative) scale, conservationists around the world
have used various criteria for evaluating natural areas for the
intent of land-use planning and protected area designation.
These include, among others, rarity (on the specific and habitat
levels), site uniqueness, species richness (diversity), size, site
naturalness, fragility, representativeness, spatial connectivity,
typicality, vegetation structure, fragility, number of plant
alliances, number of plant structural formations, vulnerability,
irreplaceability and endemism (Tubbs and Blackwood 1971;
Tans 1974; Gehlbach 1975; Goldsmith 1975; Wright 1977;
Van der Ploeg and Vlijm 1978; Rabinowitz 1981; Smith and
Theberge 1986; Pressey et al. 1994; Gubbay 1995; Pressey and
Taffs 2001; Noss et al. 2002; Laguna et al. 2004; Derous et al.
2007; Kier et al. 2009; Gauthier et al. 2010;). The use of these
indicators led to the recognition of numerous types of protected
areas worldwide - varying from one country to another
according to each nation’s legislations and conservation needs
- such as micro-reserves, nature reserves, protected forests,
sanctuaries and protected seascapes (Chape et al. 2003).
While the focus on rare, threatened and endemic species
has commonly been retained (Abbitt et al. 2000; Bode et al.
2008; Bonn et al. 2002; Daniels et al. 1991; Dobson et al.
1997; Drinkrow and Cherry 1995; Troumbis and Panayotis
1998), studies revealed that reserve networks focusing solely
on threatened and endemic species may not be sufficient to
preserve the overall species diversity present in a country
(Bonn et al. 2002).
In terms of size, several debates argued whether a Single
Large Or Several Small (cf. the SLOSS debate, 1970-1980)
reserves were a superior means of conserving biodiversity.
While numerous studies confirmed that larger protected
areas are more desirable for long-term species conservation
and maintenance of ecological and evolutionary processes
(Cowling et al. 1999; Bierregaard et al. 2001), other researches
argued that small reserves are adequate for some species and
are almost always better than no reserve or management over
an area at all (Turner and Corlett 1996).
Karr (1991), Angermeier and Karr (1994) and Noss (1995)
used ecological integrity as a key criteria for ecosystem
assessment. Ecological integrity refers to system wholeness,
including the presence of appropriate species, populations
and communities and the occurrence of ecological processes
at appropriate rates and scales as well as the environmental
conditions that support these taxa. Measuring ecological
integrity can rely on a set of indicators including number
of populations, species richness, spatial distribution of
communities, stand’s age, etc. Such an approach is increasingly
being used to guide monitoring efforts across protected areas
(Wurtzebach and Schultz, 2016).
In Europe, the Natura 2000 network is a network of
protected sites scattered along the European Union, made up of
Special Areas of Conservation and Special Protection Areas,
designated respectively under the Habitats Directive and the
Birds Directive, and including both terrestrial and marine
sites (Ostermann 1998). It uses species and habitat features
such as representativeness, conservation status, functionalities
(resting, breeding, feeding, wintering or summering area),
habitat size, population density of target species, spatial
connectivity and species vulnerability as main indicators to
orient the designation of the protected sites (Lepareur 2011;
Viry 2013).
The international union for conservation of nature (IUCN)
also invested significant efforts in defining protected area
categories and ecological selection criteria such as naturality,
representativeness, size and conservation status (Dudley 2008).
Ecological indicators tailored to orient conservation priorities
and protected area designation also include site heterogeneity
(Lindenmayer et al. 2000), site unicity and natural character
(Gubbay 1995).
Even though the use of ecological indicators and criteria
is gaining further interest in conservation planning, all these
indicators remain unstandardised, as they belong to different
categories (quantitative/qualitative, species/habitat) and are
frequently found duplicated and sometimes not applicable,
although the goal still remains: ecological conservation.
SOCIOECONOMIC INDICATORS: A KEY
DIMENSION TO CONSERVATION
Throughout the world, established protected areas are under
severe natural and human threats such as land use change,
urbanisation, excavation, harvesting, hunting, pollution
and climate change, which are leading to their progressive
fragmentation and isolation (Brandon et al. 1998; Oates 1999;
Carey et al. 2000; Sala et al. 2000; Bruner et al. 2001). With
continued economic growth, it is likely that the pressure on
biodiversity will further increase.
Socioeconomic data enable the evaluation of the human
context of protected areas - that is, the number of people
present, their geographic distribution, and socioeconomic and
sociocultural characteristics - in order to provide key insights
into the effectiveness of potential new reserves (Brandon
et al. 2005). Biodiversity can be well managed or heavily
impacted by the actions of relatively few people (Gorenflo
2002). Reserve categories such as man and biosphere reserves
or other sites with human residents, can only be successful
if there is participation and management of zoning and use
designations. Therefore, successful conservation planning
requires socioeconomic data (Polasky 2008).
Socioeconomic indicators mainly communicate aspects
related to external threats on protected areas, economic value
of the protected site, educational suitability, management
appraisal, potential amenity use, accessibility, as well as
financial and legislative contexts for conservation (Gehlbach
1975; Haughton and Siar 2006; Roberts et al. 2003; Smith and
Theberge 1986; Wright 1977). Bode et al. (2008) use data on
the cost of establishing new biological reserves as indicators
to address conservation allocation patterns. Furthermore,
socioeconomic indicators provide sound information on the
socioeconomic dependence of the surrounding communities
on the potential protected area (hunting, recreation, tourism,
harvesting, etc.), and the cultural value of the latter (educational,
historical or archeological importance) (Jacot 2009).
Unfortunately, this category of indicators is not sufficiently
taken into consideration during conservation planning. For
instance, the designation of Natura 2000 sites in Europe is
founded only on ecological indicators. Socioeconomic aspects
are considered only in the management phases of these sites
(Smith and Theberge 1986).
However, the concepts of ecosystems services and the
economic value of biodiversity are gaining more interest
among conservation planners who are further mainstreaming
the economic values of ecosystems and biodiversity into
conservation initiatives (Naidoo et al. 2008). This upsurging
interest draws attention to global economic benefits of
biodiversity and highlights the growing cost of biodiversity loss
and ecosystem degradation (Sukhdev et al. 2010). Ecosystem
services constitute the key foundation of this relatively new
concept, where humankind benefits in a multitude of ways from
supporting, provisioning and regulating the cultural services
provided by ecosystems by virtue of their very existence, a
value estimated at US$33 trillion per year (Costanza et al.
1998). This economic and market-based valuation of ecosystem
services constitutes the foundation of a model of conservation
that promotes economic profits for local communities based
on the exploitation of ecosystem goods and services. This
model has been criticised as “neoliberal conservation” (Igoe
and Brockington 2007; Büscher 2012; Holmes and Cavanagh
2016). In this context, assessing the economic value of
biodiversity provides pertinent socioeconomic indicators
related to the direct use value, indirect use value, option value
and existence value of a given ecosystem (MA 2005).
INTEGRATING ECOLOGICAL PRIORITIES WITH
SOCIOECONOMIC GOALS
Throughout the last decades, conflicts between the socioeconomic
and the ecological spheres in densely populated areas such
as the Mediterranean region has brought more burdens to
protected areas. Changes in the traditional relationship between
humans and their environments created new challenges to
protected areas, where emerging technologies, globalization,
industrial growth, changes in land use, urbanization, excessive
exploitation of natural resources, and population growth, all
have had a severe impact on terrestrial ecosystems (Lampic
et al. 2012; Huwart and Verdier 2013). This co-evolution (and
not just competition) of humans and ecosystems underlines
a strong need for understanding and aligning ecological and
socioeconomic priorities for an integrated conservation of
natural resources (Sodhi and Ehrlich 2010).
Striking a proper balance in conservation planning requires
good communication between economists and ecologists
(Eppink and van den Bergh 2007). The need to communicate
the scientific concepts of ecological indicators to non-scientists
is increasingly being tackled by teams of environmental
scientists working with social scientists (Schiller et al. 2001;
Redman et al. 2004). Yet, integrating ecological indicators with
social and economic goals for resource management remains
a big challenge (Dale and Beyeler 2001).
Due to the complexity of ecosystems and the normative
aspects involved in assessing ecosystem quality, indicators
used to orient conservation priorities cannot be solely
science-based but are situated in a fuzzy area between science and
policy (Turnhout et al. 2007).
Recognising the fact that humans and nature are
interdependent elements, integrating both ecological and
socioeconomic aspects in prioritizing conservation patterns
is a key first step to achieving such optimal conservation. The
concept of socio-ecological systems (S.E.S) is currently gaining
further interest among conservationists as it acknowledges the
complexity of interactions between humans and their natural
environment, where both traditional ecological aspects along
with the human dimension in nature protection are taken into
consideration during conservation planning (Cioffi-Revilla,
2016; Folke 2007; Lagadeuc and Chenorkian, 2009; Liu et al.
2007; Redman et al. 2004).
Integration of the social sciences into long-term ecological
research is an urgent priority, and what is often divided into
“natural” and “human” systems has to be considered as a
single complex socio-ecological system when approaching
conservation targets (Redman et al. 2004).
SUGGESTING A SET OF ECOLOGICAL AND
SOCIOECONOMIC INDICATORS FOR PROTECTED
AREA DESIGNATION IN MEDITERRANEAN
CONTINENTAL ENVIRONMENTS
The Mediterranean basin, one of the most biologically diverse
regions in the world (Médail and Quézel 1999; Mittermeier
et al. 1998; Myers et al. 2000), owes its high diversity and
spectacular scenery to its location at the intersection of
two major landmasses, Eurasia and Africa. This basin has
experienced intensive human development and impact on its
ecosystems for thousands of years, significantly longer than
in any other biological hotspot. Important human settlements
have existed in the area for at least 10,000 years, shaping
its landscapes and downing its resources. From habitat
fragmentation to the mass development of road networks and
tourism hubs on coastal areas, today a mere 5% of the original
extent of the hotspot contains relatively intact vegetation,
placing the Mediterranean basin among the four most
significantly altered biodiversity hotspots on Earth (Cuttelod
et al. 2008; Underwood et al. 2009).
Yet, the extent to which existing protected areas are effectively
representing, maintaining and conserving key ecological features
in the Mediterranean region is still poorly understood: indeed
protected area designation seems to follow political priorities
and opportunities (such as in Lebanon) rather than being founded
on pertinent ecological and socioeconomic criteria that would
highlight the relevance and priority for conservation measures
(El-Hajj et al.2016). In such a complex socio-ecological context,
orienting conservation priorities and protection patterns in the
Mediterranean region remains thus a challenge. To achieve
optimal ecological conservation, there is a need to:
i) Identify pertinent criteria and indicators that would
objectively orient conservation priorities based on relevant
ecological and socioeconomic indicators encompassing
all aspects related to biodiversity (flora and fauna),
physical environments (soil, topography, geology, etc.)
and livelihoods (El-Hajj et al. 2016).
ii) Achieve efficient environmental governance, including
effective local initiatives (Agrawal and Lemos 2007) and
targeting an improved application of policies and indicators
related to conservation planning (Smith et al. 2003)
At this stage, we chose to select a minimum number of
pertinent indicators able to describe maximum ecological
and socioeconomic features of a specific site in view of its
potential designation as a protected area. These indicators
cover key ecological and socioeconomic variables that
reflect major processes and aspects, orienting protection
patterns in one direction or another. They do not overlap
with each other (no redundancy) but are complementary,
and they are adapted to Mediterranean environments by
considering some specific socioeconomic aspects particular
to the Mediterranean countries (such as Lebanon), aspects
that might affect and challenge conservation initiatives
on the national level. Suggested indicators are inspired from
the corpus of indicators globally used to orient conservation
priorities and protected area designation. They are integrative,
easy to measure, practical, and above all, tackle both
ecological and socioeconomic aspects of conservation
(Tables 1, 2 and 3).What’s more, these indicators reflect distinct
socio-ecological aspects known to be very particular to the
Mediterranean (such as property constraints and species rarity).
In other types of ecosystems, such as mangrove ecosystems,
different types of indicators can be of additional value (such
as water characteristics, pH, etc.). They are thus adapted to
Mediterranean-type continental environments (at least) but can
be potentially used to orient conservation planning (protected
area designation) in other types of ecosystems (Mediterranean
marine ecosystems, polar ecosystems, tropical ecosystems,
etc.). However, applied to other types of ecosystems, they
won’t be as much representative, specific and adapted as for
Mediterranean-type contexts. Furthermore, the categorization
of suggested indicators partly overlaps with the quite
well-known and widely adopted PSR/DPSIR categorization, as it
somehow exhibits causal dependencies between the interacting
socio-economic and environmental systems for a pertinent
orientation of conservation measures.
Each indicator may contain one or more separate measures,
each of which can be assessed separately to identify whether it
is changing, and if so, whether this change will affect or not,
the conservation priority.
CONCLUSION
Drawing on a comprehensive global gap analysis undertaken
by Conservation International in 2003, Rodrigues et al.
(2004) concluded that the degree to which biodiversity is
represented within the existing network of protected areas
is unknown. Although a number of countries have designed
and implemented protected area system plans, studies have
confirmed that protected area establishment does not frequently
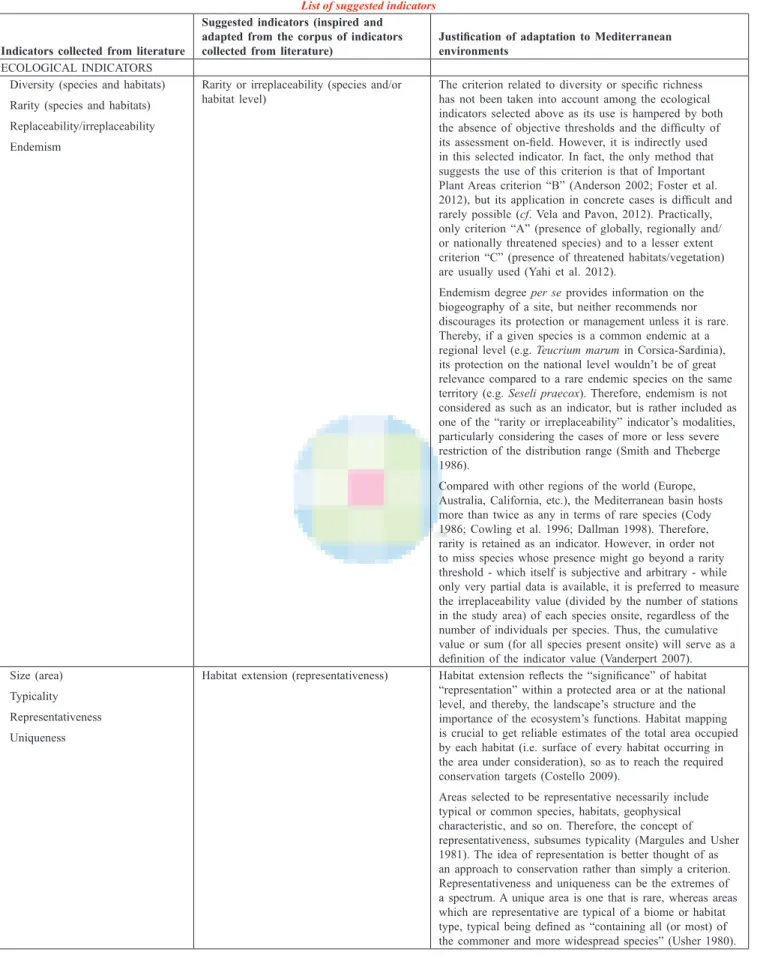
Table 1 List of suggested indicators
Indicators collected from literature
Suggested indicators (inspired and adapted from the corpus of indicators
collected from literature) Justification of adaptation to Mediterranean environments
ECOLOGICAL INDICATORS Diversity (species and habitats) Rarity (species and habitats) Replaceability/irreplaceability Endemism
Rarity or irreplaceability (species and/or
habitat level) The criterion related to diversity or specific richness has not been taken into account among the ecological indicators selected above as its use is hampered by both the absence of objective thresholds and the difficulty of its assessment on-field. However, it is indirectly used in this selected indicator. In fact, the only method that suggests the use of this criterion is that of Important Plant Areas criterion “B” (Anderson 2002; Foster et al. 2012), but its application in concrete cases is difficult and rarely possible (cf. Vela and Pavon, 2012). Practically, only criterion “A” (presence of globally, regionally and/ or nationally threatened species) and to a lesser extent criterion “C” (presence of threatened habitats/vegetation) are usually used (Yahi et al. 2012).
Endemism degree per se provides information on the biogeography of a site, but neither recommends nor discourages its protection or management unless it is rare. Thereby, if a given species is a common endemic at a regional level (e.g. Teucrium marum in Corsica-Sardinia), its protection on the national level wouldn’t be of great relevance compared to a rare endemic species on the same territory (e.g. Seseli praecox). Therefore, endemism is not considered as such as an indicator, but is rather included as one of the “rarity or irreplaceability” indicator’s modalities, particularly considering the cases of more or less severe restriction of the distribution range (Smith and Theberge 1986).
Compared with other regions of the world (Europe, Australia, California, etc.), the Mediterranean basin hosts more than twice as any in terms of rare species (Cody 1986; Cowling et al. 1996; Dallman 1998). Therefore, rarity is retained as an indicator. However, in order not to miss species whose presence might go beyond a rarity threshold - which itself is subjective and arbitrary - while only very partial data is available, it is preferred to measure the irreplaceability value (divided by the number of stations in the study area) of each species onsite, regardless of the number of individuals per species. Thus, the cumulative value or sum (for all species present onsite) will serve as a definition of the indicator value (Vanderpert 2007). Size (area)
Typicality Representativeness Uniqueness
Habitat extension (representativeness) Habitat extension reflects the “significance” of habitat “representation” within a protected area or at the national level, and thereby, the landscape’s structure and the importance of the ecosystem’s functions. Habitat mapping is crucial to get reliable estimates of the total area occupied by each habitat (i.e. surface of every habitat occurring in the area under consideration), so as to reach the required conservation targets (Costello 2009).
Areas selected to be representative necessarily include typical or common species, habitats, geophysical characteristic, and so on. Therefore, the concept of representativeness, subsumes typicality (Margules and Usher 1981). The idea of representation is better thought of as an approach to conservation rather than simply a criterion. Representativeness and uniqueness can be the extremes of a spectrum. A unique area is one that is rare, whereas areas which are representative are typical of a biome or habitat type, typical being defined as “containing all (or most) of the commoner and more widespread species” (Usher 1980).
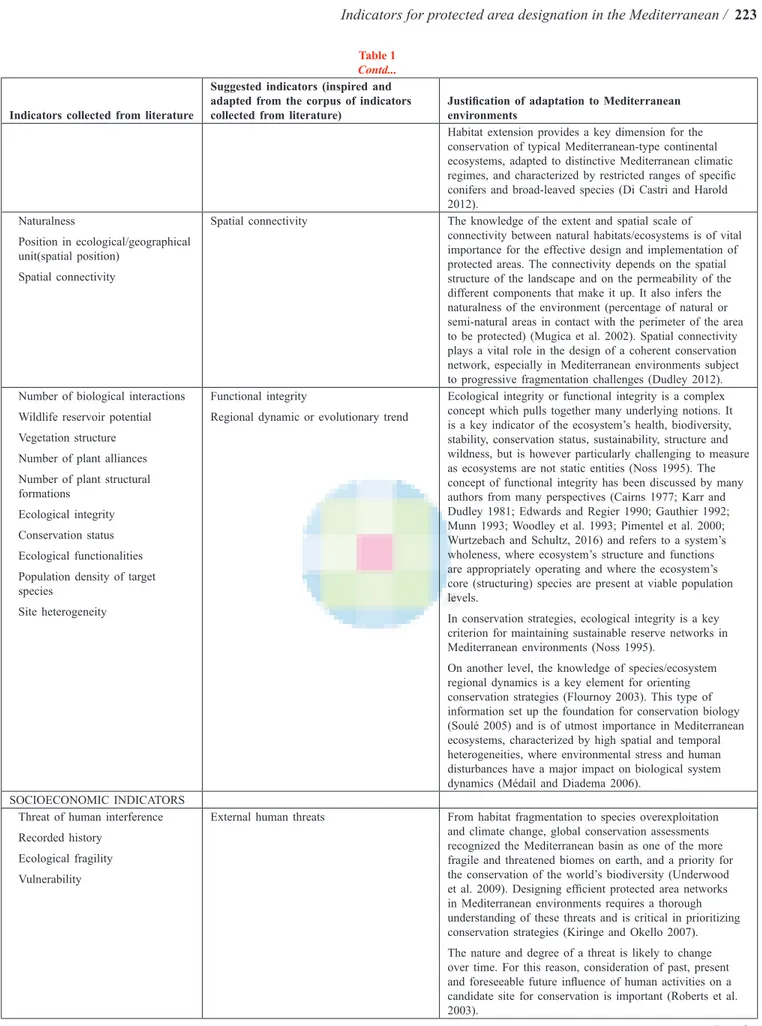
Table 1 Contd...
Indicators collected from literature
Suggested indicators (inspired and adapted from the corpus of indicators
collected from literature) Justification of adaptation to Mediterranean environments
Habitat extension provides a key dimension for the conservation of typical Mediterranean-type continental ecosystems, adapted to distinctive Mediterranean climatic regimes, and characterized by restricted ranges of specific conifers and broad-leaved species (Di Castri and Harold 2012).
Naturalness
Position in ecological/geographical unit(spatial position)
Spatial connectivity
Spatial connectivity The knowledge of the extent and spatial scale of connectivity between natural habitats/ecosystems is of vital importance for the effective design and implementation of protected areas. The connectivity depends on the spatial structure of the landscape and on the permeability of the different components that make it up. It also infers the naturalness of the environment (percentage of natural or semi-natural areas in contact with the perimeter of the area to be protected) (Mugica et al. 2002). Spatial connectivity plays a vital role in the design of a coherent conservation network, especially in Mediterranean environments subject to progressive fragmentation challenges (Dudley 2012). Number of biological interactions
Wildlife reservoir potential Vegetation structure Number of plant alliances Number of plant structural formations
Ecological integrity Conservation status Ecological functionalities Population density of target species
Site heterogeneity
Functional integrity
Regional dynamic or evolutionary trend
Ecological integrity or functional integrity is a complex concept which pulls together many underlying notions. It is a key indicator of the ecosystem’s health, biodiversity, stability, conservation status, sustainability, structure and wildness, but is however particularly challenging to measure as ecosystems are not static entities (Noss 1995). The concept of functional integrity has been discussed by many authors from many perspectives (Cairns 1977; Karr and Dudley 1981; Edwards and Regier 1990; Gauthier 1992; Munn 1993; Woodley et al. 1993; Pimentel et al. 2000; Wurtzebach and Schultz, 2016) and refers to a system’s wholeness, where ecosystem’s structure and functions are appropriately operating and where the ecosystem’s core (structuring) species are present at viable population levels.
In conservation strategies, ecological integrity is a key criterion for maintaining sustainable reserve networks in Mediterranean environments (Noss 1995).
On another level, the knowledge of species/ecosystem regional dynamics is a key element for orienting conservation strategies (Flournoy 2003). This type of information set up the foundation for conservation biology (Soulé 2005) and is of utmost importance in Mediterranean ecosystems, characterized by high spatial and temporal heterogeneities, where environmental stress and human disturbances have a major impact on biological system dynamics (Médail and Diadema 2006).
SOCIOECONOMIC INDICATORS Threat of human interference Recorded history
Ecological fragility Vulnerability
External human threats From habitat fragmentation to species overexploitation and climate change, global conservation assessments recognized the Mediterranean basin as one of the more fragile and threatened biomes on earth, and a priority for the conservation of the world’s biodiversity (Underwood et al. 2009). Designing efficient protected area networks in Mediterranean environments requires a thorough understanding of these threats and is critical in prioritizing conservation strategies (Kiringe and Okello 2007). The nature and degree of a threat is likely to change over time. For this reason, consideration of past, present and foreseeable future influence of human activities on a candidate site for conservation is important (Roberts et al. 2003).
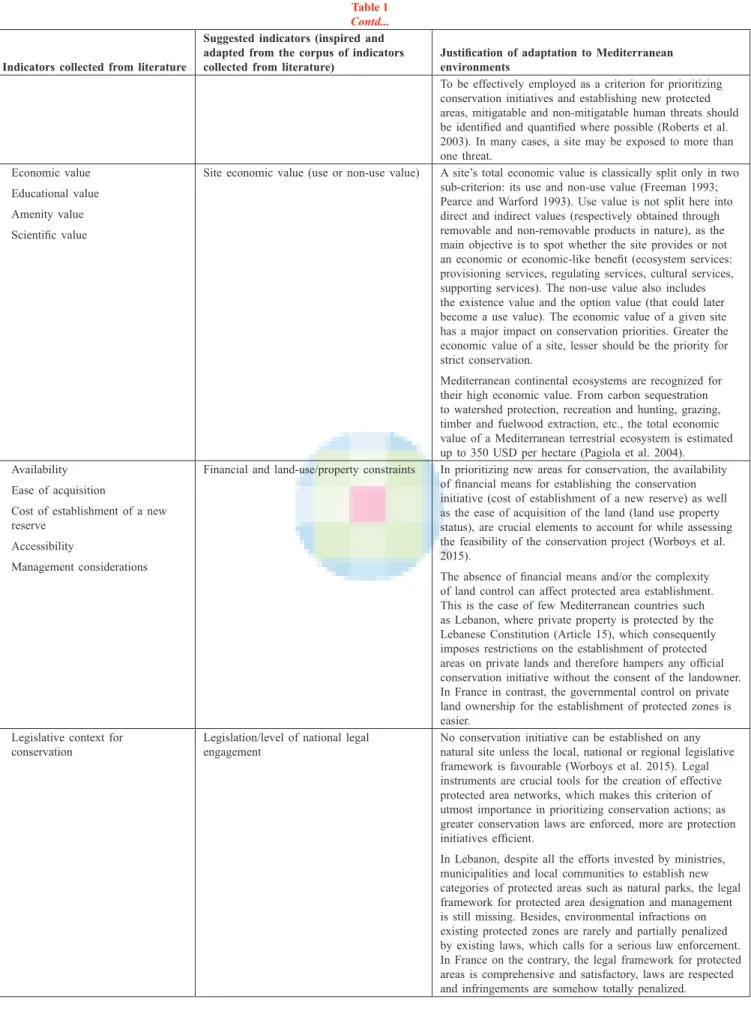
Table 1 Contd...
Indicators collected from literature
Suggested indicators (inspired and adapted from the corpus of indicators
collected from literature) Justification of adaptation to Mediterranean environments
To be effectively employed as a criterion for prioritizing conservation initiatives and establishing new protected areas, mitigatable and non-mitigatable human threats should be identified and quantified where possible (Roberts et al. 2003). In many cases, a site may be exposed to more than one threat.
Economic value Educational value Amenity value Scientific value
Site economic value (use or non-use value) A site’s total economic value is classically split only in two sub-criterion: its use and non-use value (Freeman 1993; Pearce and Warford 1993). Use value is not split here into direct and indirect values (respectively obtained through removable and non-removable products in nature), as the main objective is to spot whether the site provides or not an economic or economic-like benefit (ecosystem services: provisioning services, regulating services, cultural services, supporting services). The non-use value also includes the existence value and the option value (that could later become a use value). The economic value of a given site has a major impact on conservation priorities. Greater the economic value of a site, lesser should be the priority for strict conservation.
Mediterranean continental ecosystems are recognized for their high economic value. From carbon sequestration to watershed protection, recreation and hunting, grazing, timber and fuelwood extraction, etc., the total economic value of a Mediterranean terrestrial ecosystem is estimated up to 350 USD per hectare (Pagiola et al. 2004).
Availability Ease of acquisition
Cost of establishment of a new reserve
Accessibility
Management considerations
Financial and land-use/property constraints In prioritizing new areas for conservation, the availability of financial means for establishing the conservation initiative (cost of establishment of a new reserve) as well as the ease of acquisition of the land (land use property status), are crucial elements to account for while assessing the feasibility of the conservation project (Worboys et al. 2015).
The absence of financial means and/or the complexity of land control can affect protected area establishment. This is the case of few Mediterranean countries such as Lebanon, where private property is protected by the Lebanese Constitution (Article 15), which consequently imposes restrictions on the establishment of protected areas on private lands and therefore hampers any official conservation initiative without the consent of the landowner. In France in contrast, the governmental control on private land ownership for the establishment of protected zones is easier.
Legislative context for
conservation Legislation/level of national legal engagement No conservation initiative can be established on any natural site unless the local, national or regional legislative framework is favourable (Worboys et al. 2015). Legal instruments are crucial tools for the creation of effective protected area networks, which makes this criterion of utmost importance in prioritizing conservation actions; as greater conservation laws are enforced, more are protection initiatives efficient.
In Lebanon, despite all the efforts invested by ministries, municipalities and local communities to establish new categories of protected areas such as natural parks, the legal framework for protected area designation and management is still missing. Besides, environmental infractions on existing protected zones are rarely and partially penalized by existing laws, which calls for a serious law enforcement. In France on the contrary, the legal framework for protected areas is comprehensive and satisfactory, laws are respected and infringements are somehow totally penalized.
Table 2
Detailed description of suggested ecological indicators/indicators
Indicator Definition Suggested variables to be measured
Rarity or irreplaceability
(species and/or habitat level) A rare or irreplaceable area is an area containing:Rare or unique species or populations; and/or Habitats (in the broad sense): complete ecosystem (biotope + biocenosis), biocenosis (communities, phyto-sociological associations, etc.), or biotopes (geomorphological or geological and bioclimatic features) that are unique, rare or unusual.
Five different types of species’ rarity are discerned in the literature: “widespread rare species” that occur over a wide geographical area but are scarce wherever they do occur and may have a patchy or continuous distribution; “endemic species with restricted geographical ranges”; “disjoint populations that are geographically separated from the main range of the species”; “peripheral populations that are at the edge of their species’ geographical range”; and “declining species that were once more abundant and/ or widespread but are now depleted” (Smith and Theberge 1986), which makes rarity assessment processes often complex.
A rare area is an area where species, populations and geomorphological features are irreplaceable. The irreplaceability of some ecosystems implies the absence of ecological equivalents elsewhere on the structural and functional levels (nature of stands, geomorphological features, and functional integrity). Their loss would mean the probable permanent loss of a certain feature, or the loss of diversity at a given level.
The irreplaceability (or uniqueness) of a site is the degree to which spatial options for conservation are lost if the site and its biodiversity are lost (Pressey et al. 1994). Irreplaceability is based on a site’s biological composition in relation to the biological composition of other sites. A site has extreme irreplaceability if one or more of its species or habitats are totally confined to it and thus the site is the only option for protecting this species/habitat. The more options that exist for conserving a species, the lower the irreplaceability of the sites at which it occurs. All else being equal, a site with high irreplaceability is a higher priority for conservation action than one with lower irreplaceability (Langhammer 2007).
Ratio of rare species if species inventories are comprehensive (number of rare species divided by the total number of species).
Presence/number of rare species if species inventories are not comprehensive (only partial).
Habitat rarity or unicity (ecosystem, biotope or biocenosis) if habitat or bioclimatic or geologic inventories or maps are available in the study area (regardless of the availability or not of species inventories).
Presence/number of endemic species (restricted range and/or site restricted species) with species inventories comprehensive or not.
Habitat representativeness/
extension Representativeness refers to the degree to which an area represents a habitat type, an ecological process, a biological community, a geographic or physical characteristic, or any other natural features on a given territory; an area that is an illustrative and exceptional example of specific biodiversity, ecosystems, ecological or physiographic processes, habitat types, communities or other natural characteristics.
Habitat extension on the territory scale (administrative level): Relative surface of the habitat in the
administrative area (e.g. national/county level) compared to the total surface of the administrative area (e.g. county).
Habitat extension within the site of interest (relative area of the habitat in the potential protected area compared to the total area of the habitat at the administrative level.)
Spatial connectivity Ecological connectivity refers to the functional connectivity that links all the elements of an eco-landscape (natural or semi-natural habitats, buffer zones, biological corridors) between them (excluding buildings and human infrastructure) from a species or a population (or a combination of these entities) point of view, for all or part of their development stages, at a given time or for a given period. By extension, connectivity decreases when fragmentation increases.
Naturalness of the environment (percentage of natural or semi-natural areas in contact with the perimeter of the area to be protected)
Maximal permeability (of the neighboring ecosystem having the highest permeability with the main ecosystem of the area to be protected)
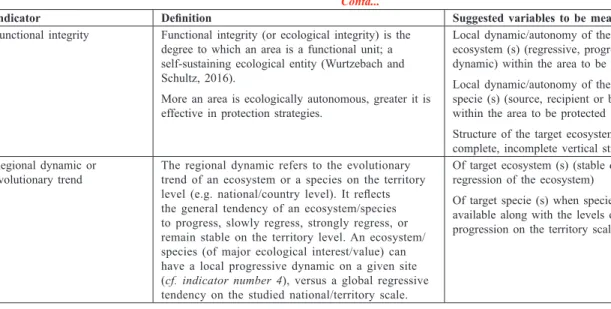
Table 2 Contd...
Indicator Definition Suggested variables to be measured
Functional integrity Functional integrity (or ecological integrity) is the degree to which an area is a functional unit; a self-sustaining ecological entity (Wurtzebach and Schultz, 2016).
More an area is ecologically autonomous, greater it is effective in protection strategies.
Local dynamic/autonomy of the target ecosystem (s) (regressive, progressive or stable dynamic) within the area to be protected Local dynamic/autonomy of the target
specie (s) (source, recipient or balanced population) within the area to be protected
Structure of the target ecosystem (s) (complete, nearly complete, incomplete vertical structure)
Regional dynamic or
evolutionary trend The regional dynamic refers to the evolutionary trend of an ecosystem or a species on the territory level (e.g. national/country level). It reflects the general tendency of an ecosystem/species to progress, slowly regress, strongly regress, or remain stable on the territory level. An ecosystem/ species (of major ecological interest/value) can have a local progressive dynamic on a given site (cf. indicator number 4), versus a global regressive tendency on the studied national/territory scale.
Of target ecosystem (s) (stable dynamic, progression or regression of the ecosystem)
Of target specie (s) when species inventories are available along with the levels of their regression/ progression on the territory scale
Table 3
Detailed description of suggested socioeconomic indicators
Indicator/ Definition Suggested measures
External human threats External threats are threats directly or indirectly caused by man. The impact of a threat mainly depends on the intensity of the latter as well as the vulnerability/ resilience of the exposed ecosystem. A threat can be partial and reversible, partial and irreversible or total and reversible, or finally total and irreversible.
An area prone to natural or human stress factors may need special protection, especially if it hosts a relatively high proportion of habitats, biotopes or sensitive species that are functionally fragile (highly susceptible to degradation or depletion by human activities or natural events) or with slow recovery rates.
Former (past) threat having ended on the site (the main threat in case there are many)
Actual threat taking place on the site (the main threat in case there are many)
Probable, predicted or planned threat (climate change; land-use planning: urbanization, road, construction, dam, quarry; area prone fire, erosion, floods, volcanoes…)
Site economic value (use
or non-use value) The economic valuation of ecosystem services is a tool for quantifying “benefits” provided by an ecosystem in monetary units most of the time. It is an important tool for the economic evaluation of biodiversity. It responds primarily to the wish and need to use the “economic language” for nature conservation and biodiversity to better integrate the environment into economic dynamics. Direct use values are the values of tangible benefits of effective use (hunting, grazing, timber, etc.). These direct use values reflect the direct consumption of resources and the direct interactions with the ecosystem. Non-use values represent the satisfaction of knowing that there is an ecosystem or species (patrimonial, emblematic, spiritual value, etc.).
Surface area of direct use value: supply and/or cultural interest (food, timber, grazing, water, recreation, etc., regardless of whether the service is commercial or non-commercial)
Surface area of emblematic and/or spiritual value (non-use value)
Financial and land-use/
property constraints No conservation initiative can be established unless financial means are made available for the implementation of this initiative, and land-use/property aspects are favorable to this implementation especially in Mediterranean countries. The property value of the land, the possibility of implementing a conservation project on the land, and the type of land (public, private, military), are key element determining the potential possibility of initiating a conservation action on a given site. Similarly, the availability and easiness of retrieving financial means to ensure the implementation of the protected area are crucial components for the success of the initiative.
Land use status or control pattern (possible, negotiable control on the property; high/low property value; impossible control over the property…) Financial means for the implementation of the protection initiative (possibility degree of getting international, national, local, or individual funds)
correlate with identified conservation priorities (Margules
and Pressey 2000; Pressey et al. 2002; Rodrigues et al. 2003;
El-Hajj et al. 2016).
Protected area data, in combination with habitat, species
and socioeconomic information, can provide a basis for
determining gaps in the extent of biodiversity protection,
and thereby inform decision-makers and stakeholders about
priorities for conservation action.
However, it is important to choose indicators that are
useful at the national/regional levels to provide the baseline
framework in which protected area designation can be framed.
By doing so, we can provide meaningful assessments of
whether or not biodiversity targets are met.
Inspired by a systematic literature review reconsidering
worldwide efforts for biodiversity and ecosystems conservation,
the set of suggested indicators in this paper can be further used
to develop a decision support tool that can serve practitioners
and decision-makers in Mediterranean environments to
objectively orient protected area designation. In this context,
El-Hajj et al. (in preparation) developed a decision support
tool (“MedConserve”) addressed to conservation planners
around the Mediterranean basin, aiming to support
decision-making processes related to protected area designation based
on a pertinent and scientific approach. This tool prioritizes and
reflects the impact of each and every socio-ecological aspect,
to different degrees, on the design of a protected area.
ACKNOWLEDGEMENTS
This paper is part of Mrs. El-Hajj’s PhD thesis funded by a grant from the National Council for Scientific Research - CNRS (Lebanon) and the CEDRE program (project number 13 E/L4). The authors would like to duly thank M. Julien Viglione from the French consulting company “EcoMed s.a.r.l.” for his guidance and contribution in the identification of indicators.
This is a LIA O-LiFE contribution number SA 16-2015.
REFERENCES
Abbitt, R.J.F., Scott, J.M. and Wilcove, D.S. 2000. The geography of vulnerability: incorporating species geography and human development
patterns into conservation planning. Biological Conservation 96: 169-175.
Agrawal, A. and Lemos, M. C. 2007. A greener revolution in the making? Environmental governance in the 21st century. Environment: Science
and Policy for Sustainable Development 49(5): 36-45.
Anderson, S. 2002. Identifying Important Plant Areas. Plantlife International, London.
Angermeier, P.L. and Karr, J.R. 1994. Biological integrity versus biological diversity as policy directives: protecting biotic resources. BioScience 44: 690-697.
Balmford, A. and Long, A. 1994. Avian endemism and forest loss. Nature 372: 623-624.
Bibby, C.J., Crosby, M.J., Heath, M.F., Johnson, T.H., Long, A.J., Stattersfield, A.J. et al.1992. Putting Biodiversity on the Map: Global Priorities for Conservation. Cambridge, International Council for Preservation of Birds.
Bierregaard, R.O., Jr., Laurance, W.F., Gascon, C., Benitez-Malvido, J., Fearnside, P.M., Fonseca, C.R., et al. 2001. Principles of forest fragmentation and conservation in the Amazon. In: Lessons from
Amazonia: The ecology and conservation of a fragmented forest (eds.
R. O. Bierregaard, Jr., C. Gascon, T. E. Lovejoy and R. C. G. Mesquita ), (Pp. 371-386). Yale University Press.
Bode, M. Wilson, K., Brooks, T. Turner, W., Mittermeier, R., McBride, M., Underwood, E. and Possingham, H. 2008. Cost-effective global conservation spending is robust to taxonomic group. Proceedings
of the National Academy of Sciences of the United States of America
105: 6498-6501.
Bonn, A., Rodrigues, A. and Gaston, K. 2002. Threatened and endemic species: are they good indicators of patterns of biodiversity on a national scale?
Ecology Letters 5: 733-741.
Bowker, M., Miller, M., Belnap, J., Sisk, T. and Johnson, N. 2008. Prioritizing Conservation Effort through the Use of Biological Soil Crusts as Ecosystem Function Indicators in an Arid Region. Conservation Biology 22(6): 1533-1543.
Brandon, K. 2002. Getting the basics right: key actions in designing effective parks. In: Lessons from Amazonia: The ecology and conservation of
a fragmented forest (eds. J. Terborgh, L. C. Davenport, and C. Van
Schaiks.), Pp. 443–466. Covelo, CA, Washington, DC: Island Press. Brandon, K., Gorenflo, L., Rodrigues, A. and Waller, R. 2005. Reconciling
Biodiversity Conservation, People, Protected Areas, and Agricultural Suitability in Mexico. World Development 33(9): 1403-1418. Brandon, K., Redford, K. and Sanderson, S. (Eds.). 1998. Parks in Peril:
People, politics, and protected areas (pp. 415-440). Covelo, CA,
Washington, DC: Island Press.
Bruner, A. G., Gullison, R. E., Rice, R. E. and Fonseca, G. A. B. 2001. Effectiveness of parks in protecting tropical biodiversity. Science
Table 3 Contd...
Indicator/ Definition Suggested measures
Legislation/level of national
legal engagement The presence and application of laws and regulations related to environmental protection and biodiversity conservation are key elements to the success of conservation initiatives. Legal enforcement enhances the establishment of new protected areas and sets a specific framework for their creation and management. The presence of legislations is crucial on the national level to improve conservation planning. However, the challenge remains in the application/respect level of these regulations. The more strict and penalized they are, the more conservation is efficient, and vice versa. The assessment of this aspect is essential to orient the type of conservation towards a strict or more or less flexible pattern.
Presence of national regulation related to the conservation of biodiversity and/or protected areas Presence of other specific regulations (water, rivers, coastline, forests, etc.) that can be applied to protect the site
Level of enforcement/compliance with existing regulations (strict and complete, partial, level of penalization…)
291:125-128.
Büscher, B. 2012. Payments for ecosystem services as neoliberal conservation: (reinterpreting) evidence from the Maloti-Drakensberg, South Africa.
Conservation and Society 10(1): 29.
Cairns, J. 1977. Quantification of biological integrity. Pp 171-187. In The
integrity of water. (eds. R.K. Ballentine and L.J. Guarraia) U.S.
Environmental Protection Agency, Office of Water and Hazardous Materials, Washington, DC.
Carey, C., Dudley, N. and Stolton, S. 2000. Squandering paradise? Gland, Switzerland: WWF International.
Castro, G. and Locker, I. 2000. Mapping Conservation Investments: An
Assessment of Biodiversity Funding in Latin America and the Caribbean.
Washington (DC): Biodiversity Support Program.
Chape, S., Blyth, S., Fish, L., Fox, P. and Spalding, M. 2003. United Nations
List of Protected Areas. IUCN, Gland, Switzerland and Cambridge, UK
and UNEP-WCMC, Cambridge, UK. Pp. 44 + 9 appendices. Chape, S., Harrison, J., Spalding, M. and Lysenko, I. 2005. Measuring the
extent and effectiveness of protected areas as an indicator for meeting global biodiversity targets. Philosophical Transactions of the Royal
Society of London 360:443-455.
Cioffi-Revilla, C. 2016. Socio-Ecological Systems. In Handbook of Science and Technology Convergence. (eds. Brainbridge, W.S and M.C Roco) Pp. 669-690. Switerland: Springer.
Cody, M.L. 1986. Diversity, rarity and conservation in Mediterranean-climate
regions. In Conservation Biology. The Science of Scarcity and Diversity. (ed. Souke M.E., ) Sinauer, Sunderland, M.A., Cody, M.L., Mooney
H.A. (1978). No. 574.5 C67. 1986.
Costanza, R., d’Arge, R., de Groot, R., Farber, S., Grasso, M., Hannon, B., Limburg, K., Naeem, S., O’Neill, R., Paruelo, J., Raskin, R., Sutton, P. and van den Belt, M. 1998. The value of the world’s ecosystem services and natural capital. Nature 387: 253-260.
Costello, M.J. 2009. Distinguishing marine habitat classification concepts for ecological data management. Marine Ecology Progress Series 397: 253-268.
Cowling, R. M., Pressey, R. L., Lombard, A. T., Desmet, P. G. and Ellis, A. G. 1999. From representation to persistence: requirements for a sustainable system of conservation areas in the species-rich Mediterranean-climate desert of southern Africa. Diversity and Distributions 5: 51-71. Cowling, R. M. and Pressey, R. L. 2003. Introduction to systematic
conservation planning in the Cape Floristic Region. Biological
Conservation 112: 1-13.
Cowling, R. M., Rundel, P. W., Lamont, B. B., Arroyo, M. K. and Arianoutsou, M. 1996. Plant diversity in Mediterranean-climate regions. Trends in
Ecology and Evolution 11(9): 362-366.
Cuttelod, A., García, N., Abdul Malak, D., Temple, H. and Katariya, V. 2008. The Mediterranean: a biodiversity hotspot under threat. In: The 2008
Review of The IUCN Red List of Threatened Species. (eds. J.-C. Vié,
C. Hilton-Taylor and S.N. Stuart ). Gland, Switzerland: IUCN. Daniels, R.J.R., Hedge, M., Joshi, N.V. and Gadgil, M. 1991. Assigning
conservation value: a case study from India. Conservation Biology 5: 464-475.
Dale, V. and Beyeler, S. 2001.Challenges in the development and use of ecological indicators. Ecological Indicators 1: 3-10.
Dallman, P. 1998. Plant life in the world’s Mediterranean climates: California,
Chile, South Africa, Australia, and the Mediterranean basin. University
of California Press. Pp. 257.
Davis, S., Heywood, V. and Hamilton, A. 1994-95.Centers of Plant Diversity.
A Guide and Strategy for their Conservation. IUCN⁄WWF, Cambridge:
IUCN/WWF.
Derous, S., Agardy, T., Hillewaert, H., Hostens, K., Jamieson, G., Mees, J., Moulaert, I., Olenin, S., Paelinckx, D., Rabaut, M., et al. 2007. A concept for biological valuation in the marine environment. Oceonologia 49: 99-128.
Di Castri, F. and Harold, M. 2012.Mediterranean type ecosystems: origin and
structure. Vol. 7. Springer Science & Business Media. 408pp.
Dobson, A.P., Rodriguez, J.P., Roberts, W.M. and Wilcove, D.S. 1997. Geographic distribution of endangered species in the United States.
Science 275: 550-553.
Drinkrow, D.R. and Cherry, M.I. 1995. Anuran distribution, diversity and conservation in South Africa, Lesotho and Swaziland. South African
Journal of Zoology 30: 82-90.
Dudley, N. (Ed.). 2012. Protected landscapes and wild biodiversity. Volume 3). IUCN. Pp. 105.
Dudley, N. (Ed.). 2008. Guidelines for Applying Protected Area Management
Categories. Gland, Switzerland: IUCN. Pp 86 + 10 appendixesEdwards,
C. J. and Regier, H. A. (eds). 1990. An Ecosystem Approach to the
Integrity of the Great Lakes in Turbulent Times. Special Publication
90-4, Great Lakes Fishery Commission, MI: Ann Arbor.
Eken, G., Bennun L., Brooks, T., Darwall, W., Fishpool, L., Foster, M., Knox, D., Langhammer, P., Matiku, P., Radford, E., Salaman, P., Sechrest, W., Smith, M., Spector, S. and Tordoff A. 2004. Key Biodiversity Areas as Site Conservation Targets. BioScience 54(12): 1110-1118.
El-Hajj, R., Khater, C., Vela, E. and Tatoni, T. 2016. Pertinence of protected areas networks in biodiversity conservation strategies: Insights from an eastern Mediterranean context. Ecologia Mediterranea 42(2): 5-19. Ellenberg, H. 1974. Zeigerwerte der Gefäßpflanzen Mitteleuropas. Scripta
Geobotanica 9: 1-97.
Eppink, F. and van den Bergh, J. 2007. Ecological theories and indicators in economic models of biodiversity loss and conservation: A critical review. Ecological economics 61: 284-293.
Ferraro, P. J. & Pressey, R. L. 2015. Measuring the difference made by conservation initiatives: protected areas and their environmental and social impacts. Philosophical Transactions of the Royal Society B 370(1681): 2014.0270.
Flournoy, P. H. 2003. Marine Protected Areas: Tools for Sustaining Ocean Ecosystems. Journal of International Wildlife Law and Policy 6(1-2): 137-142.
Folke, C. 2007. Social-ecological systems and adaptive governance of the commons. Ecological Research 22: 14-15.
Foster, M.N., Brooks, T.M., Cuttelod, A., De Silva, N., Fishpool, L.D.C., Radford, E.A. & Woodley, S. (2012). The identification of sites of biodiversity conservation significance, progress with the application of a global standard. Journal of Threatened Taxa, 4(8), 2733-2744. Freeman, M.A. 1993. The measurement of environmental and resource values:
theory and practice. Washington (DC): Resources for the Future.
Gaines, S. D., Lester, S. E., Grorud-Colvert, K., Costello, C. and Pollnac, R. 2010. Evolving science of marine reserves: new developments and emerging research frontiers. Proceedings of the National Academy of
Science of the United States of America 107:18251-18255.
Game, E. T., Grantham, H. S., Hobday, A. J., Pressey, R. L.et al. 2009. Pelagic protected areas: the missing dimension in ocean conservation. Trends
in Ecology and Evolution 24:360-369.
Gaston, K. J., Jackson, S. F., Cantú-Salazar, L.and Cruz-Piñón, G. 2008. The Ecological Performance of Protected Areas. Annual Review of Ecology,
Evolution, and Systematics 39: 93-113.
Gauthier, D. (Ed.). 1992. Canadian Council on Ecological Areas Framework
for Developing a Nation-wide System of Protected Areas. Part 1: A - Strategy. Ottawa, Canada: Canadian Council on Ecological Areas
Framework Task Force.
Gauthier, P., Debussche, M. and Thompson, J. D. 2010. Regional priority setting for rare species based on a method combining three criteria.
Biological Conservation 143: 1501-1509.
Gehlbach, F. R. 1975. Investigation, evaluation, and priority ranking of natural areas. Biological Conservation 8: 79-88.
Geldmann, J., Barnes, M., Coad, L., Craigie, I. D., Hockings, M. and Burgess, N. D. 2013. Effectiveness of terrestrial protected areas in reducing habitat loss and population declines. Biological Conservation 161: 230-238.