HAL Id: pasteur-01656598
https://hal-pasteur.archives-ouvertes.fr/pasteur-01656598
Submitted on 5 Dec 2017HAL is a multi-disciplinary open access
archive for the deposit and dissemination of sci-entific research documents, whether they are pub-lished or not. The documents may come from teaching and research institutions in France or abroad, or from public or private research centers.
L’archive ouverte pluridisciplinaire HAL, est destinée au dépôt et à la diffusion de documents scientifiques de niveau recherche, publiés ou non, émanant des établissements d’enseignement et de recherche français ou étrangers, des laboratoires publics ou privés.
Renaud Misslin, Olivier Telle, Eric Daudé, Alain Vaguet, Richard E Paul
To cite this version:
Renaud Misslin, Olivier Telle, Eric Daudé, Alain Vaguet, Richard E Paul. Urban climate versus global climate change – what makes the difference for dengue?. Annals of the New York Academy of Sciences, Wiley, 2016, 1382 (1), pp.56 - 72. �10.1111/nyas.13084�. �pasteur-01656598�
unedited manuscript
Urban climate versus global climate change – what makes the difference for dengue?
Journal: Annals of the New York Academy of Sciences Manuscript ID annals-1711-000.R1
Manuscript Type: Review Date Submitted by the Author: n/a
Complete List of Authors: Misslin, Renaud; Centre National de la Recherche Scientifique, UMR 6266 IDEES
Telle, Olivier; Centre National de la Recherche Scientifique, UMR 8504 Geographie-cités; Centre des Sciences Humaines, UMIFRE 20 CNRS-MAE Daudé, Eric; Centre des Sciences Humaines, UMIFRE 20 CNRS-MAE Vaguet, Alain; Centre National de la Recherche Scientifique, UMR 6266 IDEES
Paul, Richard; Institut Pasteur, Genomes and Genetics; Centre National de la Recherche Scientifique, URA 3012
Keywords: Dengue, Urban Heat Islands, Diurnal Temperature Range, Aedes mosquito
unedited manuscript
Urban climate versus global climate change – what makes the difference for dengue?
R. Misslin1*, O. Telle2,3*, E. Daudé2, A. Vaguet1 and R. E. Paul4,5
1
Centre National de la Recherche Scientifique, UMR 6266 IDEES, 7 rue Thomas Becket, 76821, Rouen, France.
2
Centre des Sciences Humaines, UMIFRE 20 CNRS-MAE, 2 APJ Abdul Kalam road, 110011, Delhi, Inde.
3
Centre National de la Recherche Scientifique, UMR 8504 Geographie-cités, Paris, France.
4Institut Pasteur, Unité de la Génétique Fonctionnelle des Maladies Infectieuses, 28 Rue du Dr.
Roux, 75724 Paris cedex 15, France.
5
Centre National de la Recherche Scientifique, Unité de Recherche Associée 3012, Paris, France.
* - contributed equally.
Corresponding author :
Richard E. Paul, Functional Genetics of Infectious Diseases Unit, Institut Pasteur, 25 Rue du Dr. Roux, 75724 Paris cedex 15, France. Email : [email protected]
Short title (50 characters incl. Spaces) Climate, dengue and urban heat islands
Keywords: Dengue; Aedes mosquito; Urban heat islands; Diurnal Temperature Range
2 3 4 5 6 7 8 9 10 11 12 13 14 15 16 17 18 19 20 21 22 23 24 25 26 27 28 29 30 31 32 33 34 35 36 37 38 39 40 41 42 43 44 45 46 47 48 49 50 51 52 53 54 55 56 57 58
unedited manuscript
Abstract
The expansion of the geographical distribution of vector-borne diseases is a much-emphasized consequence of climate change. As, if not more important for public health, are the consequences of urbanization for diseases that are already endemic. We focus on dengue, the most widespread urban vector-borne disease. Largely urban with a tropical/sub-tropical distribution and vectored by a domesticated mosquito, Aedes aegypti, dengue poses a serious public health threat. Temperature plays a determinant role in dengue epidemic potential, affecting crucial parts of the mosquito and viral life-cycles. The urban predilection of the mosquito species will further exacerbate the impact of global temperature change because of the Urban Heat Island effect. Even within a city, temperatures can vary by 10°C according to the urban land-uses, and diurnal temperature range (DTR) can be even greater. DTR has been shown to contribute significantly to dengue epidemic potential. Unravelling the importance of within city temperature is as important for dengue as for the negative health consequences of high temperatures that have hitherto focussed on pollution, heat stroke etc. Urban and landscape planning designed to mitigate the “non-infectious” negative effects of temperature should additionally focus on dengue that is currently spreading worldwide with no signs of respite. 2 3 4 5 6 7 8 9 10 11 12 13 14 15 16 17 18 19 20 21 22 23 24 25 26 27 28 29 30 31 32 33 34 35 36 37 38 39 40 41 42 43 44 45 46 47 48 49 50 51 52 53 54 55 56 57 58 59
unedited manuscript
Introduction
Global warming is predicted to generate an increase of 1-4°C in land surface temperature during this century and preliminary analyses suggest that the low income countries will bear the brunt of the predicted health impact.1,2 Socially disadvantaged individuals living in urban settings have been highlighted as a major group at risk from the adverse health consequences of climate change, which will exacerbate already existing urban health inequities.3,4 In addition to the negative consequences of extreme temperature events for non-infectious diseases that are particularly pertinent to the urban setting and which have received considerable attention,5-11 infectious diseases in an urban setting are also a cause for concern. Indeed, WHO estimates that one of the main consequences of global warming will be an increased burden of vector-borne diseases. Among these, dengue appears to be particularly problematic, most especially because of the urban and peri-urban habitat of the major mosquito vector of dengue.
Dengue is caused by any of four antigenically distinct dengue viruses, or serotypes, designated DENV-1, DENV-2, DENV-3, and DENV-4, which are transmitted by mosquito spp. of the Aedes genus. The most important mosquito vector of DENV is Aedes aegypti, which has adapted to a domestic niche and is thus posing a major public health problem because of uncontrolled, unplanned and “unhygienic” urbanization. Although the majority of DENV infections are subclinical, resulting in insufficient discomfort for clinical consultation,12 any of the 4 serotypes can cause dengue fever (DF), an acute viral infection characterized by fever, rash, headache, muscle and joint pain, and nausea, as well as more severe forms of the disease, dengue hemorrhagic fever (DHF)/dengue shock syndrome (DSS). Over the past decade, the number of dengue outbreaks has escalated and the population at risk is increasing yearly.13 More than 3.5 billion people are at risk of DENV infection in over 100 countries and recent estimates suggest that there are 390 million DENV infections every year, of which 100 million cause clinical symptoms.14 In South East Asia, the disease has been one of the major causes of hospitalisation among children since the 1990s.13
In 2012, WHO released their global strategy for dengue prevention and control, stating the objective of reducing dengue attributable mortality and morbidity by 50% and 25% respectively by 2020. 15 This reduction in morbidity is aimed to be achieved, at least in part, by implementing improved outbreak prediction and detection through coordinated epidemiological and entomological surveillance. Implicit in this action plan is an understanding of dengue epidemiology. However, under the rubric of dengue epidemiology,
2 3 4 5 6 7 8 9 10 11 12 13 14 15 16 17 18 19 20 21 22 23 24 25 26 27 28 29 30 31 32 33 34 35 36 37 38 39 40 41 42 43 44 45 46 47 48 49 50 51 52 53 54 55 56 57 58
unedited manuscript
information has until recently been restricted to reported cases and estimates of the countrywide incidence of disease and case fatality rates. Whilst this information is important, there is no expressed concerted view on how we expect morbidity/mortality rates to change in the face of climate change in the current day context of modern society with its increasing urban population. The prolific increase in the burden of dengue in recent years has been connected to societal changes such as urbanization and increased national and international transport that spread both the virus and the mosquito vector spp..16-19 In addition, rising temperatures and global climate change may also lead to the expansion of the range of major mosquito vectors into new areas, extension of the transmission season in areas with currently circulating dengue virus and increase in the mosquito spp. vectorial capacity (see below).20,21 As pointed out recently, both climate change and urbanization have contributed to the observed increase in dengue,22 but defining their relative contributions is crucial for the development and success of novel control methods. Mitigation of dengue risk factors associated with urbanization may be possible but will they make a difference? In this review, we address this question, propose future necessary avenues of research and underline the need to develop vector control strategies pertinent to modern day society.
Influence of temperature and rainfall on Aedes mosquito spp. vectorial capacity
Temperature and rainfall are two crucial variables that determine mosquito distribution, abundance and capacity to transmit the virus. Both these variables will be influenced by climate change and urbanization. The capacity to transmit the virus, known as the vectorial capacity, has been formulated into a quantitative framework within which key parameters are defined and from which estimates of the epidemiology of dengue can be made.23 The formula incorporates the mosquito components of the transmission system from the classical Ross-MacDonald equation of R0 for malaria, where R0, the basic reproductive number, is the total
number of secondary infections arising from a single infection in an otherwise susceptible population. The major difference (from the Ross-MacDonald equation) is that the duration of an infection in humans is no longer considered in the vectorial capacity and thus it estimates the daily number of secondary cases arising from a currently infective case in a fully susceptible human population. The vectorial capacity, C, is defined as follows:
= − µ µ bc e a m C n. . . . 2 2 3 4 5 6 7 8 9 10 11 12 13 14 15 16 17 18 19 20 21 22 23 24 25 26 27 28 29 30 31 32 33 34 35 36 37 38 39 40 41 42 43 44 45 46 47 48 49 50 51 52 53 54 55 56 57 58 59
unedited manuscript
Where m is the number of mosquitoes per person, a is the mosquito biting rate, µ the daily mosquito mortality rate, n is the Extrinsic Incubation Period (EIP), i.e. the number of days after ingestion within a bloodmeal, the virus needs to replicate and disseminate to the salivary glands, and b and c are respectively the two parameters of successful transmission from an infected mosquito to an uninfected human and from an infected human to a mosquito. Although the formula ignores the fine details, most especially of the variation underlying human-mosquito contact, and is thus clearly unrealistic to strictly describe actual epidemiological dynamics, it does provide a useful heuristic with which to understand the relative importance of the key parameters and the impact of temperature thereon. An on-line calculator provides an educational tool for understanding how small changes in each of the parameters results in changes in vectorial capacity and the subsequent R0 of dengue
(http://idshowcase.lshtm.ac.uk/id503/ID503/M3S1/ID503_M3S1_050_010.html).
The impact of temperature on all of these parameters has been studied extensively, particularly for Ae. aegypti. Implicit rather than explicit in the equation is the impact of temperature on larval mosquito development rate, which underlies the parameter m, the number of mosquitoes per human. Temperature is a determinant of mosquito population dynamics both directly via effects on insect physiology and behaviour, as well as indirectly through the biotic environment within which the larvae develop. The female mosquito’s reproductive cycle is affected by temperature. At < 20°C, fertilization decreases and oviposition behaviour alters, with oviposition site choice influenced by both temperature and sun exposure.24 The preferred breeding sites are small bodies of water that are more susceptible to large temperature fluctuations, especially those due to insolation. The extent to which female mosquitoes can gauge the temperature quality of a breeding site is not clear, but site-specific variation in choice of shaded vs. sun-exposed sites has been observed.25,26 Feeding behaviour is also influenced by temperature. Feeding activity is limited or ceases at temperatures < 15°C and can also be limited at temperatures > 36°C.24 Adult mosquitoes are highly sensitive to desiccation and in addition to behavioural avoidance of direct insolation, frequent feeding on blood seemingly offers an additional response to hydration. Higher temperatures have been associated with higher incidences of multiple blood feedings. Smaller females, which might be expected to be more susceptible to desiccation, also exhibited increased multiplicity of feeding.27 An alternative explanation to the biting rate - temperature relationship is that temperature affects egg developmental rates and thus higher biting rates might be a consequence of the higher rate of egg development and shorter gonotrophic cycle.
2 3 4 5 6 7 8 9 10 11 12 13 14 15 16 17 18 19 20 21 22 23 24 25 26 27 28 29 30 31 32 33 34 35 36 37 38 39 40 41 42 43 44 45 46 47 48 49 50 51 52 53 54 55 56 57 58
unedited manuscript
Ae. aegypti larval development rate increases with ambient (water) temperatures up to 34°C
and then decreases.28 In the absence of competition, predation and entomopathogenic infection, maximal survival (~90%) occurs at 27°C.28,29 Below 13°C, mosquito eggs will usually not hatch and any larva will not complete their development.24
Mosquitoes require water for breeding but the association of rainfall with mosquito bionomics is more complex. This is in part because of the adaptation of Ae. aegypti to a domesticated niche, where the mosquitoes use man-made breeding sites such as flower pots or Air Conditioning condensation, which confounds any increased availability of natural breeding sites created by rain.27,30 Therefore, the rainfall association is very dependent on the local extent of man-made breeding sites. More general non-linear effects of rainfall on mosquito density will also apply, such as larval wash-out and increased adult mortality following heavy rain and rainfall will have an indirect impact via its cooling effect on ambient temperature.
Aedes spp. that are not so domesticated, and even Ae. aegypti in some areas (e.g. Caribbean31) that use natural habitats, will be much more susceptible to the vagaries of large scale climate effects and local weather. Thus, the impact of rainfall will be likely very place dependent and in highly urban settings, it may have a more significant effect on mosquito vectorial capacity through its impact upon relative humidity and adult mosquito survival.
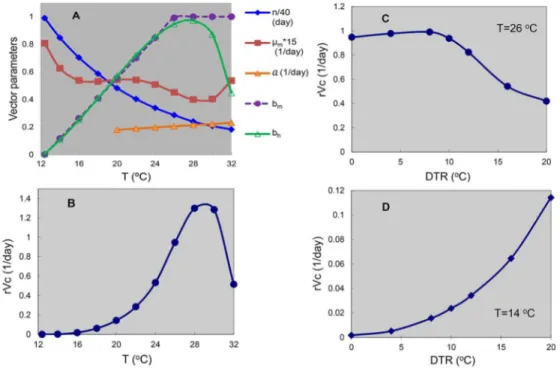
Temperature effects on biting rate are not only important for population dynamics, but, as can be seen in the Vectorial capacity formula (see C), impact directly dengue epidemiology. The squared power function associated with feeding rate “a” is because the female must bite twice (to be infected and then to pass the virus on) and makes any changes in feeding rate all the more influential on the number of secondary infections. The association between biting rate (a) and temperature (T) has been quantitatively estimated and the best fit found to be linear within a specified temperature range (21°C≤ T ≤ 32°C): 32
a (T) = 0.0043T + 0.0943 (per day)
Adult (female) survival rate is one of the most crucial factors determining vector-borne disease epidemiology in a specified setting and one which is particularly pertinent to dengue. The adult mosquito must live sufficiently long for the virus to be able to develop through its EIP and to be able to spread the virus through blood meals. Temperature has a highly significant impact both on mosquito survival per se and on the duration of the EIP. Adult mosquito survival is important because only mosquitoes that live beyond the EIP can act as potential vectors. The first blood meal is generally taken 3 days after emerging as an adult; therefore, assuming an EIP of 7–12 days,33 a minimum of 10–15 days is required for a newly
2 3 4 5 6 7 8 9 10 11 12 13 14 15 16 17 18 19 20 21 22 23 24 25 26 27 28 29 30 31 32 33 34 35 36 37 38 39 40 41 42 43 44 45 46 47 48 49 50 51 52 53 54 55 56 57 58 59
unedited manuscript
emerged mosquito to become infectious if its first blood meal was on an infected person. Mark–release–recapture studies have estimated that adult female daily survival rates are between 86% and 91%.34 Although these studies did not examine climatic influences on survivability, Christophers (1960)24 has provided evidence of increased mortality with exposure to prolonged extreme heat (> 40°C) and cold (< 0°C) in a laboratory setting.
Recently, Lambrechts et al.35 and Liu-Helmersson et al.32 have estimated the quantitative relationship between the parameters in the vectorial capacity formula and temperature using the wealth of published laboratory and field studies with the aim of addressing the recognized variation in temperature that mosquitoes encounter spatially and temporally.
An adequate quantitative relationship between temperature and EIP (here denoted n) was found to follow an exponential function between the temperature limits of 12°C and 36°C: n (T) = 4 + e5.15-0.123T
The association between mortality rate (µ) and temperature (T) from experimental studies within a specified temperature range (10.5°C≤ T ≤ 33.4°C) found that mortality rate ranged from 0.27% to 0.92% per day,36 with a maximum at temperatures <14°C and >32°C, and a minimum mortality rate at 27.6°C. The best fit equation was the following:
µ (T) = 0.8962 – 0.159T + 0.01116T2 – 3.408 x 10⁻⁴ T3 + 3.809 x 10⁻⁶ T4
This relationship may be further complicated by an apparent non-linear relationship between mortality rate and mosquito age: older females have lower rates than younger mosquitoes.37 In addition, species specific differences are thought to occur, with, for example, Ae. albopictus having generally higher survival but Ae. aegypti better tolerating a wider range of temperatures.38
Successful transmission rates from infected man to mosquito and vice versa are often considered as perfect, more for the sake of simplicity than based on experimental evidence. Whilst the biological basis underlying any effect of temperature on the transmission parameters is unclear, there does seem to be an effect of temperature on both parameters. From human to mosquito (bm is equivalent to parameter c in the VC equation):
° ≤ < ° ° ≤ ≤ ° − = C T C for C T C for T T bm 5 . 32 1 . 26 1 1 . 26 4 . 12 9037 . 0 0729 . 0 ) ( 2 3 4 5 6 7 8 9 10 11 12 13 14 15 16 17 18 19 20 21 22 23 24 25 26 27 28 29 30 31 32 33 34 35 36 37 38 39 40 41 42 43 44 45 46 47 48 49 50 51 52 53 54 55 56 57 58
unedited manuscript
From mosquito to human (for 12.9°C ≤ T ≤ 32.46°C):461 . 32 ) 286 . 12 ( 001044 . 0 ) (T = T× T− × bh
The combined effects of temperature on the mosquito parameters and the subsequent vectorial capacity can be seen in Figure 1. Having detailed the mechanistic impact of temperature and rainfall on dengue epidemiology via a quantitative framework, we now put this into the context of climate and urbanization.
Impact of climate on dengue
Climate variability is an important determinant of the incidence of a number of significant human and animal diseases with associated socio-economic impacts. This is particularly important for low-income countries, where the influence of climate variability on health is widely recognized;39-41 Africa and Asia bear the largest economic burden of disease in humans.42 Many diseases have climatic niches and their emergent and epidemic dynamics are influenced by variability in the climate.43,44 Many of the most important diseases affecting health are mosquito-borne, including notably malaria and dengue. Climate has a potentially large impact on the incidence of mosquito-borne diseases, directly via the developmental rates of both the mosquito and pathogen and mosquito survival and indirectly through changes in vegetation and land-surface characteristics, such as the availability of mosquito oviposition sites.
Many studies have found associations between climatic factors and dengue transmission.45-47 The importance of incriminating large scale climate variables is that it potentially provides an accessible early warning system. Several studies have addressed the lag time associations of temperature and precipitation with dengue incidence with highly variable results; it seems that there are different lag times depending also on the latitudinal position of the country.48 Dengue incidence characteristically follows seasonal patterns on an annual time-scale, but increases in intensity on a multi-annual scale. The underlying causes of these periodic epidemics are not understood, but are thought to arise through a combination of intrinsic and extrinsic drivers. The intrinsic factors include the host-virus interactions with disease being mediated through serotype-specific immunity. The extrinsic drivers include the large scale climate oscillations, notably El Niño, and local weather conditions.
El Niño has been found to be associated with an increase in annual numbers of dengue cases in the Pacific Islands, French Guiana, and Indonesia and monthly dengue hemorrhagic fever incidence in Bangkok but only from 1986 to 1992;49-52 in the latter study, in the absence of
2 3 4 5 6 7 8 9 10 11 12 13 14 15 16 17 18 19 20 21 22 23 24 25 26 27 28 29 30 31 32 33 34 35 36 37 38 39 40 41 42 43 44 45 46 47 48 49 50 51 52 53 54 55 56 57 58 59
unedited manuscript
the multi-annual effect of El Niño-Southern Oscillation (ENSO), the seasonality of dengue dynamics predominated.52 The precise mechanism by which El Niño can impact upon dengue dynamics is unknown, but is likely through its effect on local climate variables that influence the mosquito-human interaction; El Niño causes warming of surface temperatures. The fact that large-scale climate indices seem to better explain variation in large-scale (typically country-wide) dengue incidence is puzzling but has been noted before as a general ecological phenomenon; measures of local climate appear to fail to capture the complex associations between weather and ecological processes.53 Extension of large-scale regional climatic patterns to the urban micro-climate is vital, as it is at this scale that the mosquitoes and humans interact. Recent studies have clearly demonstrated the highly localised nature of dengue transmission.54-56 Micro-climatic conditions will impact upon mosquito bionomics and potentially have considerable consequences on mosquito vectorial capacity. In addition, observed complex environmental associations with dengue incidence may emerge from changes in human behaviour rather than mosquito biology. In Puerto Rico, ENSO was associated with temperature and not precipitation, whereas precipitation was associated with dengue incidence, albeit with a 7 months time lag.57 It has been suggested that alterations in precipitation alter water storage behaviour, which thus impact upon mosquito dynamics and human contact at a very local scale, uncouple mosquito bionomics from larval habitat dependence on rainfall.57,58 Such complex environmental associations underline how little we really understand their influence on the vectorial capacity of mosquitoes.
Urbanization and expansion of dengue
Urban human population sizes in tropical and sub-tropical countries have now reached unprecedented levels and much of this growth has occurred and is still in rapid progress in developing nations such as India.59 For example, urban densities are 30 000 inhabitants / km² in Mumbai (India), 24 000 in Kolkata (India), 20 000 in Lahore (Pakistan). The rapidity with which such urbanization and population growth has occurred is not without consequences; most particularly there is an amplifying infrastructure crisis with ever-increasing problems of environmental conditions. The health sector, the supply of running water, electricity and the availability of housing are all generally inadequate. Thirty-one % of the world's urban population live in slums, with figures reaching 70% in sub-Saharan Africa and 40% in Asia.60 The process of urbanization will increase further and the World Urbanization Prospects considers that by 2030 all population growth will be concentrated in urban areas, mostly in
2 3 4 5 6 7 8 9 10 11 12 13 14 15 16 17 18 19 20 21 22 23 24 25 26 27 28 29 30 31 32 33 34 35 36 37 38 39 40 41 42 43 44 45 46 47 48 49 50 51 52 53 54 55 56 57 58
unedited manuscript
the South.61 This population will be largely absorbed by the cities in the South generating particularly rapid population growth.
Urbanization results in significant modifications to the land surface structure, predominantly the replacement of natural vegetation by man-made surfaces.62 The consequence of this is to alter the urban climate and the most well-documented example of this is the creation of the urban heat island.63 Urban heat islands (UHIs) are metropolitan areas that are significantly warmer than their surrounding rural areas, because of human activities.64 Urban climate is influenced by many factors related to the intrinsic nature of a city. The composition and arrangement of natural and man-made surfaces, including impervious surfaces, vegetation areas and water bodies, as well as the local weather conditions influence near surface energy flux partitioning, resulting in variable local climates.65 Vegetation cover and composition, for example, have been shown to be important for explaining spatial differences in urban and suburban air temperatures.66 Land cover characteristics, such as vegetation indices measured by NDVI (normalized difference vegetation index), and the relative amounts of other land cover types (building area, impervious surface, water body, green spaces) significantly affect the urban temperature distribution patterns and UHI intensity.67 Many studies (reviewed in Arnfield)68 have confirmed predictions of Oke 198265 on the evolution of UHIs and especially in the context of local and larger scale climate events. Notably, UHI intensity decreases with increasing cloud cover, is greatest during anti-cyclonic conditions and in the summer or warm half of the year, increases with increasing city size and/or population and is greatest at night. Whilst generally considered at the city vs. neighbouring rural environment scale, even at small intra-urban scales, the effects of urban geometry, both with the shading effect in daytime and with the reducing radiation cooling and increasing thermal storage effect at night, can generate local scale differences in UHI intensity.69 Although UHI research has tended to focus on highly densely populated urbanizations, a 27 year study in Tokyo revealed that whilst there was a background warming trend reflecting global warming in low populated areas (<100 people per square kilometre), there was anomalous warming reflecting UHI even in weakly populated sites (100-300 / km2).70,71 UHI effects can thus occur even in low density urbanizations.
The public health impact of UHIs has been directly implicated in exacerbating the negative effects of extreme temperature conditions and in the context of air pollution,72,73 but neglected in the context of infectious diseases. Clearly for dengue, significant temperature modification can have a large impact on epidemic potential. Indeed, Araujo et al.74 have carried out one of
2 3 4 5 6 7 8 9 10 11 12 13 14 15 16 17 18 19 20 21 22 23 24 25 26 27 28 29 30 31 32 33 34 35 36 37 38 39 40 41 42 43 44 45 46 47 48 49 50 51 52 53 54 55 56 57 58 59
unedited manuscript
the few studies directly assessing the association between UHIs and dengue incidence. In Sao Paolo they observed that dengue incidence was high in low vegetation cover areas where the land surface temperature (LST) was around 29°C. Furthermore, more dengue cases clustered in areas of LST >32°C, than in areas characterized as low socioeconomic zones, high population density areas, or slum-like areas.74 Thus, temperature is seemingly the major risk factor in this study site, but may not necessarily be generally the case in other settings. In general, urbanization will be associated with increased local temperatures compared to neighbouring rural areas, with resulting impact on vectorial capacity and dengue epidemiology. However, crucially, the complexity of urban geometry will generate a mosaic of temperatures at very small scales with potential significance for dengue epidemiology as will be discussed next.
Intra-urban variation and the diurnal temperature range
Although urban areas are generally warmer than the surrounding suburban and rural areas, the temperature distribution is not a simple urban-rural gradient and at an intra-urban scale, there are large temperature differences.66,67 Scales of reference for urban geography can be defined as follows:75 the microscale, which is set by the dimensions of individual elements (e.g. buildings, trees, roads, streets, courtyards, gardens, etc., extending less than a hundred meters); the local scale, which includes climatic effects of landscape features, such as topography; the mesoscale, where the city itself influences the weather and climate at the scale of the whole city, typically tens of kilometres in extent. Urban areas with varied land cover often comprise a mosaic of warm and cold areas that vary significantly at the micro scale.76 Air temperatures at different points within the same urban area may differ significantly even in the same overall climatic context, and they can be affected by the thermal state of the adjacent surface cover, and by dispersion through turbulence and advection from the surroundings. A clear example of this occurs in the vicinity of urban green areas such as parks. These are generally cooler than their surrounding built-up areas, and can produce air temperature differences up to 7°C and the cooling effect of vegetation can extend into immediate local scale surrounding areas.77,78
In contrast to the global trend of increased mean temperatures brought about by urbanization, the diurnal temperature range (DTR) in cities has decreased (e.g. Delhi).79 Indeed, DTR is greater in the countryside than the city.68 This is because there have been asymmetric changes in the monthly mean minimum and maximum temperatures; minimum temperatures have risen at three times the rate of the increase in maximum temperature.80 One of the reasons for
2 3 4 5 6 7 8 9 10 11 12 13 14 15 16 17 18 19 20 21 22 23 24 25 26 27 28 29 30 31 32 33 34 35 36 37 38 39 40 41 42 43 44 45 46 47 48 49 50 51 52 53 54 55 56 57 58
unedited manuscript
this is the UHI effect. This also takes place from the release of human energy production, such as from vehicles and powering appliances (AC during summer, heaters during winter), into the environment. An increasing number of studies have shown this downward trend of the global and local DTR.63,79 Moreover, there is seasonality in increasing and decreasing temperature that is related both to urbanization and the seasonally predictable climatic factors. This has the end effect of introducing significant spatio-temporal heterogeneity in DTR within the same microscale area.81
Despite the fact that many studies focusing on the spatiotemporal distribution of dengue and/or its main vectors at the intra-urban scale have addressed the temporal impact of meteorological variables, only a few have taken into account the spatial heterogeneity of these variables. There are few studies (such as Araujo et al. 201574 for dengue or Hayden et al. 201082 and Reiskind et al. 201383 for Aedes spp.) that have highlighted the significant role of temperature variability. To our knowledge, no study has addressed the role of DTR on mosquito-virus interactions at the city scale. As this scale is the one at which transmission occurs and anti-vectorial interventions are implemented, intra-urban measurements of the relationships between dengue transmission and mosquito bionomics and fine-scale DTR may aid in guiding public health strategies.
Diurnal temperature range and vectorial capacity
Diurnal temperature range (DTR) has been shown to have significant effects on biology of both the mosquito and the virus and their interaction.35 DTR affects two important parameters underlying dengue virus transmission by Ae. aegypti. Mosquitoes are less susceptible to virus infection and die faster under larger DTR around the same mean temperature. Large DTR (20°C) decreases the probability of midgut infection, but not duration of the EIP, compared with moderate DTR (10°C) or constant temperature. A thermodynamic model predicted that at mean temperatures <18°C, 84 DENV transmission increases as DTR increases, whereas at mean temperatures >18°C, larger DTR reduces DENV transmission. The negative impact of DTR on Ae. aegypti survival indicates that large temperature fluctuations will reduce the probability of vector survival through the EIP and the duration of its infectious life. Seasonal variation in the amplitude of daily temperature fluctuations helps to explain seasonal forcing of DENV transmission at locations where average temperature does not vary seasonally and mosquito abundance is not associated with dengue incidence.35 Mosquitoes live longer and are more likely to become infected under moderate temperature fluctuations, which are typical of the high DENV transmission season, than under large temperature fluctuations, which are
2 3 4 5 6 7 8 9 10 11 12 13 14 15 16 17 18 19 20 21 22 23 24 25 26 27 28 29 30 31 32 33 34 35 36 37 38 39 40 41 42 43 44 45 46 47 48 49 50 51 52 53 54 55 56 57 58 59
unedited manuscript
characteristic of the low DENV transmission season. From that perspective, the influence of DTR could be decisive during the cold season, when mosquitoes would normally be unable to breed and sustain large populations. A particularly small DTR in this season might lead to larger mosquito populations than usual, potentially maintaining virus transmission at a higher rate than typically observed.
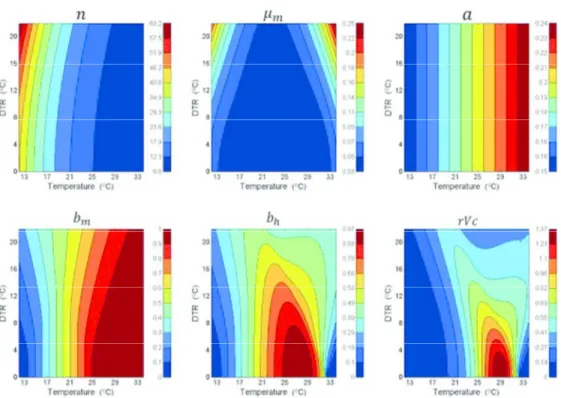
Liu-Helmersson et al.32 extended this work by considering the impact of DTR on the Dengue Epidemic Potential (DEP) as calculated through the relative Vectorial Capacity (that is the vectorial capacity relative to the vector-to-human population ratio). Using the relationships between temperature and the C formula equation as described, there was a strong temperature dependence of DEP, peaking at a mean temperature of 29.3°C when DTR was 0°C and at 20°C when DTR was 20°C. Increasing average temperatures up to 29°C led to an increased DEP, but temperatures above 29°C reduced DEP. In tropical areas, where the mean temperatures are close to 29°C, the impact of DTR was far less, but small DTR increased DEP while large DTR reduced it (Figure 2). DTR is clearly potentially significant for dengue epidemiology, but its estimated impact will vary according to the mean ambient temperature. Importantly, cooler sub-tropical and temperate regions will be predicted to be most affected by the epidemiological impact of DTR. However, given the strong association of the major mosquito vector with urbanization, any modulatory role of DTR under climate change needs to be considered within an urban context and specifically the microclimate generated by urbanization.
The environment and mosquito spp. community – an evolving dynamic
Numerous studies have addressed the effect of urbanization on mosquito population dynamics beyond the complex effects of temperature outlined above and have been dealt in detail by LaDeau et al. 2015.85 Briefly, as discussed in the context of vectorial capacity, many facets of the mosquito lifecycle (breeding, biting rate, survival…) can be influenced by the urban environment both directly (through micro and local scale topography and infra-structure impacting breeding sites, human-mosquito contact etc) and indirectly (through the thermal effects of UHIs).86 However, a major take-home message is that there can be considerable very local scale heterogeneity in the urban environment and one that can change at rapid temporal scales (e.g. seasonally). For example, larval habitat availability can be influenced by the local socio-economic status, where lack of a piped water network leads to water storage that contributes to the mosquito density and increasingly so during the dry season.87 However, because neighborhoods of widely differing socio-economic status can be closely located,
2 3 4 5 6 7 8 9 10 11 12 13 14 15 16 17 18 19 20 21 22 23 24 25 26 27 28 29 30 31 32 33 34 35 36 37 38 39 40 41 42 43 44 45 46 47 48 49 50 51 52 53 54 55 56 57 58
unedited manuscript
there can be spill-over consequences for dengue epidemic potential. A major lacuna is our understanding of the scale, which is pertinent to dengue epidemiology, at which we need to measure the influence of the abiotic environment on mosquito population dynamics. To make matters even more complex, urban environments evolve and mosquito spp. communities change over time. In particular and in light of the current global spread of Aedes albopictus, novel invading species will take time to establish themselves and thus likely display a very different relationship to their environment than stable, established populations. 88
The focus of the majority of studies on dengue mosquito vectors has been placed on Ae.
aegypti. However, in addition to Ae. aegypti, there are many other Aedes species that are
locally and increasingly globally important beyond the tropical and sub-tropical distribution of Ae. aegypti (approx. 35°N to 35°S).89 Indeed, more locally distributed Aedes spp., such as
Aedes polynesiensis, Aedes scutellaris and Aedes niveus, are responsible for dengue
transmission in tropical regions where Ae. aegypti is absent.90 Moreover, over the last few decades, a number of Aedes spp. have spread worldwide, generating potential transmission of DENV beyond the geographically and latitudinally restricted distribution of the above mentioned Aedes spp.91 These invasive species, notably Aedes albopictus and Aedes japonicus, are potential epidemiological threats beyond the sub-tropics, being competent for dengue transmission and able to persist in more temperate climates. The particularity of these two invasive species is the capacity to over-winter through the production of cold-resistant eggs. This has enabled Ae. albopictus to spread out from its East Asian habitat to invade the US and Europe and Ae. japonicus to spread out of its home range in Japan, Korea and SE China, invading the US in the 1990s and Europe in 2000s. 92-94 In addition, these species are not as domesticated as Ae. aegypti and thus represent a serious threat beyond the urban setting. Hence, uncontrolled, unplanned and “unhygienic” urbanization is not the only threat for the spread of dengue.
One notable feature of all these dengue mosquito vectors is their adaptive capacity to exploit artificial containers for breeding, thereby increasing mosquito densities in close proximity to man. This is particularly important for several species, such as Ae. polynesiensis, whose flight range (away from oviposition sites) is limited 100-200m.95 Whilst other species, such as Ae.
aegypti and Ae. japonicus, can fly further (800m), the relevance of this innate trait needs to be
put into context when considering an urban setting. Mosquitoes will potentially fly as far as necessary to oviposit and blood feed and their dispersal can be constrained by the urban landscape; this distance may be very short in urban settings, as they can find all their needs at
2 3 4 5 6 7 8 9 10 11 12 13 14 15 16 17 18 19 20 21 22 23 24 25 26 27 28 29 30 31 32 33 34 35 36 37 38 39 40 41 42 43 44 45 46 47 48 49 50 51 52 53 54 55 56 57 58 59
unedited manuscript
the same place (blood, breeding site and shade to rest).96 In conclusion, whilst the complexity of system seems overwhelming, there is need for an increased research focus on the extent to which such detail on the mosquito-urban relationship is required for an effective intervention.
The case of Delhi, India
Delhi is situated in the subtropics (28°36′36″N; 77°13′48″E) and has a population of about 16 million. It has a monsoon-influenced subtropical climate with a cool winter (average temperatures 12°C, range 7-21°C) from November to January, a warm summer (average temperatures 32°C, range 28-41°C) from April to June and a monsoon season from July-September. The population of Delhi as a whole grew by 46.3% from 1991 to 2001 and 20.96% during 2001-2011 to establish at more than 16 million in the metropolitan area in 2011.79,97,98 Sprawling urban expansion in Delhi has led to extension beyond the National Capital Territory of Delhi to incorporate towns in neighbouring states. This area covers 2000 km2 and a population of 25 million, making it the 3rd-largest urban area in the world.99 As well as such rapid population growth, mostly because of migration, there has also been an increase in environmental diversity in the Indian capital. Major transformations in the LUC (built-up area surpassed more than 53% of the total surface area) are radically altering the microclimate. Human population densities are also highly heterogeneous: in South Delhi (a mostly high-income area) densities are around 2,000 inhabitants/km², while densities in Old Delhi (mainly low income areas, heart of the city) are reaching 38,000 inhabitants/km². This heterogeneity is also represented in water access; in the face of intermittent and unpredictable water availability, households from different socio-economic levels implement different strategies. High incomes households use strategies that represent a lower level of risk regarding vectors (pumping underground water for example), while low income household with no access to water networks have to stock water in house,100 a strategy which constitutes an opportunity for the mosquito vector of DENV to reproduce.
Dengue is strongly seasonal in Delhi and clearly associated with the increased temperatures and rainfall in monsoon season. Delhi has recorded dengue cases every year since 1996. Prior to that, cases of dengue were recorded but did not reach epidemic proportions,101-103 although diagnostic methods were only based on clinical diagnosis. In 1996, there was an epidemic of unprecedented proportions with over 10,000 cases and a 4.1% mortality rate.104 Since 2003, all four viral serotypes have been periodically co-circulating.105,106 Thus the epidemiology of dengue has evolved from epidemic to endemic and exemplifies the growing threat that dengue poses for an increasingly large number of people worldwide living in conditions suitable for
2 3 4 5 6 7 8 9 10 11 12 13 14 15 16 17 18 19 20 21 22 23 24 25 26 27 28 29 30 31 32 33 34 35 36 37 38 39 40 41 42 43 44 45 46 47 48 49 50 51 52 53 54 55 56 57 58
unedited manuscript
dengue transmission. In the decade between 2001 and 2015, four dengue epidemics (>2000 registered cases in the surveillance system) were reported (2003, 2006, 2010, 2013 and 2015). The number of cases ranged from 2,800 in 2003 to over 15,867 (and counting) in 2015, as reported by the surveillance system (http://nvbdcp.gov.in/den-cd.html), which likely underestimates the amplitude of the dengue burden.107
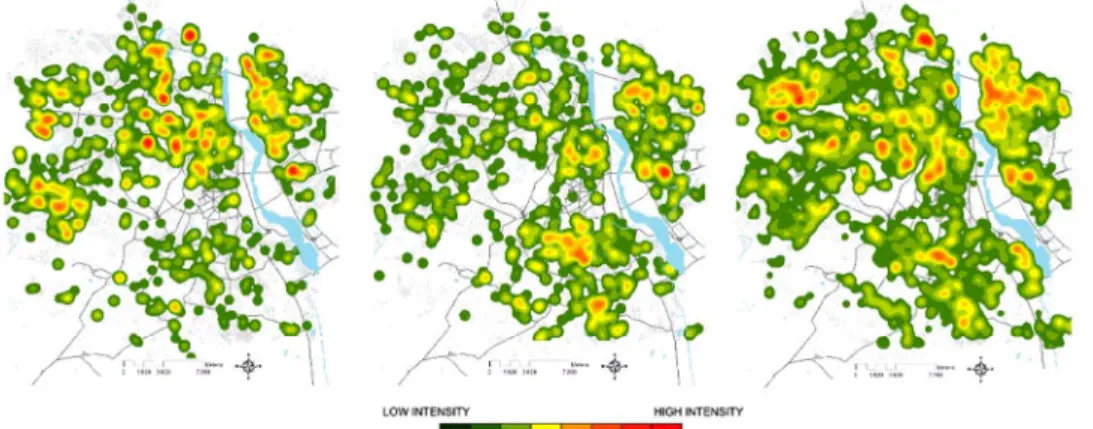
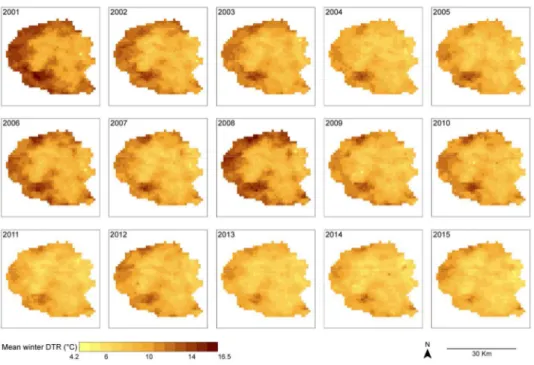
We previously developed a Geographical Information System for Delhi, enabling land-use and socio-economic characterization of the urban environment. Dengue cases identified in the Delhi surveillance system from 2008 to 2010 were collated, geolocalised and embedded as layers to be analyzed via geostatistic tools.56 Overall, there was high heterogeneity in incidence rates across areas with the same socio-economical profiles and substantial inter-annual variability. However, in the sub-epidemic years (1000-2000 cases reported), 2008 and 2009, dengue incidence was clustered in East and Central Delhi (Figure 3A). 2010 witnessed a large epidemic that covered the city with little clear demarcation of high incidence sites.56 Over the decade from 2001-2011, night time temperatures have generally increased, but notably, as seen generally,80 there is an asymmetric increase leading to large increases in the minimum intra-urban temperatures and relatively small increases in maximum temperatures. Simultaneous intra-urban temperatures varied by as much as 17°C in 2001 and 13°C in 2011 (Figure 3B). Thus, intensive urbanization has led to a slow trend towards homogenization of mean temperatures. There has been a decreasing trend in winter DTR across the urban part of Delhi from an average of 11.83°C in 2001 to 8.58°C in the year 2015 (Figure 3C). The increased level of urbanization in this decade resulted in a net increase in the surface area with winter DTR < 11°C from 32.5% of total area in 2001 to 87.8% in 2015. Mean temperatures are largely inverse to the DTR, with smallest DTR in the Eastern and Central areas; these areas are notably those with the highest night time temperatures (Figure 3B). Furthermore, these areas match the impoverished areas of Delhi. The Southern area, which is the richest part of the city, seems to be an exception with medium night time temperatures and intermediate DTR. Comparing the dengue case distribution with the temperature maps does suggest some overlap, at least for the sub-epidemic years of 2008 and 2009. Indeed, the repetitive pattern in 2008 and 2009, when the extent of the dengue epidemic was relatively confined, might suggest that local temperature and DTR, which was particularly high in the winter of 2008, may be important when conditions are less than optimal for dengue transmission across all Delhi. Then during the large epidemic of 2010, when cases were spread more homogeneously across Delhi, as has been observed in other megapolises such as
2 3 4 5 6 7 8 9 10 11 12 13 14 15 16 17 18 19 20 21 22 23 24 25 26 27 28 29 30 31 32 33 34 35 36 37 38 39 40 41 42 43 44 45 46 47 48 49 50 51 52 53 54 55 56 57 58 59
unedited manuscript
Sao Paolo, the epidemic, once underway, was impossible to contain.108 Whilst such broad level correlations of temperature, DTR and dengue case incidence can not provide conclusive evidence of causation, the figures nevertheless show the significant extent to which there are fine spatial scale heterogeneities in climatic parameters that can impact upon dengue epidemic potential (Figures 3A-C).
As discussed above, one critical feature affecting fine-scale thermal dynamics are green areas. Whilst hitherto considered to bring thermal relief,78 they can also provide a refuge for mosquitoes.82 The dengue outbreak in Tokyo in 2014 was attributable to local transmission by
Ae. albopictus in several parks in Tokyo, likely following introduction from outside of
Japan.109 Ae. albopictus proliferates in forested areas and is less domesticated than Ae.
aegypti. Within Delhi there was also a significant increased risk of dengue with proximity to
the forested area that transects central Delhi.56 It is thus likely that green areas provide thermal relief to mosquitoes, buffering extreme day time temperatures that would decrease mosquito survival. Such green areas are largely associated with areas of higher socio-economic status. Thus, green areas might increase mosquito survival and hence impact upon the vectorial capacity despite the reduction in mosquito density because of superior environmental hygiene in areas of higher socio-economic status.
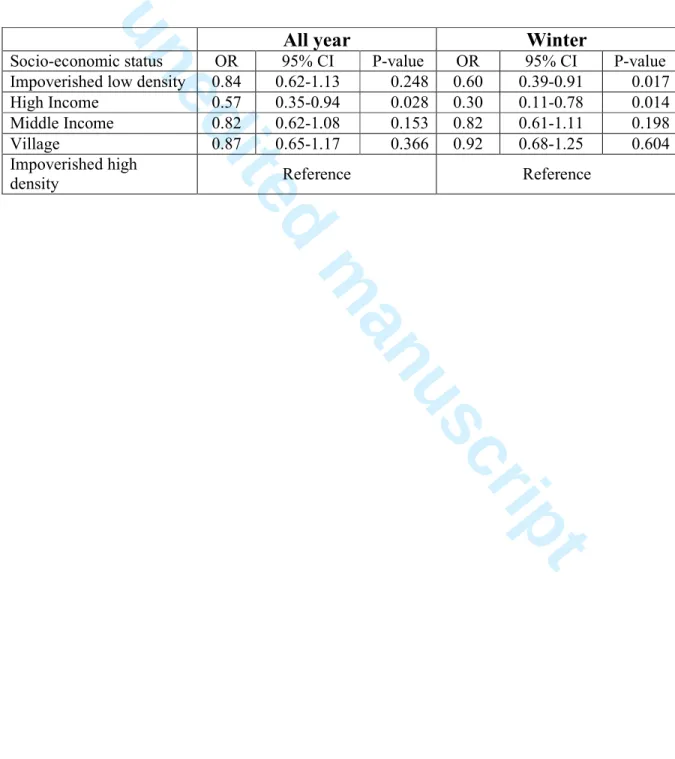
Solid waste (e.g. Wash basins, tires, cement pots, plastics etc) is a recognised preferred breeding site for Ae. aegypti and environmental hygiene has long been promoted to reduce mosquito densities. In Delhi, we found that during the transmission season, solid waste was indeed the preferred mosquito breeding site and was most prevalent in low income areas.110 However, mosquitoes also breed in overhead tanks (OHTs) and other permanent water storage structures. OHTs were most prevalent in high income areas and thus significant mosquito populations can be maintained despite good environmental hygiene. This is to some extent reflected in mosquito larvae occurrence in houses (presence/absence – the House Index). We sampled 18 colonies (Delhi administrative units of area) of differing socio-economic status, from impoverished areas to high income ones. We sampled these colonies once a month during a year (June 2013-May 2014), covering a total of 14,681 houses and 25,643 potential breeding containers, including plastics containers of all sizes to OHTs, as mentioned above. Houses of high income colonies had significantly lower odds of occurrence of larvae than houses in areas of densely populated low socio-economic status (Table 1). However, the difference was small and was only marked between these two socio-economic extremes. Plastics (drums, tubs etc) are the dominant mosquito breeding site in low socio-economic sites
2 3 4 5 6 7 8 9 10 11 12 13 14 15 16 17 18 19 20 21 22 23 24 25 26 27 28 29 30 31 32 33 34 35 36 37 38 39 40 41 42 43 44 45 46 47 48 49 50 51 52 53 54 55 56 57 58
unedited manuscript
whereas OHTs are so in high income sites.110 Increased water storage coupled poorer environmental hygiene may thus contribute to this difference between sites, but the difference was only small. Interestingly, however, during the winter, a time when normally temperatures are too low to sustain adult mosquito activity, the probability of observing mosquito larvae in houses of lower socio-economic status was much higher than for others categories. The significantly higher temperatures in these densely populated areas may therefore become increasingly important during the cold periods for maintaining mosquito populations and potentially even dengue transmission. This does suggest that there is a significant impact of intra-urban temperature differences, but that the effects for the mosquito population and dengue may only be significant when global temperatures are no longer sufficient (i.e. when climate temperatures are too cold during winter). Highly populated areas, such as slums, with small homes and consumption of bio-energy (such as wood) for cooking or heating can explain these higher temperatures. Source reduction (larval removal) operated in these literal hotspots during winter could enable reduction of the diffusion of dengue virus at city scale when meteorological conditions subsequently become favorable. In Brazil, Mondini et al.108 demonstrated the re-introduction of dengue virus at the beginning of epidemics from impoverished spaces of Rio, suggesting that the virus is maintained in these areas that offer environmental conditions permitting its survival. By contrast, mosquito vectorial capacity, during the warm season, may be affected more by maximum temperatures rather than temperature differences and green areas may afford thermal respite. Seasonal differences in the impact of green areas on dengue have been previously noted; there was a negative correlation between NDVI and dengue incidence but only in the dry season.111
In summary, Delhi urban areas, with their differentiated UHI and DTR, represent a very good example of the complexity of dengue epidemiology in modern society. The spread of dengue is the result of a complex process, however, and whilst DTR and UHI could help understand the distribution of dengue cases, they cannot be considered as unique factors. The mosaic of fine-scale urban geometry will impact upon key parameters underlying the vectorial capacity of Ae. aegypti and dengue epidemic potential, potentially resulting in very heterogeneous dengue epidemiology.
Concluding remarks
Geographic expansion of epidemic dengue from South East Asia in the late 20th century saw regions in the Pacific and Americas escalate from being non-endemic with no dengue serotypes circulating, to having episodic epidemics to becoming endemic for dengue.112,113
2 3 4 5 6 7 8 9 10 11 12 13 14 15 16 17 18 19 20 21 22 23 24 25 26 27 28 29 30 31 32 33 34 35 36 37 38 39 40 41 42 43 44 45 46 47 48 49 50 51 52 53 54 55 56 57 58 59
unedited manuscript
Very recently, the importation of virus into hitherto dengue-free areas and subsequent autochthonous (local man-mosquito-man) transmission, likely through sub-clinically infected individuals, is becoming increasingly frequent. Autochthonous dengue transmission has occurred twice in France in the last 5 years,114,115 a major epidemic occurred in Madeira in 2012 116 and has also been reported intermittently over the past decade in Texas, Hawaii, and Florida.117,118 The increasing biomass of virus globally is thus generating an endless reservoir enabling repeated incursion of virus into naïve areas and thwarting the implantation of DENV will become increasingly difficult. This is likely to be exacerbated by climate warming and increased urbanization that in addition to the discussed effects on dengue epidemiology is also characterized by a larger and denser human population at risk of exposure.
In light of the clear, recognised significance of climate, and most especially temperature, on dengue, increased effort needs to be focussed on how to mitigate against explosive dengue epidemics. This should be achieved through improved urban management beyond the current procedure of (mosquito larvae) source reduction and removal of potential mosquito breeding sites. Although effective decades ago, this procedure is no longer workable today, following the massive urban growth that has changed the nature of cities and which would require an excessive work force that is no longer economically sustainable in most settings. Complex urban thermal dynamics contribute to dengue epidemiology, but which will vary from place to place and thus require careful site-specific characterization. More research is needed at different scales to generate a better understanding of the actual thermal impact on mosquito dynamics and dengue epidemiology. In this way it may be possible to improve our approach to monitoring of and intervention against dengue epidemics in the world today. Thus, despite recognition of the impact of global climate change on vector-borne diseases, the urban setting generates its own micro-climate. Urban vector-borne diseases should therefore be considered as special cases and receive appropriate attention.
Acknowledgements
We thank Dr. Nagpal of the National Institute of Malaria Research and Dr. Yadav of the Municipal Corporation of Delhi, Delhi, India for their collaborative support. Funding: Agence Nationale de la Recherche, France (ANR 10- CEPL-004- AEDESS) and the research leading to these results has received funding from the European Commission Seventh Framework Programme [FP7/2007-2013] for the DENFREE project under Grant Agreement n°282 378. The funding source had no role in study design, data collection, data analysis, data interpretation, or writing of the manuscript. The corresponding authors had full access to all the data in the study and had final responsibility for the decision to submit for publication.
2 3 4 5 6 7 8 9 10 11 12 13 14 15 16 17 18 19 20 21 22 23 24 25 26 27 28 29 30 31 32 33 34 35 36 37 38 39 40 41 42 43 44 45 46 47 48 49 50 51 52 53 54 55 56 57 58
unedited manuscript
References
1. Parry, M., N. Arnell, P. Berry, et al. 2009. Assessing the Costs of Adaptation to Climate Change: a Review of the UNFCCC and Other Recent Estimates. London, UK: International Institute for Environment and Development and Grantham Institute for Climate Change.
2. Friel, S., M. Marmot, A. McMichael, et al. 2008. Global health equity and climate stabilisation - need for a common agenda. Lancet 372: 1677–1683.
3. Global Research Network on Urban Health Equity (GRNUHE). 2010. Improving urban health equity through action on the social and environmental determinants of health: final report of The Rockefeller Foundation Global Research Network on Urban Health Equity. London, UK: University College London and the Rockefeller Foundation.
4. Friel, S., T. Hancock, T. Kjellstrom, et al. 2011. Urban Health Inequities and the Added Pressure of Climate Change: An Action-Oriented Research Agenda. Journal of
Urban Health: Bulletin of the New York Academy of Medicine 88: 886-895.
5. Luterbacher, J., D. Dietrich, E. Xoplaki, et al. 2004. European seasonal and annual temperature variability, trends, and extremes since 1500. Science 303: 1499–1503. 6. Barriopedro, D., E.M. Fischer, J. Luterbacher, et al. 2011. The hot summer of 2010:
Redrawing the temperature record map of Europe. Science 332: 220–224.
7. Ballester, J., J.-M. Robine, F.R. Herrmann, et al. 2011. Long-term projections and acclimatization scenarios of temperature-related mortality in Europe. Nat. Commun. 2: 358.
8. Semenza, J.C., C.H. Rubin, K.H. Falter, et al. 1996. Heat-related deaths during the July 1995 heat wave in Chicago. N. Engl. J. Med. 335: 84–90.
9. Kaiser, R., C.H. Rubin, A.K. Henderson, et al. 2001. Heat-related death and mental illness during the 1999 Cincinnati heat wave. Am. J. Forensic Med. Pathol. 22: 303– 307.
10. Robine, J.-M., S.L.K. Cheung, S. le Roy, et al. 2008 Death toll exceeded 70,000 in Europe during the summer of 2003. C. R. Biol. 331: 171–178.
11. Ostro, B.D., L.A. Roth, R.S. Green, et al. 2009. Estimating the mortality effect of the July 2006 California heat wave. Environ. Res. 109: 614–619.
2 3 4 5 6 7 8 9 10 11 12 13 14 15 16 17 18 19 20 21 22 23 24 25 26 27 28 29 30 31 32 33 34 35 36 37 38 39 40 41 42 43 44 45 46 47 48 49 50 51 52 53 54 55 56 57 58 59
unedited manuscript
12. Grange L., E. Simon-Loriere, A. Sakuntabhai, et al. 2014. Epidemiological risk factors associated with high global frequency of inapparent dengue virus infections. Frontiers
in Immunology 5:280.
13. WHO 2012, Dengue and Dengue Hemorrhagic Fever, Fact Sheet 117, revised February 2015. Geneva, World Health Organization (also available at:
http://www.who.int/mediacentre/ factsheets/fs117/en/; accessed October 2015). 14. Bhatt S., P. Gething, O. Brady, et al. 2013. The global distribution and burden of
dengue. Nature 496: 504-507.
15. WHO. 2012. Global strategy for dengue prevention and control 2012-2020.
http://www.who.int/immunization/sage/meetings/2013/april/5_Dengue_SAGE_Apr20 13_Global_Strategy.pdf. Accessed October 2015.
16. Guzman, M.G. & G. Kouri. 2002. Dengue: an update. Lancet Infect. Dis. 2:33–42. 17. Gubler, D.J. 2002. Epidemic dengue/dengue hemorrhagic fever as a public health,
social and economic problem in the 21st century. Trends Microbiol. 10: 100–103. 18. Chen, L.H. & M.E. Wilson. 2008. The role of the traveler in emerging infections and
magnitude of travel. Med. Clin. N. Am. 92: 1409-1432.
19. Gubler, D.J. 2012. The economic burden of dengue. Am. J. Trop. Med. Hyg. 86: 743– 744.
20. Patz, J. A. & W. K. Reisen. 2001. Immunology, climate change and vector-borne diseases. Trends Immunol. 22: 171–172.
21. Hales, S., N. de Wet, J. Maindonald, et al. 2002. Potential effect of population and climate changes on global distribution of dengue fever: an empirical model. Lancet
360: 830–834.
22. Struchiner, C.J., J. Rocklöv, A. Wilder-Smith, et al. 2015. Increasing Dengue Incidence in Singapore over the Past 40 Years: Population Growth, Climate and Mobility. PLoS ONE 10(8): e0136286.
23. Garrett-Jones, C. 1964. Prognosis for Interruption of Malaria Transmission through Assessment of the Mosquito’s Vectorial Capacity. Nature 204: 1173–1175.
24. Christophers, S. 1960. Aedes aegypti. The yellow fever mosquito. Its life history, bionomics and structure. Camb. Univ. Press Lond. 738 pp.
25. Barrera, R., M. Amador & G.G. Clark. 2006. Ecological factors influencing Aedes aegypti (Diptera: Culicidae) productivity in artificial containers in Salinas, Puerto Rico.
J. Med. Entomol. 43: 484–492. 2 3 4 5 6 7 8 9 10 11 12 13 14 15 16 17 18 19 20 21 22 23 24 25 26 27 28 29 30 31 32 33 34 35 36 37 38 39 40 41 42 43 44 45 46 47 48 49 50 51 52 53 54 55 56 57 58
unedited manuscript
26. Wong, J., S.T. Stoddard, H. Astete, et al. 2011. Oviposition site selection by the dengue vector Aedes aegypti and its implications for dengue control. PLoS Negl. Trop.
Dis. 5: e1015.
27. Scott, T.W., P.H. Amerasinghe, A.C. Morrison, et al. 2000. Longitudinal studies of Aedes aegypti (Diptera: Culicidae) in Thailand and Puerto Rico: blood feeding frequency. J. Med. Entomol. 37: 89–101.
28. Rueda, L.M., K.J. Patel, R.C. Axtell, et al. 1990. Temperature dependent development and survival rates of Culex quinquefasciatus and Aedes aegypti (Diptera, Culicidae). J.
Med. Entomol. 27:892–898.
29. Tun-Lin, W., T.R. Burkot & B.H. Kay. 2000. Effects of temperature and larval diet on development rates and survival of the dengue vector Aedes aegypti in north Queensland, Australia. Med. Vet. Entomol. 14: 31–37.
30. Padmanabha, H., E. Soto, M. Mosquera, et al. 2010. Ecological links between water storage behaviors and Aedes aegypti production: implications for dengue vector control in variable climates. Ecohealth 7: 78–90.
31. Chadee, D.D., R.A. Ward & R.J. Novak. 1998. Natural habitats of Aedes Aegypti in the Caribbean--a review. J. Am. Mosq. Control Assoc. 14: 5-11.
32. Liu-Helmersson, J., H. Stenlund, A. Wilder-Smith, et al. 2014. Vectorial capacity of Aedes aegypti: effects of temperature and implications for global dengue epidemic potential. PLoS One 9: e89783.
33. Watts, D., D. Burke, B. Harrison, et al. 1987. Effect of temperature on the vector efficiency of Aedes aegypti for dengue 2 virus. Am. J. Trop. Med. Hyg. 36: 143–152. 34. Muir, L.E. & B.H. Kay. 1998. Aedes aegypti survival and dispersal estimated by
mark-release-recapture in northern Australia. Am. J. Trop. Med. Hyg. 58: 277–282. 35. Lambrechts, L., K.P. Paaijmans, T. Fansiri, et al. 2011. Impact of daily temperature
fluctuations on dengue virus transmission by Aedes aegypti. Proc. Natl. Acad. Sci.
USA 108: 7460–7465.
36. Yang, H.M., M.L. Macoris, K.C. Galvani, et al. 2009. Assessing the effects of temperature on the population of Aedes aegypti, the vector of dengue. Epidemiol.
Infect. 137: 1188–1202.
37. Harrington, L.C., J.P. Buonaccorsi, J.D. Edman, et al. 2001. Analysis of survival of young and old Aedes aegypti (Diptera: Culicidae) from Puerto Rico and Thailand. J.
Med. Entomol. 38: 537-547. 2 3 4 5 6 7 8 9 10 11 12 13 14 15 16 17 18 19 20 21 22 23 24 25 26 27 28 29 30 31 32 33 34 35 36 37 38 39 40 41 42 43 44 45 46 47 48 49 50 51 52 53 54 55 56 57 58 59
unedited manuscript
38. Brady, O.J., M.A. Johansson, C.A. Guerra, et al. 2013. Modelling adult Aedes aegypti and Aedes albopictus survival at different temperatures in laboratory and field settings.
Parasite Vectors 6: 351.
39. Bouma, M.J., H.E. Sondorp & H.J. van der Kaay. 1994. Health and climate change.
Lancet 343: 302.
40. Cash, B. A., X. Rodó & J. L. Kinter. 2009. Links between tropical Pacific SST and cholera incidence in Bangladesh: role of the western tropical and central extratropical Pacific. Journal of Climate 22: 1641-1660.
41. Confalonieri, U., B. Menne, R. Akhtar, et al. 2007: Human health. Climate Change 2007: Impacts, Adaptation and Vulnerability. Contribution of Working Group II to the Fourth Assessment Report of the Intergovernmental Panel on Climate Change, M.L. Parry, O.F. Canziani, J.P. Palutikof, P.J. van der Linden and C.E. Hanson, Eds., Cambridge University Press, Cambridge, UK, 391-431.
42. Sachs, J. & P. Malaney. 2002. The economic and social burden of malaria. Nature
415: 680-685.
43. Linthicum, K.J., A. Anyamba, C.J. Tucker, et al. 1999. Climate and satellite indicators to forecast Rift Valley fever epidemics in Kenya. Science 285: 397-400.
44. Bicout, D.J. & P. Sabatier. 2004. Mapping Rift Valley Fever vectors and prevalence using rainfall variations. Vector-Borne Zoonotic Dis. 4: 33-42.
45. Thai, K.T., & K.L. Anders. 2011. The role of climate variability and change in the transmission dynamics and geographic distribution of dengue. Exp. Biol. Med. 236: 944–954.
46. Morin, C.W., A.C. Comrie & K.C. Ernst. 2013. Climate and dengue transmission: evidence and implications. Environ. Health Perspect. 121: 1264–1272.
47. Naish, S., P. Dale, J.S. Mackenzie, et al. 2014. Climate change and dengue: a critical and systematic review of quantitative modelling approaches. BMC Infect. Dis. 14: 167. 48. Lowe, R., B. Cazelles, R. Paul, et al. 2015. Quantifying the added value of interannual climate variability in a spatio-temporal dengue model. Stochastic Environmental
Research and Risk Assessment doi: 10.1007/s00477-015-1053-1.
49. Hales, S., P. Weinstein, Y. Souares Y, et al. 1999. El Niño and the dynamics of vectorborne disease transmission. Environ. Health Perspect. 107: 99-102.
50. Gagnon, A.S., A.B. Bush & K.E. Smoyer-Tomic. 2001. Dengue epidemics and the El Niño Southern Oscillation. Clim. Res. 19: 35-43.
2 3 4 5 6 7 8 9 10 11 12 13 14 15 16 17 18 19 20 21 22 23 24 25 26 27 28 29 30 31 32 33 34 35 36 37 38 39 40 41 42 43 44 45 46 47 48 49 50 51 52 53 54 55 56 57 58