HAL Id: cea-02538222
https://hal-cea.archives-ouvertes.fr/cea-02538222
Submitted on 9 Apr 2020
HAL is a multi-disciplinary open access
archive for the deposit and dissemination of
sci-entific research documents, whether they are
pub-lished or not. The documents may come from
L’archive ouverte pluridisciplinaire HAL, est
destinée au dépôt et à la diffusion de documents
scientifiques de niveau recherche, publiés ou non,
émanant des établissements d’enseignement et de
Experiments on interactions of molten steel with
suboxidized corium crust for in-vessel melt retention
Adrien Pivano, P Piluso, Nourdine Chikhi, Jules Delacroix, Pascal Fouquart,
Romain Le Tellier
To cite this version:
Adrien Pivano, P Piluso, Nourdine Chikhi, Jules Delacroix, Pascal Fouquart, et al.. Experiments
on interactions of molten steel with suboxidized corium crust for in-vessel melt retention. Nuclear
Engineering and Design, Elsevier, 2019, 355, pp.110271. �10.1016/j.nucengdes.2019.110271�.
�cea-02538222�
In-Vessel Retention: Molten stainless steel - corium
crust interaction
Adrien Pivanoa,∗, Pascal Pilusoa, Nourdine Chikhia, Jules Delacroixa, Pascal Fouquarta, Romain Le Tellierb
aCEA , DEN , Cadarache, DTN , SMTA , LEAG, F-13108 Saint-Paul-Lez-Durance , France
bCEA , DEN , Cadarache, DTN , SMTA , LMAG, F-13108 Saint-Paul-Lez-Durance , France
Abstract
In the framework of the European IVMR project, dedicated to the assess-ment of In-Vessel Retention (IVR) strategy for high power reactors, VITI-CORMET tests, performed in VITI facility (CEA-Cadarache/PLINIUS Severe Accident Platform), intend to study the interaction between a molten 304L stainless steel droplet and suboxidized solid corium crust, referred to as C-70 ((U0.54, Zr0.46)O1.74). In the present paper, original experimental results on
molten steel penetration through a corium crust are presented. Identification of penetration mechanisms is performed by SEM/EDX analyses, and has shown that molten steel can penetrate through pre-existing cracks or by a dissolution process. The latter is found to be the dominant penetration mechanism and involves material transport from the crust to molten steel. Penetration kinetics is studied by measuring the average penetration length at different exposure times. It is found that the penetration by dissolution decelerates with time, while U and Zr contents tend to reach an equilibrium value within the metallic droplet.
Keywords: In-Vessel Retention, Focusing effect, Molten stainless steel, Suboxidized solid corium
∗Corresponding author
1. Introduction
During a severe accident in a Light Water Reactor (LWR), core meltdown may result in the formation of a molten corium pool in the lower head of the reactor vessel. The IVR as a severe accident management strategy aims to contain and stabilize the corium within the reactor pressure vessel by external
5
cooling of the vessel wall using natural or forced water convection. This strategy is highly desirable since it would minimize the risks of containment failure and has already been adapted for some low power LWRs (e.g: Loviisa). The success of IVR strategy mainly depends the heat flux transferred by the corium pool to the vessel wall, which must remains lower than the Critical Heat Flux (CHF)
10
at all points around the lower head. Depending on the reactor characteristics, the CHF ranges from 1.5 MW.m−2to 2 MW.m−2 [1, 2]. One of the phenomena limiting the IVR strategy is the so-called ”Focusing Effect” due to the formation of a ”thin” light metal layer on top of the corium pool in direct contact with the vessel wall. Concentration of the heat flux by focusing effect can lead to
15
the vessel failure due to high heat flux which can be greater than the CHF. In general, the intensity of the focusing effect increases when the thickness of the upper metallic layer decreases [3, 4, 5].
The thickness of top metal layer can vary according to the stratification mechanism. This physical process has been previously observed in OECD
20
MASCA program [6], in which the interaction between molten Stainless Steel (SS) and molten suboxidized UO2+ZrO2+Zr corium in the miscibility gap has
been studied. It has been established that material exchange occurs between these two immiscible phases, leading to an enrichment of the liquid steel in both uranium and zirconium. According to the system composition, the metallic
liq-25
uid (SS + U + Zr) density can be either higher or lower than the oxidic liquid density. Depending on its density, the metallic liquid can be located at the bottom or on top of the corium pool when equilibrium is reached.
During the transient process of stratification, it has been shown that the liquid phases configuration of the corium pool can strongly affect the IVR
egy chances of sucess [7, 8], in particular because of the possible thinning of top metal layer. At the transitional stage of stratification, a part of SS is relocated at the bottom and the remaining SS lays on top, forming the upper metallic layer. In this case, a suboxidized solid corium crust can separate the top metal layer from the oxidic liquid, and the 3-layer molten pool is established. Within
35
the 3-layer configuration the focusing effect is higher. A small scale experimen-tal study of the impact of a corium crust on the stratification kinetics has been carried out in the scope of the CORDEB program [9]. It has been shown that the corium crust secured the long-term existence of the 3-layer corium pool con-figuration compared to the fast stratification observed in MASCA experiments
40
[6] where no crust has been observed on top of the corium pool. The stratifi-cation kinetics is limited by the mass transfer of the upper metal layer through the ”permeable” oxidic crust. The penetration of the molten metal into the crust can occur according to two main mechanisms that can be coupled: disso-lution mechanism, propagation through cracks mechanism. However, it seems
45
difficult to highlight the phenomenology of the interaction between molten steel and corium crust from CORDEB experiments because strong thermal gradients are present at the crust location and the physical system corium crust-molten steel can not be decoupled from the liquid pool. Until now, there is a lack of knowledge on this interaction and on the first-order parameters governing the
50
penetration kinetics.
In the present paper, an experimental study, called VITI-CORMET, of the interaction between liquid 304L stainless steel and subodixized corium crust in quasi-isothermal condition is presented. This study is a focus on the physical system corium crust-molten steel. In order to carry out this analysis, seven
55
experiments have been performed at CEA-Cadarache in the VITI facility of the PLINIUS platform. The 304L stainless steel, corresponding to the internal steel structures in French nuclear reactor vessel lower-head, is melted on a sub-oxidized corium crust having a composition (U0.54, Zr0.46)O1.74, the so-called
C-70. The experimental grid has been built on two key parameters involved in
60
exposure time, varying from 30 min to 180 min.
A description of the VITI facility, the experimental procedures of the corium crust synthesis (VITI-CREACOR) and VITI-CORMET experiments, and post-test analyses procedures are detailed in Section 2. Original results on
pene-65
tration mechanisms and penetration kinetics of the molten steel through the crust are presented in Section 3. A discussion on these new insights are given in Section 4. Finally, a conclusion and some prospects are presented in Section 5.
2. Experimental procedure
70
2.1. Apparatus VITI-CREACOR/CORMET
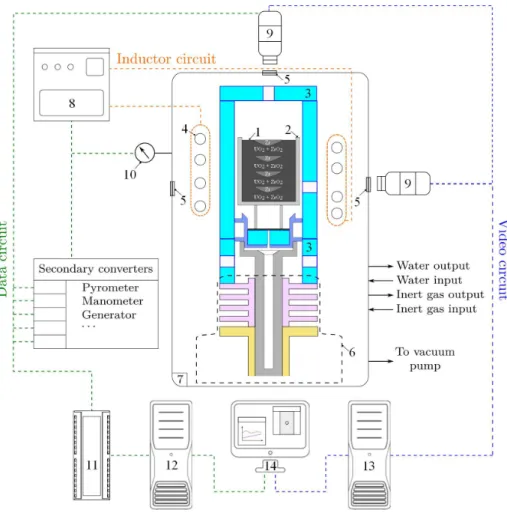
The layout of VITI facility is displayed in Figure 1 for a VITI-CREACOR configuration. The charge (1) is placed in a crucible (2) (41 mm diameter - 48 mm height) made of tungsten. The whole system is heated by direct induc-tion method : the water-cooled inductor (4), connected to the power generator
75
(8) at working frequency f = 180 kHz, is electromagnetically coupled with the electroconductive crucible (2). The latter heats the charge up to the target temperature, mainly by conduction. There is a thermal shield (3) around the crucible in order to limit thermal losses. The charge crucible and the thermal shield sits upon a dense graphite support (6).
80
The VITI confinement vessel (7) is water-cooled and allows to work in a controlled atmosphere. The ambient atmosphere is composed of inert argon gas at absolute pressure 1.3-1.5 bar measured with the manometer (10). The initial atmosphere composed of ambient air is removed by several vacuum pump-ing/Argon sweeping cycles. Two bi-chromatic video pyrometers (9), with
work-85
ing wavelengths λ1 =0.95 µm and λ2 =1.05 µm, allow temperature
measure-ments and experimental imaging. One pyrometer is focused on the charge sur-face through the upper window (5), while the second one is focused on the side of the crucible. The focus point of the second pyrometer is located just beneath the height of the melt after complete melting, in order to measure the
Figure 1: Scheme of the VITI facility in VITI-CREACOR configuration. 1: powder mixture; 2: tungsten crucible; 3: thermal shield; 4: inductor; 5: windows; 6: crucible support system; 7: confinement vessel; 8: generator; 9: video-pyrometer; 10: manometer; 11: data bus; 12; data acquisition computer; 13: imaging computer; 14: monitoring and data treatment.
ture of the crucible in contact with the melt. Data are collected by the data bus (11) and are sent to the data acquisition computer (12). The imaging computer (13) is used for sample monitoring, and allows real time and post-test analyses.
2.2. Corium crust formation and characterization: VITI-CREACOR
The charge is composed of a mixture of UO2(grain size ≤ 100 µm) and ZrO2
95
(a)
(b)
(c)
θ = 0° θ = 45° θ = 90° θ = 135° x y H D θ = 0° θ = 45° θ = 90° θ = 135° 0 17 34 0 -1 -2 x (mm) y (mm)Corium crust
Figure 2: Surface characterization of the corium crust. (a) Corium crust after VITI-CREACOR, dashed red lines represents the four concavity measurement diameters, (b) schematic cross section of the crust with dimensions and axis system, (c) depth variation of the crust meniscus (y) with respect to the length of the four measurement diameters (x)
ground in a mortar and Zr metal granulates (grain size ≤ 6 mm). The mass of the charge is equal to 155 g, and it is placed into the crucible in order to obtain a target corium composition (U0.54Zr0.46)O1.74, a so-called C-70 corium,
with an atomic ratio U/Zr = 1.2. Zirconium granulates are deposited in layers
100
within the powder mixture in order to avoid contact with the crucible during the melting process. The charge is heated up to the target temperature, upper than the liquidus temperature of the mixture calculated with Thermo-Calc Software [10] and NUCLEA database [11, 12], ensuring liquid state of the mixture (Tf us
= 2520 ◦C). The charge is held in the liquid state for about ten minutes in
105
Figure 3: (a) Schematic view of the VITI-CORMET test section. (b) Typical thermograph of VITI-CORMET experiments
by turning off the inductor.
After the corium formation step, the suboxidized corium crust is extracted from the confinement vessel in order to characterize its surface. A typical top view of a corium crust is displayed in Figure 2a. The corium crusts obtained by
110
VITI-CREACOR have a diameter D equal to 41 mm and a maximum height H of about 17 mm, these dimensions are schematically represented in Figure 2b. The surface of the crusts is generally concave. A depth gauge is used to measure the depth of the meniscus, along four different diameters, every two millimeters (see Figure 2a). Figure 2c shows the depth variation of the crust as a function
115
of the distance along the diameters. The surface is quite symmetric and has a maximum relative depth of about 1.8 mm.
These experimental data are necessary to evaluate the interaction between stainless steel and corium crust (VITI-CORMET), and the penetration length of the liquid steel through the corium crust. The data represented in Figure 2c
120
are used as initial position of the molten steel bottom surface.
2.3. Molten steel-suboxidized corium crust interaction: VITI-CORMET A schematic view of the VITI-CORMET configuration is shown in Figure 3a. A 304L stainless steel pellet, with a mass of about 2 g, lays on the corium crust, synthesized during VITI-CREACOR stage, and heated up to the target
125
one described in Section 2.1. The ambient atmosphere is composed of inert argon at absolute pressure 1.3-1.5 bar. A typical thermograph is shown in Figure 3b, where the 304L steel pellet melting is detected at 1460 ◦C by a temperature drop. Then, the quasi-isotherm condition is rapidly reached. In
130
general the 304L melting point is observed with a high reproducibility from one experiment to another with a value of about 1450◦C. This experimental value is in good agreement with melting temperature of 304L stainless steel reported in the litterature [5, 13], which confirms the good reliability of the measurement. One can observe the high stability of the temperature during the exposure time
135
texp. Finally, the molten droplet is rapidly cooled by turning off the inductor.
2.4. Experimental grid and characterization processes
In order to study the interaction between 304L molten steel and suboxi-dized corium crust in quasi-isotherm condition, seven VITI-CORMET tests are performed with two setting parameters: temperature and exposure time. This
140
experimental grid is conducted with a temperature range from 1600◦C to 1800
◦C and an exposure time ranging from 30 min to 180 min. The target corium
composition (U0.54Zr0.46)O1.74 is the same in all the experiments, as well as its
mass (155 g). In these seven experiments, 304L stainless steel pellets, with a mass of about 2 g, are melted on the corium crust. Finally, the corium crust
145
CREACOR-1 is used as reference to compare the targeted corium composition with the experimental one, since this sample did not interact with the molten steel.
Post-test analyses are performed using Scanning Electron Microscopy (SEM) imaging. For SEM observations, samples are cut along a concavity measurement
150
diameter displayed in Figure 2a, mounted in Struers-EpoFix resin and polished with an automatic polishing machine using SiC polishing disks and then dia-mond solution. Carbon deposits of about 30 nm are made in order to metallize the samples. Samples are examined with a ZEISS EVO HD15-MA Scanning Electron Microscope in order to analyse penetration mechanisms of the molten
155
Zr-rich
U-rich
Figure 4: BSE image of the crust from the reference sample CREACOR-1. Image obtained with low brightness and high contrast.
occurring in this system. Oxygen measurement for local corium analyses re-mains very challenging due to large uncertainties. Nevertheless, some insightful features can be highlighted for experimental interpretation.
3. Experimental results
160
3.1. Analysis of the reference sample CREACOR-1
In order to compare the targeted corium crust composition (U0.54Zr0.46)O1.74
with the experimental one, a corium crust that did not interact with the molten steel is analysed (sample CREACOR-1). A BackScattered Electrons (BSE) image of the crust from CREACOR-1 is displayed on Figure 4. This image is
165
taken with low brightness and high contrast to distinguish the heterogeneities of the composition. Two kinds of regions can be observed in the crust : U-rich
Windows U at.% Zr at.% O at.% U/Zr Formula Global 20.3 16 63.7 1.27 (U0.56Zr0.44)O1.75 U-rich 21.1 13.8 65.1 1.53 (U0.60Zr0.40)O1.86 Zr-rich 19.4 17.6 63 1.10 (U0.52Zr0.48)O1.70 Table 1: Average composition of the corium crust for the reference sample CREACOR-1.
(brighter areas) and Zr-rich (darker areas) regions. The average composition of the crust is measured using windows including both U-rich and Zr-rich regions (called ”Global” windows) and windows dedicated to either U-rich regions or
170
Zr-rich regions. The results are summarized in Table 1 for these three types of windows and the molecular formulations are presented to compare them to the target corium composition (U0.54Zr0.46)O1.74. The measured global composition
is closed to the targeted one, but a slight difference is observed on the atomic ratio U/Zr which is equal to 1.27 with respect to the expected one (1.2). Larger
175
deviations from the target composition are observed regarding both U-rich and Zr-rich regions. The U-rich regions are characterized by an atomic ratio U/Zr equal to 1.53 and appear to be more oxidized than the Zr-rich regions, the latter being characterized by an atomic ratio U/Zr equal to 1.10.
3.2. Penetration mechanisms
180
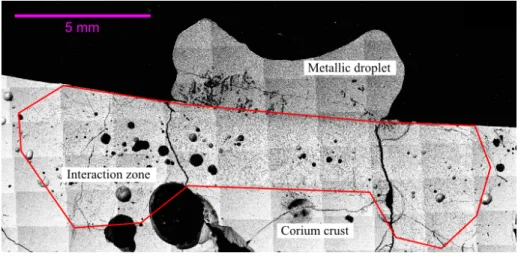
A BSE composite image of sample cross section for 304L/(U0.54Zr0.46)O1.74
system cooled from 1700◦C after 180 min exposure time is displayed on Figure 5. This micrograph is representative of the other samples obtained from VITI-CORMET experiments. Three distinct regions can be highlighted in the system. The first region is the solidified metallic droplet whose size varies according to
185
the spreading. The second region is the interaction zone, which is delimited by the red line and defined by the distance between the initial surface of the crust and the deepest metallic inclusions observed in this crust. The third region corresponds to the corium crust that did not interact with the molten steel.
During the interaction, molten steel penetrates through the corium crust.
190
Two penetration mechanisms are identified in these experiments. Firstly, molten steel can penetrate through the crust by a dissolution mechanism. Figure 6a
Figure 5: BSE composite image of cross section for 304L/(U0.54Zr0.46)O1.74system cooled after 180 min from 1700◦C. The red line delimits the interaction zone.
(a) (b)
Metallic droplet
Corium crust
Figure 6: (a) BSE image of the interaction zone formed by dissolution and (b) magnification of the upper part of the interaction zone for 304L/(U0.54Zr0.46)O1.74system cooled after 30 min from 1800◦C.
shows the microstructure resulting from the dissolution process, which repre-sents a part of the interaction zone. The upper part of this region contains discontinuous small islands of corium crust surrounded by metal (displayed in
195
Figure 6b). In the middle part, an interconnected channels structure filled with metal between large discontinuous crust islands is observed. While in the lower part of the interaction zone only metallic inclusions are observed in a contin-uous corium crust. This morphological sequence indicates that the dissolution
Figure 7: BSE image of a crack filled by metal (left) and magnification of this crack (right) for 304L/(U0.54Zr0.46)O1.74system cooled after 180 min from 1800◦C.
process leads to an heterogeneous molten steel penetration through the corium
200
crust and involves the existence of preferential path such as grain boundaries, sub-grain boundaries or porosities.
The other way for the molten steel to penetrate within the corium crust is through macroscopic defects such as constraints which can appear during the solidification process. Formation of cracks is dependent on the solidification
205
process in the CREACOR configuration, as well as in the reactor case. Out of seven experiments, only one crack filled by metal is observed, as displayed on Figure 7 (left panel). The apparent diameter varies between 10 µm and 100 µm. The right panel in Figure 7 represents a magnification of the crack filled by metal and shows that the molten steel interacts with the crust during
210
its penetration through the crack, as U-rich solidified particles (white particles) are observed near the edges where a dissolution process takes place. This attack
0 30 60 90 120 150 180 texp(m in) 0 0.5 1 1.5 2 2.5 3 3.5 Lpen (m m ) Lpen (mm) texp (min) (a) (b) 3.5 3 2.5 2 1.5 1 0.5 0 0 30 60 90 120 150 180
Figure 8: (a) BSE composite image representing the penetration length analyses procedure. (b) Average penetration length of molten steel dissolution attack as function of the exposure time at T=1700◦C. Solid line corresponds to the fitting curve using Equation 1. ”Dash” line corresponds to a linear fit. Error bars represent the standard deviation.
contributes to an enlargement of the crack. Although penetration through the crack could be a faster way for the metal to penetrate within the crust, it is nevertheless minor compared to dissolution penetration as it strongly depends
215
on the number of cracks connected to the surface of the crust. Let us rather focus on the kinetics of penetration by dissolution attack.
3.3. Penetration kinetics at T=1700◦C
The average penetration length (Lpen) of molten steel through the corium
crust is measured using the analysis procedure shown in Figure 8a. The axial
220
distance between the initial surface of the crust (”dash” yellow line) and the line where the deepest metallic inclusions are observed (”dot” blue line) is measured. This measurement is repeated a hundred times between the two triple points of the metallic droplet marked by the red vertical solid lines. In order to visualize the part of the totally dissolved crust, a line representing the location of the last
225
partially dissolved corium grains observed in the upper part of the interaction zone is plotted on the image (”dashdot” black line).
The evolution of the average penetration lengths, for T=1700◦C, as a
func-tion of the exposure time is displayed in Figure 8b. Experimental data are fitted, assuming a deceleration of the penetration with time, following the general law
(a)
(b)
(c)
Fe(Cr)
(U,Zr)Fe(Cr,Ni)
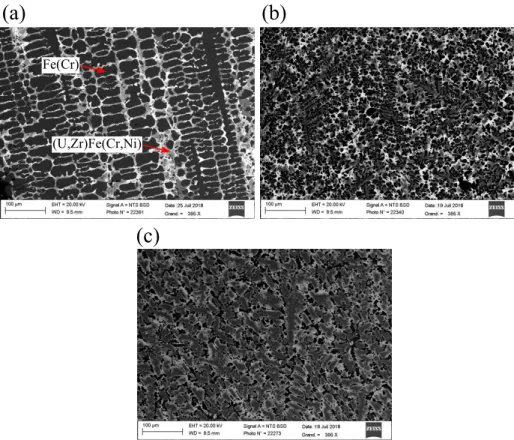
Figure 9: Microstructures of the solidified metallic droplet obtained from VITI-CORMET tests performed at 1700◦C with an exposure time of 30 min (a), 90 min (b) and 180 min (c).
[14] :
Lpen= Atαexp (1)
where A and α are two constants. A deceleration of the molten steel penetration is observed (α = 0.90 ± 0.04 < 1).
The dissolution mechanism implies material transport from the crust to the molten metal leading to the enrichment in uranium and zirconium of the upper
235
metallic droplet as well as the metallic inclusions (interstitial metal). This phenomenon is analysed in the following section.
0 30 60 90 120 150 180 texp(m in) 0 2 4 6 8 10 12 14 Ci (a t % ) i = U i = Zr
C
i(at %)
t
exp(min)
0
2
4
6
8
10
12
14
0
30
60
90
120
150
180
i = U
i = Zr
Figure 10: Time evolution of the average concentration in U and Zr of the upper metallic droplet at 1700◦C. Solid lines correspond to the fitting curves.
3.4. Metallic droplet composition at 1700◦C
The microstructures of the solidified metallic droplet for an exposure time of 30, 90 and 180 min are given in Figure 9a, b and c respectively. Two phases
240
are observed in the samples : a dendritic Fe(Cr) phase (black areas) and a continuous solid solution (U,Zr)Fe(Cr,Ni). In the latter, composition gradients are observed with U-rich regions (brighter areas) and Zr-rich regions (darker areas). The proportion of this phase varies with the exposure time, as it is shown in Figure 9. The longer the exposure time is the higher is the proportion
245
of this solid solution is, resulting in a gradual vanishing of the Fe(Cr) phase. To quantify the enrichment of the upper metallic droplet as function of exposure time, numerous EDX analyses are performed on each sample with large enough windows in order to include a sufficient amount of both Fe(Cr) and (U,Zr)Fe(Cr,Ni) phases. The time evolution of the average concentration in
100µm 1mm
(a)
(b)
(c)
(d)
100µm 100µm
Figure 11: (a) BSE image representing the interaction zone with three areas of interest (white rectangles) to study the interstitial metal composition. Magnification of these areas: (b) top, (c) middle and (d) bottom. Interstitial metal corresponds to dark phases while the brighter phase represents the corium crust. 304L/(U0.54Zr0.46)O1.74system cooled after 180 min from 1700◦C.
uranium and zirconium of the metallic droplet is displayed in Figure 10. Both contents increase with time but the atomic ratio U/Zr stays quasi-constant as its value is equal to 0.58, 0.57 and 0.62 at texp = 30, 90, and 180 min
respectively. Furthermore, the average concentrations seem to tend toward an equilibrium value and no concentration gradient is observed in the metallic
255
droplet. Experimental results are fitted by a general equation of dissolution kinetics [15, 16] given by:
Ci(t) = Ceqi (1 − exp(−kit)) (2)
equilib-Location U at.% Zr at.% O at.% Fe at.% Cr at.% Ni at.% U/Zr
Top 6.1 15.9 6.8 51.1 14.6 5.5 0.37
Middle 1.7 18.9 7.6 51 15.1 5.7 0.09
Bottom 1.6 22.4 6.5 49.2 14.8 5.5 0.07
Table 2: Average concentrations of major elements composing the interstitial metal and atomic ratio U/Zr for 304L/(U0.54Zr0.46)O1.74system cooled after 180 min from 1700◦C.
rium concentration of element i and ki is an effective dissolution rate constant
of element i. By analogy with a liquid dissolving a solid particle, ki is
as-260
sociated to a diffusion coefficient Di, the surface area S, the volume of the
dissolution medium and the thickness of the diffusion layer δ by the expression ki = DiS/V δ. The values obtained from the fit are kU = 1.51 × 10⁻⁴± 4 × 10⁻⁶
s−1 and kZr = 1.71 × 10⁻⁴± 9 × 10⁻⁶ s−1, involving a dissolution rate slightly
more important for Zr. Equilibrium concentrations found from the fit are equals
265
to 9 at.% and 14.1 at.% for uranium and zirconium respectively, leading to an atomic ratio U/Zr equals to 0.64, in fair agreement with the experimental values.
3.5. Interstitial metal composition at 1700◦C
The situation is quite different regarding the interstitial metal located in the channels of the interaction zone. The average composition of the interstitial
270
metal are measured along the height of the interaction zone. An example of these measurements are shown in Figure 11 for the CORMET-3 sample (T=1700◦C, texp=180 min). Figure 11a represents three distinct areas of interest (white
rect-angle) located on top, at the middle and at the bottom of the interaction zone, while Figure 11b, c and d display a magnification of these areas respectively
275
where composition measurements are performed (white unstructured windows). Table 2 shows the average compositions of the major elements forming the interstitial metal at these locations. A concentration gradient of U and Zr is observed between the lower part and the upper part of the interaction zone. A maximum (minimum) Zr (U) content is observed at the bottom with 22.4
280
(1.6) at.%, while a minimum (maximum) Zr (U) content is observed on top with 15.6 (6.1) at.%. This gradient is also well represented by the atomic ratio
U/Zr varying from 0.07 to 0.37 between the extremities of the interaction zone. Regarding the other components (Fe, Cr, Ni and O) their concentrations are quite constant along the height of the interaction zone. It may be noted that
285
this behaviour discussed for CORMET-3 sample is observed in all other tests independently of the experimental conditions.
4. Discussion
In these CORMET experiments, it is found that the liquid 304L stainless steel strongly interacts with the suboxidized corium crust. The micrographic
290
observations made on the longitudinal cross section of the samples have shown that the liquid steel can penetrate through the corium crust using macroscopic defects, such as cracks, or by a dissolution mechanism. The dissolution process leads to an interconnected network of channels filled by molten metal and defin-ing the interaction zone. As observed, the upper part of the interaction zone
295
is composed of discontinuous corium grains partially dissolved and surrounded by metal, while in the lower part metallic inclusion within a continuous corium crust is observed. These observations involve a heterogeneous way of penetration for the molten steel through the crust and consequently existence of preferential paths such as grain boundaries, sub-grain boundaries or porosities. In addition,
300
it is found that the dissolution process lead to material transport changing the nature of the molten steel in a metal enriched in uranium and zirconium. How-ever, concentration gradients are found between the metallic inclusions in the lower part of the interaction zone, having an atomic ratio U/Zr ≈ 0.07 (Zr-rich liquid), and the metallic droplet having an atomic ratio U/Zr ≈ 0.6. Between
305
them, an intermediate metal is found on top of the interaction zone and sur-rounding the discontinuous corium grains. This one has an atomic ratio U/Zr ≈ 0.4. In all cases, the values of the atomic ratio indicate a preferential extrac-tion of zirconium from the corium crust to the liquid steel, but with a gradient according to the front position of the interaction.
310
Corium/crust Zrfrich/liquid/metal Corium/crust TxZ TxZ Corium/crust Liquid/metal Ufrich/liquid/metal Liquid/Metal/3Droplet4 3UIZrIOIFeICrINi4/ 3UvZr4liq/=/1x6/f/1x7 Liquid/Metal//S/ discontinuous/Ufrich/grains 3UvZr4liq/=/1x3/f/1x4 Zrfrich/liquid/inclusions/in continuous/corium/crust 3UvZr4liq/=/1x17/f/1x19 Corium/crust SolidvLiquid/Interface Liquid/steel
C
C
C
x
x
x
vsvlt
t
1t
2t
2t
2t
2 vsvl U Zr O FeI/CrI/NiFigure 12: Schematic view of the concentration profiles at the interface corium crust-liquid steel (left part). Timeline is given in order to highlight the two-step dissolution process. Schematic view of the interaction zone (right part) displaying the correlation between spatial observations and the two-step process.
could be a two-step process depending on the interaction time. In Figure 12, a schematic view of the concentration profiles at the interface corium crust-liquid steel is displayed in order to describe the two-step process. For the sake of clarity, the steel elements are drawn on the same curve. The initial profiles are
315
represented at t = t0. Between t0 and t1 (t1 > t0), a preferential extraction of
Zr occurs involving a slight displacement of the solid/liquid interface (vs/l) and
the formation of a Zr-depleted and U-rich solid oxide transition zone (T.Z). The liquid metal resulting from this first step is no longer liquid steel but corresponds
to a Zr-rich liquid metal. Between t1 and t2 (t2 > t1), the transition zone is
320
dissolved by the surrounding liquid leading to a displacement of the solid/liquid interface and the formation of a new transition zone at the interface. A U-rich liquid metal near the interface is obtained by the previous dissolution of the transition zone. Far from the interface, the metal liquid corresponds to an enriched liquid in both uranium and zirconium with an atomic ratio U/Zr higher
325
than the atomic ratio of the Zr-rich liquid metal obtained at t1. A comparison
can be made between this two-step process and the morphological sequence of the interaction zone. In fact, the interaction time is longer in the upper part of the interaction than in the lower part. On the right part of Figure 12, the process occurring at t1 is linked with the lower part of the interaction zone
330
where only Zr-rich liquid inclusions are observed. At this position, the liquid phase is discontinue and the volume ratio Vliq/Vsol 1, which implies a small
reactive surface and consequently a partial dissolution of the crust. Conversely the upper part is linked with the second process occurring at t2due to the small
size of the U-rich oxide grains and the composition of the liquid metal which
335
is richer in uranium. Indeed, at this position, the liquid phase is continuous and the volume ratio Vliq/Vsol 1, involving a large reactive surface and thus
causing the dissolution of the U-rich solid. Finally, the assumption of a two-step dissolution process is reinforced by qualitative concentration profiles obtained from post-test analyses and represented in Figure 13. These profiles are taken
340
at the lower part (left side) and the upper part (right side) of the interaction zone. However, more concentration profiles at these different locations need to be analysed in order to confirm this assumption.
From the penetration kinetics results, an effective diffusion coefficient for the molten steel can be evaluated by :
345 Def f = L2 pen texp . (3)
At 1700 ◦C, an average value of 4.7×10⁻¹⁰ m2/s is found and appears to be
5000 4000 3000 2000 1000 0 4 8 12 16 c.p.s µm 0 1 2 3 4 5 6 µm T.Z Zr-richnliquid T.Z U-richnliquid Solid/LiquidnInterface Solid/LiquidnInterface tn=nt1 tn=nt2 5000 4000 3000 2000 1000 6000 U Zr O Fe Cr Ni U Zr O Fe Cr Ni
Figure 13: EDX lines of the corium crust - molten metal interface at the lower part (left panel) and the upper part (right panel) of the interaction zone (c.p.s : EDX’s Counts Per Second). Corresponding BSE images are also represented.
linked to the dissolution process described in the previous paragraph. During the first step of the interaction, zirconium is preferentially leached from the crust and interacts with the molten steel. This interaction could lead to the formation
350
of liquid metallic phase in the crust, principally at preferential paths, and to the creation of open liquid channels. These liquid channels allow molten steel to progress rapidly within the corium crust by liquid-state diffusion and to sustain zirconium leaching at the interface. Grain boundaries, sub-grain boundaries or porosities could be preferential sites to initiate the interaction (first step), after
355
what, at a later time, the grain itself is dissolved by the surrounding liquid (second step of the interaction). The role of preferential paths could explain the heterogeneous penetration of the molten steel through the corium crust and the interconnected network of channels observed in the interaction zone. Such mechanisms have been previously observed in an experimental study dedicated
360
to the dissolution of UO2by molten zircaloy [17]. In addition, it is found that the
penetration decelerates with increasing exposure time. The penetration kinetics could be limited by the enrichment of the molten metal in corium crust elements
(U, Zr, O). In these CORMET experiments, a tendency towards and equilibrium value of U and Zr concentration within the metallic droplet is observed. The
365
deceleration of the penetration could be correlated to a chemical equilibrium between the corium crust and the enriched molten metal. In that case, the dissolution attack should stop when the asymptotic values are reached. An experiment with a longer exposure time should confirm this assumption and constitutes an outlook of the present work.
370
5. Conclusion and outlook
This experimental study of the interaction between suboxidized C-70 corium crust and molten 304L stainless steel has unveiled new results on the steel pen-etration through the crust and the material transport occurring during this interaction. These results show that molten steel penetrates within the crust
375
according to two mechanisms observed using SEM analyses. Firstly, molten steel can penetrate through macroscopic defects formed during the solidifica-tion process, and secondly, by a dissolusolidifica-tion mechanism. The latter is found to be the preponderant mechanism and forms an interconnected network of chan-nels filled by metal which delimits the interaction zone. The interaction zone
380
has a particular morphological sequence with small partially dissolved corium grains surrounded by metal in the upper part and metal inclusions within a continuous corium crust in the lower part. The metal filling the channels, as well as the metallic droplet located above the interaction zone, are composed of steel elements (major elements : Fe, Cr, Ni) and crust elements (U, Zr, O)
385
coming from the dissolution mechanism. A composition gradient in U and Zr is observed between the lower part of the interaction zone and the metallic droplet, with the latter richer in crust elements. In addition, the atomic ratio U/Zr in the metal shows that Zr is preferentially extracted from the crust. In order to explain these observations, a two-step process occurring at the solid/liquid
390
interface is proposed. In the first step, a Zr-rich liquid metal and a U-rich solid transition zone are formed by the preferential extraction of Zr, which leads to a
slight motion of the interface. In the second step, the U-rich transition zone is dissolved involving an enrichment in U of the metal and a reinforced motion of the solid/liquid interface. This two-step process is correlated with a change in
395
the volume ratio Vliq/Vsol along the morphological sequence of the interaction
zone and the composition gradient. Finally, a deceleration of the penetration is observed and linked to the asymptotic behaviour of U and Zr contents in the metallic droplet with increasing exposure times.
These new insights can be used for numerical modelling of the molten pool
400
in IVR conditions. Additional experiments and analyses are necessary before implementing these results in code dedicated to severe accidents. Experiments with longer exposure time are required in order to confirm the asymptotic be-haviour of U and Zr contents in the metal and its correlation with the deceler-ation of the penetrdeceler-ation. Experiments with different corium compositions are
405
also recommended in order to highlight new mechanisms of penetration and kinetics. Future analyses will be conducted on the existing samples: EBSD analyses in order to observe the role of grain boundaries or sub-grain bound-aries in the penetration process, and WDS analyses to diminish uncertainties on oxygen content. A short-term outlook of the present study would also consist
410
in modelling the dissolution mechanism of the crust at a smaller scale than the macroscopic model recently proposed [18]. This meso-scale model will use multi-component diffusion theory as well as moving phase boundary problem and will be linked to CALPHAD-based thermodynamics calculations. This model will aim at reproducing the preferential extraction of Zr as well as the composition
415
profiles.
Acknowledgements
This work is funded by Horizon 2020 IVMR project (grant agreement number 662157). Post-test analyses are performed at the CEA/LMCT lab with the participation of Laurent Brissonneau and Josselin Gousseau: the authors are
420
References
[1] W. Ma, Y. Yan, B. R. Sehgal, In-Vessel Melt Retention of pressurized water reactors: Historical review and future research needs, Engineering 2 (1) (2016) 103–111.
425
[2] F. Fichot, J. Bonnet, B. Chaumont, IRSN views and perspectives on in-vessel melt retention strategy for severe accident mitigation, Proceeding of EUROSAFE Forum.
[3] J. Bonnet, J. Seiler, Thermal hydraulic phenomena in corium pools: the bali experiment.
430
[4] L. Carenini, F. Fichot, N. Seignour, Modelling issues related to molten pool behaviour in case of in-vessel retention strategy, Annals of Nuclear Energy 118 (2018) 363 – 374.
[5] N. Chikhi, P. Fouquart, J. Delacroix, P. Piluso, Measurement of type 304l stainless steel and 16mnd5 ferritic steel density and surface tension:
Possi-435
ble impact for stratified molten pool, Nuclear Technology 205 (1-2) (2019) 200–212.
[6] D. Tsurikov, V. Strizhov, S. Bechta, V. N. Zagriazkin, N. P. Kiselev, Main results of MASCA1 and 2 projects., RRC Kurchatov Institute, Technica report.
440
[7] Y. Zhang, S. Qiu, G. Su, W. Tian, Analysis of safety margin of in-vessel retention for AP1000, Nuclear Engineering and Design 240 (8) (2010) 2023 – 2033.
[8] R. L. Tellier, L. Saas, S. Bajard, Transient stratification modelling of a corium pool in a LWR vessel lower head, Nuclear Engineering and Design
445
287 (2015) 68 – 77.
[9] V. Almjashev, V. Granovsky, V. Khabensky, S. Kotova, E. Krushinov, A. Sulatsky, S. Vitol, V. Gusarov, F. Fichot, B. Michel, P. Piluso, R. L.
Tellier, M. Fischer, C. L. Guennic, N. Bakouta, Experimental study of tran-sient phenomena in the three-liquid oxidic-metallic corium pool, Nuclear
450
Engineering and Design 332 (2018) 31 – 37.
[10] J. Andersson, T. Helander, P. Shi, B. Sundman, Thermo-Calc and DIC-TRA, Computational tools for materials science., Claphad 26 (2002) 273– 312.
[11] B. Cheynet, P. Chaud, P.-Y. Chevalier, E. Fischer, P. Mason,
455
M. Mignanelli, NUCLEA propri´et´es thermodynamiques et ´equilibres de phases dans les syst`emes d’int´eret nucl´eaire, J. Phys. IV France 113 (2004) 26.
[12] B. Cheynet, NUCLEA (2007).
URL http://hal.archives-ouvertes.fr/hal-00165418/fr/
460
[13] A. Cezairliyan, A. P. Miiler, Thermophysical measurements on low car-bon 304 stainless steel above 1400 K by a transient (subsecond) technique, International Journal of Thermophysics 1 (1) (1980) 83–95.
[14] K. Lambrinou, E. Charalampopoulou, T. Van der Donck, R. Delville, D. Schryvers, Dissolution corrosion of 316L austenitic stainless steels in
465
contact with static liquid lead-bismuth eutectic (LBE) at 500 C, Journal of Nuclear Materials 490 (2017) 9 – 27.
[15] W. Nernst, Theorie der reaktionsgeschwindigkeit in heterogenen systemen, Z. Phys. Chem. 47 (1904) 52–55.
[16] E. Brunner, Reaktionsgeschwindigkeit in heterogenen systemen, Z. Phys.
470
Chem. 47 (1904) 56–102.
[17] K. Tim, D. Olander, Dissolution of uranium dioxide by molten zircaloy I. diffusion-controlled reaction, Journal of Nuclear Materials 154 (1988) 85–101.
[18] N. Shambhavi, F. Fichot, A two phase mathematical model to describe
475
the dissolution of a binary solid by liquid, Proceedings of the 7th Interna-tional and 45th NaInterna-tional Conference on Fluid Mechanics and Fluid Power (FMTP2018).