HAL Id: hal-03118196
https://hal.archives-ouvertes.fr/hal-03118196
Submitted on 22 Jan 2021
HAL is a multi-disciplinary open access
archive for the deposit and dissemination of
sci-entific research documents, whether they are
pub-lished or not. The documents may come from
teaching and research institutions in France or
abroad, or from public or private research centers.
L’archive ouverte pluridisciplinaire HAL, est
destinée au dépôt et à la diffusion de documents
scientifiques de niveau recherche, publiés ou non,
émanant des établissements d’enseignement et de
recherche français ou étrangers, des laboratoires
publics ou privés.
South China Sea Resulting From Source-to-Sink
Processes
C. Kissel, M. Sarnthein, C. Laj, P. Wang, C. Wandres, R. Egli
To cite this version:
C. Kissel, M. Sarnthein, C. Laj, P. Wang, C. Wandres, et al.. Magnetic Fingerprints of Modern
Sed-iments in the South China Sea Resulting From Source-to-Sink Processes. Geochemistry, Geophysics,
Geosystems, AGU and the Geochemical Society, 2018, 19 (7), pp.1979-1993. �10.1029/2018GC007571�.
�hal-03118196�
Magnetic Fingerprints of Modern Sediments in the South China
Sea Resulting From Source-to-Sink Processes
C. Kissel1 , M. Sarnthein2 , C. Laj3, P. X. Wang4, C. Wandres1, and R. Egli5
1
Laboratoire des Sciences du Climat et de l’Environnement/IPSL, CEA-CNRS-UVSQ, Université Paris-Saclay, Gif-sur-Yvette, France,2Institute of Geosciences, University of Kiel, Kiel, Germany,3Département de Géosciences, Ecole Normale Supérieure, PSL Research University, Paris, France,4State Key Laboratory of Marine Geology, Tongji University, Shanghai, China,5Department of Geophysics, Central Institute for Meteorology and Geodynamics, Vienna, Austria
Abstract
More than 650 Mt/year offluvial sediment are delivered from continental regions into the South China Sea (SCS). Previous studies have shown that the composition of the magnetic fraction of riverine sediments drained into the SCS is significantly variable from north to south. On the basis of this evidence, we now examine a full set of magnetic properties for a number of core tops taken at water depth of mostly between 800 and 3,500 m. Room temperature magnetic parameters and thermal spectra are used to obtain information about the concentration and mineralogical magnetic composition. Spatial changes are observed in the relative proportion of magnetite and hematite with an increase of the latter toward the south, similarly to the observation on land. However, the N-S contrast is much weaker in marine core tops than in river sediments, because of the role played by the shelf in partly trapping river-borne sediments, in particular in the southern SCS. In part, sediments also reach the continental slope and the deep basins, being transported and mixed by surface and deepwater currents, which yield the magnetite-hematite mixing in the south. For thefirst time, we characterize a wide spectrum of magnetic properties of modern marine sediment in the SCS. Our results give important insights into the modern pathways of sediment particles, depicting the source-to-sink processes that affect the terrigenous sediment load.1. Introduction
Marginal seas are located at the transition between continents and open oceans and sometimes on the pathway from one ocean to another. They play a key role in the global oceanic circulation and terrigenous sediment dispersal. Since both the continental environments that control the sediment discharge and the marine circulation pathways are often complex, marginal seas constitute ideal areas to examine terrigenous sedimentfluxes from continental source regions down to the sites of marine deposition.
In this respect, the South China Sea (SCS), the largest marginal sea in eastern Asia at the transition between the Pacific and Indian oceans, forms a perfect natural laboratory to study source-to-sink processes of detrital particles and their potential for paleoceanographic reconstructions. SCS receives enormous amounts of river sediments under the influence of heavy precipitation during the summer monsoon. At sea, these sediments are carried by different water masses to their deposition site. They therefore constitute a unique archive for past environmental studies in this region, in particular for reconstructions of past changes in oceanic circulation, sea level, precipitations on land, and position of rain belts.
The potential and limitations of proxies such as rare elements composition, stable isotopes, grain size, and clay minerals for a reconstruction of past climatic and hydrographic changes in the SCS have been reviewed by Clift (2015). Magnetic analyses that include identification of magnetic minerals, determination of their grain size, and evaluation of their concentration are not considered in this review because pertinent data are still scarce in the SCS. Nevertherless, the physicochemical characteristics of the magnetic fraction reflect the composition of the parent rocks and/or the degree of chemical weathering and of runoff in the continental source area (Kissel et al., 2010; L. Wang, Hu, et al., 2017; Y. Wang, Wang, & Liu, 2017). Thus, magnetic properties of sediments may serve as prominent provenance indicators. In addition, the spatial and depth distribution of magnetic particles on the seafloor provides information not only about the land-sea interactions but also about the dynamics and pathways of major ocean currents (see, e.g., Kissel et al., 2009, 2013). In other words, the magnetic fraction in marine sediments, though forming a minority of sediment volume, provides valuable information for paleoceanographic reconstructions, as long as its provenance and source-to-sink processes are well constrained.
RESEARCH ARTICLE
10.1029/2018GC007571
Key Points:
• Full magnetic properties of modern sediments all over the South China Sea indicate variable proportions of hematite and magnetite • At sea, the gradient from northern
sourced magnetite to southern sourced hematite is damped due to the trapping of sediment on the shelves
• The river sediments reach the deep sea with a dilution of hematite in the south by magnetite likely
transported from the north by currents Supporting Information: • Supporting Information S1 • Data Set S1 Correspondence to: C. Kissel, catherine.kissel@lsce.ipsl.fr Citation:
Kissel, C., Sarnthein, M., Laj, C., Wang, P. X., Wandres, C., & Egli, R. (2018). Magneticfingerprints of modern sediments in the South China Sea resulting from source-to-sink processes. Geochemistry, Geophysics, Geosystems, 19, 1979–1993. https://doi.org/10.1029/ 2018GC007571
Received 19 MAR 2018 Accepted 18 MAY 2018
Accepted article online 8 JUN 2018 Published online 6 JUL 2018
©2018. American Geophysical Union. All Rights Reserved.
Magnetic properties of marine sedimentary sequences, although still very scarce, have recently increasingly been analyzed in the SCS with a focus on the northernmost basin. The results show, with variable time resolution, a variability in nature, grain-size, and concentration of magnetic particles, interpreted as a result of the local impact of past changes in East Asian monsoon, sea level, and ocean circulation (Q. Chen et al., 2017; Kissel et al., 2003; Ouyang et al., 2014, 2016; Solheid et al., 2003; Zheng et al., 2016).
These environmental magnetic analyses of marine sediments suffer from insufficient coverage of representative sites and water depths and from a limited knowledge of land provenance. This problem also applies to the studies of the magnetic susceptibility in core tops (Z. Chen et al., 2009; J. Liu et al., 2010). Magnetic properties of river samples from the Taiwan Strait and onshore Taiwan have been investigated (Horng & Huh, 2011; Horng et al., 2012). Most recently, Kissel et al. (2016, 2017) analyzed those of modern river sediments from all around the SCS. These studies revealed that modern river sediments contain, tofirst approximation, two main magnetic mineral families forming a north-south compositional gradient, with magnetite/pyrrhotite dominating in the north and hematite in the south.
In order to analyze how these river-borne terrigenous magnetic sediment particles are distributed by marine currents and deposited on the seafloor, we report detailed studies of magnetic mineralogy of SCS sediments in a set of core tops widely distributed from east to west and from north to south. The resulting compositional patterns are compared to those obtained from riverine sediment samples to unveil source-to-sink transport processes of magnetic particles in the SCS and the role played by processes on the broad modern shelf.
2. Climatic, Oceanic, and Sedimentary Context
The SCS extends along a NE-SW axis from ~22°N up to the equator and from 105°E to 120°E (Figure 1). The SCS and its surroundings belong to regions receiving the worldwide highest annual rainfall values, which, in combination with modest evapotranspiration, maximizes land runoff (Milliman & Farnsworth, 2011). The SCS receives sediments from three of the largest rivers in the world (Pearl River, Red River, and Mekong River) and from a series of smaller but very active mountain rivers in Malay Peninsula, Sumatra, Borneo, Luzon, and Taiwan. The tectonic regime and geology of the river catchments are highly variable, and they impact the composition of the terrigenous sediments that are mobilized and drained into the sea mainly during the rainy season. In the northern regions, the heaviest precipitation occurs in summer with typhoons dominating the sediment mobilization along the mountain rivers of Taiwan, while precipitation at low latitudes is fairly continuous during the year.
The sedimentary discharge has been measured in all regions surrounding the SCS, except for Sumatra and Borneo, and adds up to about 650 Mt/year at present (Milliman & Farnsworth, 2011). These sediments are delivered to the continental shelf, which is wide along the northwestern margin of the SCS, narrow off Central Vietnam, and wide again at the shallow Sunda shelf in the south (J. Liu et al., 2010; Hanebuth et al., 2011; Sathiamurthy & Voris, 2006; Szczuciński et al., 2009, 2013; Yao et al., 2009).
Beyond the shelf, the terrigenous sediments may be remobilized and transported by various currents down to their site of deposition as seen in the North Atlantic (Kissel et al., 2009). Near the sea surface, suspension transport is controlled by the buoyancy of riverine freshwater displaced by seasonally changing winds (Hu et al., 2000; P. X. Wang, Wang, Cheng, et al., 2017). In the northeast, transport is influenced by the Kuroshio current (Hu et al., 2000; Qu, 2000) that enters the SCS from the Pacific through the Luzon strait. Along the western coastline of the SCS, the surface currents seasonally reverse, being southward (northward) directed during winter (summer; Hu et al., 2000).
At greater water depths, the upper Pacific deep waters enter from the Pacific through the Luzon strait into the SCS where they circulate as—in part erosive—cyclonic boundary current along the northern basin margin below ~1,500 m (Lüdmann et al., 2005; Sarnthein et al., 2013). In the southwestern basin, these deep waters upwell, forming an intermediate layer (750–1,500 m) that flows in the opposite direction and exits the SCS through the Luzon strait (Qu, 2000; Qu et al., 2006). Simulations indicate that this three-layer circulation undergoes seasonal changes in intensity being stronger at the surface during winter and at greater depths during summer (Gan et al., 2016).
The large geographical extension of the SCS over different regional, monsoon-controlled climatic zones (P. X. Wang, Wang, Cheng, et al., 2017), as well as the geologic and tectonic heterogeneity of catchment regions (Clift, 2015), leads to a clear differentiation of sediment particles being delivered to the SCS. This heterogene-ity is reflected in the magnetic fraction of modern river sediments hitherto identified. It appears that low- to medium-coercivity (magnetically soft) minerals such as magnetite (Luzon, Taiwan, and Pearl River) and minor pyrrhotite contributions (Taiwan) dominate in the north, while high-coercivity minerals, in particular hema-tite, dominate in the south (Mekong, Malay Peninsula, and Borneo). Both magnetic end-members occur in Red River sediments, while in the southern SCS, only sediments from Sumatra are rich in magnetite. Few studies have investigated the magnetic mineralogy of the Pearl River delta (Ouyang et al., 2013) and the Red River delta (Nguyen et al., 2016), and little has been done on samples beyond the delta regions. Only the lowfield magnetic susceptibility of different grain size fractions has been analyzed mainly on the shelves (J. Liu et al., 2010), and the mineralogical variety of the magnetic fraction in the sediment discharge from land has been neglected. Here wefill the gap with a complete magnetic mineralogy characterization of a set of core top samples further offshore, which we compare with known properties from specific source areas. In this way we try to constrain the transport paths of magnetic sediment particles over the continental slope and deep basins, for a better understanding of source-to-sink processes in the SCS.
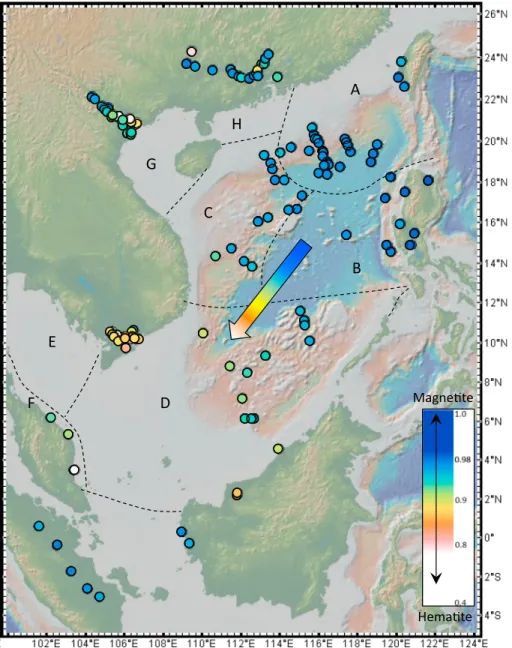
Figure 1. Map of Southeast Asia and the South China Sea (source: GeoMapApp) showing the location of the core top samples (in red) and those of the previously studied river samples (white). The dashed lines and associated letters are for the depth transects discussed in the text.
3. Material, Sampling, and Methods
We investigated the magnetic properties of 55 core top samples distributed in space and depth all over the SCS. They were collected during various cruises: R.V. Sonne cruise 95 (Sarnthein et al., 1994); WEPAMA (Bassinot & Baltzer, 2002), Marco Polo (Laj et al., 2005), and CIRCEA (Kissel et al., 2012) on board R.V. Marion Dufresne and ODP Leg184 on board R.V. Joides Resolution (P. X. Wang et al., 2000). The majority of core tops (44) are located in the northern basin (between 14°N and 21°N), and 11 sites are in the southern basin (between 6°N and 12°N), both on the eastern and western sides (Figure 1). The water depths of the samples vary between 330 and 4,220 m (supporting information Table S1). The great majority of sites (46) lie between 800 and 3,500 m. and they consist of hemipelagic clay (L. Wang et al., 1999). Five additional hemipelagic samples were collected between 3,500 and 4,200 m, that is, below the carbonate compensation depth (R. H. Chen et al., 2003). All core tops are located in the province of uniform suspension (as defined by Zhong et al., 2017, on the basis of sedimentary grain sizes) and/or in the transition zone between this uniform suspension and shal-low areas with high traction. Only four sites are from water depths<700 m (supporting information Table S1). The two shallowest of them are composed of silty sediments from the high traction area (L. Wang et al., 1999). The top material of (mostly) spade box cores from the R.V. Sonne or of CAlypso SQuare (CASQ) cores from the R.V. Marion Dufresne), corresponding to modern deposition, was sampled using small cubic plastic boxes (2 × 2 × 2 cm). The samples were analyzed at the Laboratoire des Sciences du Climat et de l’Environnement using procedures described in the supporting information. The measured parameters give access to different magnetic properties. All the magnetizable particles contribute to the lowfield magnetic susceptibility whatever their size and nature, while only the magnetization of thefine magnetite grains are mobilized by the anhysteretic remanent magnetization (ARM) and that of all ferromagnetic particles (s.l.) by the isothermal remanent magnetization (IRM). The behavior of these two remanent magnetizations upon alternatingfield demagnetization and the S-ratio yield information about the average coercivity (magnetic hardness) of the samples. Coercivity mixtures are deciphered by decomposing the IRM acquisition curves into cumulative Gaussian curves or by analyzingfirst-order reversal curves (FORC). The most usual iron oxides or sulfides carrying the coercivity families identified by the previous experiments are assessed by determin-ing their Curie temperature (~580°C for magnetite and 675°C for hematite) or transformation temperature (for sulfides) during thermal demagnetizion (three-axis IRM). When magnetite is the dominant mineral, its grain size is accessed by comparing ARM and IRM and also by comparing the magnetization ratio (Mrs/Ms)
to the coercivity ratio (Bcr/Bc) retrieved from the magnetic hysteresis curves (the so-called Day diagrams).
The numerical values of these parameters can be found in the supporting information Table S1.
4. Results
A number of magnetic analyses have been selected in order to decipher the magnetic mineralogy of the sediment samples and in particular to determine (i) their coercivity spectra, (ii) which magnetic mineral is associated with each coercivity fraction, and (iii) the relative proportion of each mineral in the samples. Stepwise alternatingfield (AF) demagnetization curves of ARM are characterized by rather uniform sigmoidal shapes with a medium destructivefield (MDFARM) between 16 and 32 mT (average around 23 mT) with the
exception of sample 17920, markedly influenced by the Pinatubo ash fall close to Luzon, which presents an exponential curve with MDFARM= 6 mT (Figure 2a). An average of 1.3% of the initial ARM remains after
demagnetization at 80 mT (%ARM80mTfrom 0.1% to 7.4%; Figure 2a). During AF stepwise demagnetization,
the decay rates of IRM are slightly more scattered than those observed for ARM, with systematically lower MDF values (Figure 2b). On the other hand, the IRM remaining after demagnetization at 80 mT (%IRM80mT) is systematically larger (3.2–12.3%) than the ARM case (Figure 2b).
The Day diagram (Figure 2c) points to a distribution of domain states between midsized pseudosingle domain particles (PSD) and small multidomain (MD) particles, parallel to the SD-MD mixing curves of Day et al. (1977) and Dunlop (2002). ARM ratios (χARM/IRM, Figure 2d), on the other hand, range between 0.2
and>1 mm/A. Values around 0.2 and 0.5 mm/A, in combination with MDFARMvalues of 20–30 mT, are typical
for detrital magnetite components (Egli, 2004). These high values ofχARM/IRM are characteristic for
single-domain (SD) magnetite (Egli, 2004), which could represent the lower tail of a broad grain size distribution or an independent source of ultrafine magnetite.
These experiments show that low-coercivity particles are present in all the samples and they are mixed in variable proportions with high-coercivity minerals. No gyroremanence is found at high AF peakfields, indicat-ing that greigite is most likely absent in our samples (Roberts et al., 2011). No further information on the mag-netic mineralogy can be obtained from these room temperature measurements.
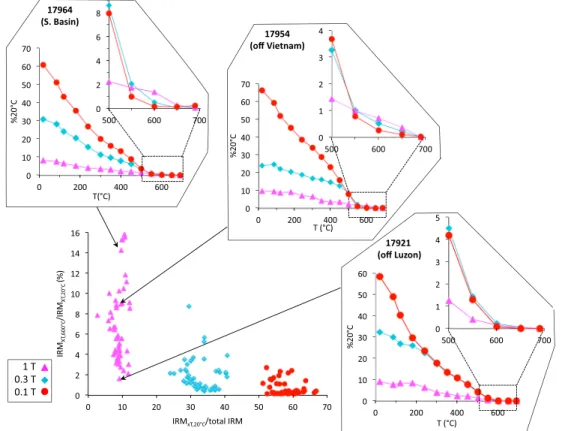
Therefore, we examined the results from the thermal stepwise demagnetizations of three-axis IRM (Lowrie, 1990; supporting information). On average, the 0.1 T, 0.3 T, and 1 T axes carry about 58%, 33%, and 9% of the total IRM, respectively (Figure 3). While the 0.1 T component is fully demagnetized between 550 and 600°C (IRM0.1T,600°C/IRM0.1T,20°C < 2.7%), the 0.3 T component and especially the 1 T component require
higher temperatures to be fully demagnetized (IRM0.3T,600°C/IRM0.3T,20°Cand IRM1T,600°C/IRM1T,20°Cbetween 9% and 16%, respectively; Figure 3). Both components, however, are entirely removed between 650 and 690°C. No significant change of the thermal decay rate is observed at 120°C for the high-coercivity compo-nent, excluding large contributions of remanence-carrying goethite. Likewise, the absence of a transition in the decay rate of the low- and medium-coercivity components around 300–350°C excludes the presence of significant amounts of iron sulfides, which would alter in this temperature range (Dekkers et al., 2000). In summary, the full demagnetization of the low-coercivity fraction around 580°C and that of the high-coercivity fraction at 690°C reveals that all samples are binary mixtures of magnetite and hematite in variable proportions.
Decomposition in cumulative log Gaussian (CLG) curves of the high-resolution IRM acquisition profiles allows us to estimate the proportions in which these two fractions may contribute to the total IRM (Kruiver et al., 2001; Robertson & France, 1994; supporting information). Four coercivity families have been defined (Figure 4). The first one (CLG1) with the lowest medium acquisition field (B1/2 between 2 and 4 mT)
contributes<9% to total IRM and corresponds to the first points of the IRM acquisition curve. It probably
Figure 2. Stepwise alternatingfield demagnetization curves of ARM (a) and IRM (b). The curve of sample 17920 off Luzon is indicated (see text). (c) Hysteresis parameters reported as magnetization ratio (Mrs/Ms) versus coercivity ratio (Bcr/Bc)
following Day et al. (1977) and Dunlop (2002). SD, PSD, and MD are for single domains, pseudosingle domains, and multidomains, respectively. The dashed line is the SD-MD mixing line according to Dunlop (2002). (d) Distribution of χARM/IRM versus MDFARM. EX, D and BS are for extracellular magnetite, detrital magnetite, and soft biosomes, respectively
(see Egli, 2004). Colors and symbols are the same in (c) and (d). ARM = anhysteretic remanent magnetization; IRM = isothermal remanent magnetization; MDF = medium destructivefield.
represents the low-coercivity tail of the well-defined (dispersion parameter [DP] ~ 0.3) second component CLG2(15< B1/2< 20 mT; Figure 4), whose coercivity distribution is strongly non-Gaussian (Egli, 2004). This
low-coercivity family CLG1 + 2 contributes some 22–42% to total IRM. The third component CLG3 with
47< B1/2< 71 mT contributes by 45–74% to the total IRM. It is defined by an average DP value similar to that of CLG2(~0.3). These three components are fully within the coercivity range of magnetite (Dunlop &
Ozdemir, 1997), in contrast with the high-coercivity component CLG4, the coercivity range of which (250< B1/2< 800 mT) is typical of hematite (Dunlop & Ozdemir, 1997). This component is not always
well-constrained, due to its weak contribution to the total IRM, and we considered it as significant only when it was associated with a DP value≤0.7 (0.5 on the average). It contributes by up to 17% to total IRM.
The magnetic properties of all samples are summarized in Figure 5 where several parameters are plotted against the S-ratio (King & Channell, 1991), which is a measure of the relative contribution of low-coercivity minerals (magnetite in our case) to Mrs(or IRM). The parameters related to the high-coercivity component (%IRMCLG4[Figure 5f] and IRM1T,600°C/IRM1T,20°C[Figure 5g]) depend linearly on the S-ratio. In contrast, most
of the parameters related to the low-coercivity components (Figures 5a–5e and 5h) clearly mark a threshold at S-ratio≈ 0.92. These abrupt changes across S-ratio ≈ 0.92 cannot be explained only in terms of binary mix-tures of different coercivity components, because bulk coercivity parameters (e.g., Figures 5a and 5b) would vary smoothly with the S-ratio. The same reasoning applies to grain size parameters: for instance, Mrs/Ms (Figure 5h) would not decrease abruptly above S-ratio≈ 0.92 in case of a binary mixture of coarse low-coercivity particles andfine high-coercivity ones. These observations, altogether, require some grain size-related changes of one or more magnetite components that would explain the trends observed in the Day diagram and inχARM/IRM (Figures 2c and 2d).
Figure 3. Results from the three-axis IRM stepwise thermal demagnetization reported as a scatterplot (bottom left), where the percent of magnetization remaining along each axis after demagnetization at 600°C with respect to 20°C
(%IRMxT,600°C/IRMxT,20°C) is shown versus the respective percentage of each axis in the total IRM at 20°C (IRMxT,20°C/total
IRM). Three examples of thermal decay curves are shown, and for each of them, an enlarged view is given for temperatures above 500°C. The arrows indicate the position of the results obtained for their 1 T axis on the scatterplot. IRM = isothermal remanent magnetization.
For S-ratios lower than 0.92, the scatter of the data is largely reduced and MDFIRM, Bc, and %IRM80mTare larger than their average value for S-ratio
>0.92. This indicates a significantly larger hematite content (Figure 5). The percentage of CLG3is reduced to about 55%, while %CLG1 + 2does not significantly change.
Components CLG1and CLG2most likely correspond to detrital magnetite,
while the origin of component CLG3is unclear. The medianfield of CLG3is compatible with the soft magnetofossil component BS described by Egli (2004); however, the dispersion parameter is significantly larger. If CLG3
were only related to magnetite of biogenic origin, one would expect the average magnetic grain size to increase (i.e., Mrs/Ms to decrease) when CLG3decreases, while the opposite trend is observed (Figure 5h). In order
to clarify the origin of the low-coercivity components, we performed high-resolution FORC analyses on a representative sample with 39% of CLG1+2
contribution and 60% of CLG3contribution. The FORC diagram obtained
using the VARIFORC software (Egli, 2013) shows the typical signature of PSD particles, consisting in triangular-shaped contour lines, superimposed to a weak central ridge associated with noninteracting single-domain par-ticles (supporting information Figure S1). The coercivity distribution of the central ridge is compatible with the presence of magnetofossils. The cen-tral ridge, however, explains only ~2% of the saturation remanence of the low-coercivity components CLG1+2+3, which are therefore almost entirely
associated with PSD magnetite particles.
5. Discussion
The geographical distribution and variability with depth of the magnetic properties of the surface SCS sediment, and their comparison with river-borne samples and with other available sedimentologic tracers, allow us to reconstruct the pathways of the magnetic particles.
5.1. Changes in the Nature of Magnetic Grains Depending on the Geographical Position and Depth in the SCS
As mentioned above, the S-ratio, %CLG4, and %IRM1T,600°C/IRM1T,20°C
indicate the relative proportions of magnetite and hematite. When these three parameters are reported on maps, it appears that the magnetic mineralogy of modern sediments in the SCS basin clearly changes from north to south (Figure 6).
Offshore Luzon, low-coercivity minerals (S-ratio ~ 1, Figure 6a) are the dominant magnetic carrier, and in the absence of iron sulfides (see section 4), they correspond to virtually pure magnetite as shown by the full removal of the magnetization around 600°C (Figure 6b). On the northwestern side of the SCS, magnetite is also dominant but with a small contribution of hematite at shallow depth (Figure 6). The southern part of the SCS is the place where hematite is best expressed, illustrated by 16% of the IRM1Tremaining after demag-netization at 600°C (Figure 6b) and by CLG4reaching 17% of the total IRM (Figure 6c). The transition zone is
roughly around 15°N, off Vietnam (Figure 6).
Examining the three parameters together, very limited changes in the magnetic mineralogy are observed along the various depth transects (Figure 6). Only the shallowest silty samples off the Pearl River delta in the northwestern part of the SCS may contain hematite which is not present in the deeper samples from the same area (Figure 6b). These silty samples have magnetic characteristics different from those of the sam-ples distributed along the slope and in the abyssal regions. This is consistent with the observations of J. Liu et al. (2010) that the bulk lowfield magnetic susceptibility of the silty samples does not have any clear mean-ing in terms of paleoenvironments. Except for these shallow water samples, no changes are observed along the depth transects between 800 and 4,200 m neither in magnetite-rich northern areas nor in hematite-rich
Figure 4. Examples of decomposition of the IRM acquisition curves in cumu-lative log Gaussian curves for three samples from the northern basin, the center basin, and the southern basin (using the software proposed by Kruiver et al., 2001). The diagrams are the gradient acquisition plots (GAP). The gray, green, blue, and red curves correspond to CLG1, CLG2, CLG3, and CLG4,
southern ones, indicating that the magnetic fraction is uniformly dispersed along the slope at different depths. Finally, magnetite grain sizes do not appear to change systematically with depth, maintaining a broad size distribution from PSD to small MD range (Figures 2c and 6d). Only the samples from the southern basin arefiner, in the middle PSD size, and they do not show any significant changes with depth (Figure 6d).
5.2. Changes in the Amounts of Magnetic Grains Depending on the Geographical Position and Depth in the SCS
Concentration-dependent magnetic parameters, that is, ARM,χ, and IRM, vary in the SCS by a factor of 30, 195, and 144, respectively. Based on lowfield magnetic susceptibility, J. Liu et al. (2010) have concluded that the dilution of magnetic particles by nonmagnetic components is less important in hemipelagic clayey sam-ples than in quartz-rich ones. However, other dilutants such as biogenic CaCO3may also play a role in hemi-pelagic sediments. In the SCS, carbonate content is generally low on the shelves (<10%) and averages between 10% and 30% in the rest of the basin except close to the coral reefs where it exceeds 30% (P. X. Wang, et al., 2014). Our samples are collected in areas where CaCO3ranges between 10% and 30% so that
dilution can hardly account for the amplitude of the changes observed in the bulk magnetic parameters. Therefore, the main dilutant of the magnetic fraction is most likely within the terrigenous components which, due to different physical properties, may be transported and distributed differently than the magnetic dense particles.
The highest values of ARM (~0.2 mAm2/kg), IRM (16 to 25.3 mAm2/kg), andχ (81 to 273 × 10 8m3/kg) are obtained off Luzon Island (Figure 7). They indicate that very large amounts of purefine-grained magnetite are deposited in this area. The samples south of Taiwan are the second group in amplitude (ARM and IRM of 0.12 and 5 mAm2/kg, respectively, andχ of 33 × 10 8m3/kg), while slightly lower values are observed for the group off the Pearl River mouth (ARM and IRM of 0.08 and 1.8 mAm2/kg, respectively, andχ of 11 × 10 8 m3/kg; Figure 7). This rather high level of magnetization suggests that Taiwan and southern China likely also deliver magnetite in relatively large amount to the northern part of the SCS. It is also likely that thefinest magnetite grains originating from the western margin of Luzon are transported northward by the Luzon coastal current and then westward by the Kuroshio current tofinally deposit on the other side of the basin.
Finally, the lowest values are obtained from the southern samples, that is, south of 12°N (~0.08 and 0.9 mAm2/kg on the average for ARM and IRM, respectively, and ~6 × 10 8m3/kg forχ; Figure 7). Given the weak specific magnetization of hematite with respect to magnetite (0.5%; Dunlop & Ozdemir, 1997), the highest CLG4contribution of ~17% (S-ratio ~ 0.86) also found in the southern basin corresponds to about 80% of
hematite in weight (Frank & Nowaczyk, 2008). This greatly impacts the lowfield magnetic susceptibility (χ) and the IRM, both influenced by the different mixtures of magnetic minerals. The relatively low IRM and χ values therefore illustrate a larger abundance of high-coercivity, weakly magnetized hematite mixed with
Figure 5. Multiple magnetic parameters reported versus S-ratio (see text). Median destructivefield (a); Bc(b); %IRM80 mT
(c); %CLG1+2(d); %CLG3(e); %CLG4(f); IRM1T,600°C/IRM1T,20°C(%) (g); Mrs/Ms(h). The dashed lines illustrate average
fine-grained magnetite rather than a decrease in the total magnetic content. Except for the region off Luzon and south Taiwan, thefine-grained magnetite content (see ARM in Figure 7) is relatively uniform in the SCS, and this is likely due to the fact that these particles are transported from farther places in the continent and at sea and therefore arrive at their deposition site with some degree of homogenization.
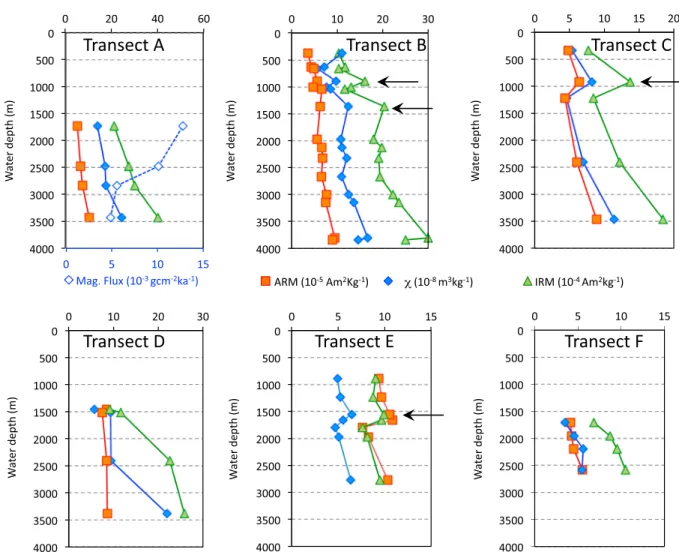
In addition to the north-south gradient, we observe a common pattern in the relation betweenχ, ARM, and IRM on the one hand and water depth on the other hand (Figure 8). Sites shallower than 2,000 m are present only along three transects (B, C, and E; see Figure 1). Within this shallow depth interval, all three parameters peak locally around 1,000 m (transect C), around 1,500 m (transect E) or at both depths (transect B; Figure 8). Below 2,000 m, all three parameters increase monotonically with depth. Very limited information about sedi-mentation rates are available for the core tops except for the northern transect (transect A) where the
Figure 6. Different parameters illustrating the differences in the magnetic mineralogy reported by color codes on the map (source: GeoMapApp). S-ratio (a); %IRM1T,600°C/IRM1T,20°C(b); %CLG4defined with a dispersion parameter (DP) ≤ 0.7 (c).
The depth profile of the Mrs/Msratio illustrating magnetite grain size is given in (d), and the letters are those of the depth
Figure 7. Distribution of the bulk magnetic parameters versus the latitude of the sites. The high values highlighted by the dashed contoured clouds are from off Luzon, and those highlighted by the solid edged clouds are those south of Taiwan.
Figure 8. Distribution of the various bulk magnetic parameters along the depth transects labeled in Figure 1. Horizontal black arrows indicate the maxima at 1,000 and 1,500 m.
sedimentation rate decreases when depth increases (L. Wang et al., 1999). When the magneticflux is calcu-lated for this transect, the profile reverses as shown in Figure 8 (transect A). This may illustrate a preferential deposition of the magnetic particles at proximate location to the source whilefiner and lighter particles are transported farther. It also indicates that bulk magnetic parametersfirst have to be corrected for any dilution effect (sedimentation rate) before being used to trace modern transport and dynamics of water masses. On the contrary, the magnetic mineralogy, uniform along each depth profile below 800 m but geographically varying from north to south, can be used as an environmental tracer when compared with the results pre-viously obtained from the river-borne samples.
5.3. Pathways of the Magnetic Particles
The main magnetic minerals observed in the river samples from all around the SCS are magnetite and hema-tite with some pyrrhohema-tite contribution around Taiwan (Kissel et al., 2016, 2017). At sea, pyrrhohema-tite is mainly identified in core tops from the Taiwan Strait (Horng & Huh, 2011; Horng et al., 2012) and it probably deposits on the shelves together with illite and chlorite characterizing the Taiwanese clay source (Z. Liu et al., 2016). The proportion of the two main magnetic minerals, magnetite and hematite, found in the core tops and in the river sediments, is however largely different between land and sea. This is shown in Figure 9 with the S-ratio, which is the best parameter to illustrate their relative proportions, using the same color code for both river sediments and core top samples. Pure magnetite originating from eroded magnetite-rich basaltic rocks taken by the Luzon rivers is fully deposited at sea. From this northern magnetite end-member, a southward increase in hematite content is observed in both environments. However, while S-ratios vary between 1 and 0.4 in riverine sediments, the minimum value obtained from the core tops is as high as 0.86. The N-S gra-dient observed on land is, in a way, damped in the marine environment. The quasi-pure hematite composi-tion observed in the Mekong River and in Borneo, for example, is not found in the surface marine sediments of the southern basin. This emphasizes the role played by the wide and shallow continental shelves in the sequestration of a significant part of the river sediments (Clift, 2015; Duc et al., 2007; Dung et al., 2013; J. Liu et al., 2010; Steinke et al., 2008; Szczuciński et al., 2013). In the southernmost part of the SCS, magnetite-rich sediments originating from the basaltic rocks in Sumatra are also trapped on the Sunda shelf as they obviously do not reach the SCS basin.
On the shelves, sediments delivered by the different rivers are mixed and transported by along-shore currents (Zhong et al., 2017). The sediment found on the continental slope and in the deep basin may there-fore not result from a single river input. However, the regional magnetic composition of river sediments is relatively uniform, so that the zone of provenance, if not the specific river, can be defined. In the southern part of the SCS, hematite originates from the Mekong and from Borneo rivers. Its weaker expression at sea compared to surrounding source rivers results from its deposition on the shelves, even if delivery to the sea is not completely stopped there. Indeed, our results show that part of thefine terrigenous material carrying the magnetic fraction through the shelf is transported beyond it and deposits along the slope and into the deep basin. In the south, the proximal hematite-rich material mixes with magnetite, always present, possibly transported from northern sites. Magnetite efficiently dilutes (but does not overprint) the weak magnetization of hematite originating from the rivers.
So far, besides the mapping of the lowfield magnetic susceptibility in particular on the shelves by J. Liu et al. (2010) and in the southern basin by Z. Chen et al. (2009) for the specific study of hydrocarbon-bearing zones, only the clay minerals have been analyzed in widely distributed core tops and compared to river clay composition (Z. Liu et al., 2016, and references therein). As shown by the coupled analyses of the clay and magnetic fractions in river sediments, the two proxies carry complementary information about the provenance area (Kissel et al., 2016, 2017; Z. Liu et al., 2016).
Using the full magnetic information collected in the river sediments, along the continental slope, and in the deep basins, we can therefore reconstruct the path of the magnetic fraction of sediment and compare it with the description of the source-to-sink processes of clay minerals (Z. Liu et al., 2016). Our areas of investigation correspond to zones A (south Taiwan), B (off Luzon), C (between A and D), and D (southern SCS) defined by Z. Liu et al. (2016) on the basis of the average content of clay minerals (Figure 9). In zone B, the high smectite content in the clay assemblage is associated with the largest amounts of pure magnetite. Smectite and magnetite consistently trace early weathering and erosion, respectively, of the igneous (mainly basaltic)
rocks from Luzon. They may also include volcanic ash layers produced in 1991 (therefore quasi the core tops) by the last eruption of the Pinatubo volcano and deposited in this area by dominant winds (Wiesner et al., 2004). However, large amounts of magnetite, again associated with high smectite content, observed even north of the main volcanic panache, show that the material does not only derive from volcanic events but that it is also delivered by the rivers, transported along the coastline by the northward Luzon coastal current before it encounters the Kuroshio current entering the Luzon strait. On the northwestern side of the SCS, the magnetic fraction is also dominated by magnetite, although in weaker concentration with respect to Luzon. In this area, the clays allow to distinguish the Taiwan source (illite with low cristallinity and chlorite) from the Pearl River one (kaolinite plus illite with high cristallinity). The magnetic mineralogy seems to be less discriminant in the deep basin, although Ouyang et al. (2017) concluded that in the very shallow (<100 m) sea adjacent to the Pearl River estuary, magnetic properties are more informative about the provenance area than the clay minerals.
Figure 9. Distribution of the S-ratio in the same color code for marine and river samples from 1 (magnetite end-member) to 0.4 (hematite end-member). The NE-SW colored arrow summarizes the average mineralogical changes consistently with the color scale of the S-ratio. The dashed lines and letters are for the different zones defined by Z. Liu et al. (2016) on the basis of the average content of clay minerals (see text).
By contrast, the magnetic mineralogy is more discriminant than the clay assemblages in the southern part of the SCS. Zones C and D, which have on average very similar clay composition, clearly differ by their magnetic composition, because of the above mentioned southward enrichment in hematite. J. Liu et al. (2010) claimed that the Red River contribution to the deepwater deposition is minimal, despite observing relatively high low-field susceptibility values in the fine fraction of the Beibu Gulf. Our results indicate that the Red River sediments, intermediate in magnetic composition between the magnetite-rich sediments from the Pearl River and the hematite-rich sediments from the Mekong, indeed reach the deep basin south of Hainan. In the southern basin, the Mekong does not have any clear signature in the clay mineralogy, while together with Borneo, it has a very clear magnetic signature which is presently propagated to the deep basin.
6. Summary and Conclusion
Different proportions of magnetite/hematite are observed in the modern sediments deposited in the SCS with a progressive southward increase in hematite content. This reflects the changes already observed in the rivers from Luzon-Taiwan-Pearl River in the north to Mekong-Borneo in the south. This gradient allows us to define the terrestrial origin of the sediments. However, the contrast between north and south is weakened at sea, indicating that the present distribution of magnetic minerals in the SCS results both from the trapping of the river-borne sediments on the shelf and from an active transport along the slope and in the deep basin. In the northern basin, the transport results from surface currents in the northern part of the SCS, involving the Luzon coastal current, from the Kuroshio current, and from the deepwaterflow invading also this area. Mixing might occur in the northwestern part via cyclonic eddies mixing surface and deep waters as those evidenced by Zhang et al. (2014).
In the southern basin, the clear signature of central and north Borneo rivers and of the Mekong is mixed with northern-source-like material. It is most likely related to an active southward transport of northern-sourced terrigenous sediments on the shelf during winter, when the surface current is strong, as well as by the deepwater masses.
These results are thefirst ones characterizing the full spectrum of magnetic properties of modern marine sediment in the SCS and provide a tool to characterize the modern source-to-sink pathways of the sediments.
References
Bassinot, F., & Baltzer, A., (2002). WEPAMA, MD 122-IMAGES VII cruise report, IPEV. In Les rapports des campagnes à la mer, ISSN [1636–8525], 2002, 01.
Chen, Q., Kissel, C., & Liu, Z. (2017). Late Quaternary climatic forcing on the terrigenous supply in the northern South China Sea: Input from magnetic studies. Earth and Planetary Science Letters, 471, 160–171. https://doi.org/10.1016/j.epsl.2017.04.047
Chen, R. H., Jian, X., Yi, M., & Wang, D. J. (2003). Microfossils, carbonate lysocline and compensation depth in surface sediments of the northeastern South China Sea. Acta Oceanologica Sinica, 22, 597–606.
Chen, Z., Yan, W., Tang, X. Z., Liu, J. G., Chen, M. H., & Yang, H. P. (2009). Magnetic susceptibility in surface sediments in the southern South China Sea and its implication for sub-sea methane venting. Journal of Earth Science, 20, 193–204.
Clift, P. D. (2015). Assessing effective provenance methods forfluvial sediment in the South China Sea. In P. D. Clift, et al. (Eds.), River-dominated shelf sediments of East Asian seas. Geological Society, London, Special Publications (Vol. 429, pp. 9–29). https://doi.org/10.1144/ SP429.3
Day, R., Fuller, M., & Schmidt, V. A. (1977). Hysteresis properties of titano-magnetite: Grain-size and compositional dependence. Physics of the Earth and Planetary Interiors, 13(4), 260–267. https://doi.org/10.1016/0031-9201(77)90108-X
Dekkers, M. J., Passier, H. F., & Schoonen, M. A. A. (2000). Magnetic properties of hydrothermally synthesized greigite (Fe3S4)—II. High- and
low-temperature characteristics. Geophysical Journal International, 141(3), 809–819. https://doi.org/10.1046/j.1365-246x.2000.00129.x Duc, D. M., Nhuan, M. T., Van Ngoi, C., Nghi, T., Tien, D. M., van Weering, T. C. E., & van den Bergh, G. D. (2007). Sediment distribution and
transport at the nearshore zone of the Red River delta, northern Vietnam. Journal of Asian Earth Science, 29(4), 558–565. https://doi.org/ 10.1016/j.jseaes.2006.03.007
Dung, B. V., Stattegger, K., Unverricht, D., Van Phach, P., & Thanh, N. T. (2013). Late Pleistocene–Holocene seismic stratigraphy of the Southeast Vietnam shelf. Global and Planetary Change, 110, 156–169. https://doi.org/10.1016/j.gloplacha.2013.09.010
Dunlop, D. J. (2002). Theory and application of the day plot (Mrs/Msversus Hcr/Hc) 1.Theoritical curves and tests using titanomagnetite data.
Journal of Geophysical Research, 107, 2056. https://doi.org/10.1029/2001JB000486
Dunlop, D. J., & Ozdemir, O. (1997). Rock magnetism: Fundamentals and frontiers (p. 573). New York: Cambridge University Press. https://doi. org/10.1017/CBO9780511612794
Egli, R. (2004). Characterization of individual rock magnetic components by analysis of remanence curves. 3. Bacterial magnetite and natural processes in lakes. Physics and Chemistry of the Earth, 29(13-14), 869–884. https://doi.org/10.1016/j.pce.2004.03.010
Egli, R. (2013). VARIFORC: An optimized protocol for the calculation of non-regularfirst-order reversal curve (FORC) diagrams. Global and Planetary Change, 110, 302–320. https://doi.org/10.1016/j.gloplacha.2013.08.003
Frank, U., & Nowaczyk, N. R. (2008). Mineral magnetic properties of artificial samples systematically mixed from haematite and magnetite. Geophysical Journal International, 175(2), 449–461. https://doi.org/10.1111/j.1365-246X.2008.03821.x
Acknowledgments
This work has been developed within the framework of the French-Chinese International Associated
Laboratory-MONOCL (Monsoon, Ocean, and Climate). We are very grateful to Kais Jacob Mohamed Falcon and to Eduard Petrovski for their careful and very constructive reviews. Fundings are from the French National Inter-institutes LEFE-IMAGO program (project MONOCL) and from the Institut National des Sciences de l’Univers, Centre National de la Recherche Scientifique in France. The numerical data used in this article can be found in the supporting information (Table S1).
Gan, J., Liu, Z., & Hui, C. (2016). A three-layer alternating circulation in the South China Sea. Journal of Physical Oceanography, 46(8), 2309–2315. https://doi.org/10.1175/JPO-D-16-0044.1
Hanebuth, T. J. J., Voris, H. K., Yokoyama, Y., Saito, Y., & Okuno, J. (2011). Formation and fate of sedimentary depocentres on Southeast Asia’s Sunda Shelf over the past sea-level cycle and biogeographic implications. Earth-Science Reviews, 104(1-3), 92–110. https://doi.org/ 10.1016/j.earscirev.2010.09.006
Horng, C. S., & Huh, C. A. (2011). Magnetic properties as tracers for source-to-sink dispersal of sediments: A case study in the Taiwan Strait. Earth and Planetary Science Letters, 309, 141–152.
Horng, C. S., Huh, C. A., Chen, K. H., Lin, C. H., Shea, K. S., & Hsiung, K. H. (2012). Pyrrhotite as a tracer for denudation of the Taiwan orogen. Geochemistry, Geophysics, Geosystems, 13, Q08Z47. https://doi.org/10.1029/2012GC004195
Hu, J., Kawamura, H., Hong, H., & Qi, Y. (2000). A review on the currents in the South China Sea: Seasonal circulation, South China Sea warm current, and Kuroshio Intrusion. Journal of Oceanography, 56(6), 607–624. https://doi.org/10.1023/A:1011117531252
King, J., & Channell, J. E. T. (1991). Sedimentary magnetism, environmental magnetism, and magnetostratigraphy. In U.S. National Report to International Union Geodesy and Geophysics. Review of Geophysics Supplement, 29, 358–370.
Kissel, C., Jian, Z., & Leau, H. (2012). MD190-CIRCEA cruise report. In Les rapports de campagne à la mer. IPEV, Brest.
Kissel, C., Laj, C., Clemens, C., & Solheid, P. (2003). Magnetic signature of environmental changes in the last 1.2 Myr at ODP site 1146, South China Sea. Marine Geology, 201(1-3), 119–132. https://doi.org/10.1016/S0025-3227(03)00212-3
Kissel, C., Laj, C., Kienast, M., Bolliet, T., Holbourn, A., Hill, P., et al. (2010). Monsoon variability and deep oceanic circulation in the western equatorial Pacific over the last climatic cycle: Insights from sedimentary magnetic properties and sortable silt. Paleoceanography, 25, PA3215. https://doi.org/10.1029/2010PA001980
Kissel, C., Laj, C., Mulder, T., Wandres, C., & Cremer, M. (2009). The magnetic fraction: A tracer of deep water circulation in the North Atlantic. Earth and Planetary Science Letters, 288(3–4), 444–454. https://doi.org/10.1016/j.epsl.2009.10.005
Kissel, C., Liu, Z., Li, J., & Wandres, C. (2016). Magnetic minerals in three Asian rivers draining into the South China Sea: Pearl, Red and Mekong Rivers. Geochemistry, Geophysics, Geosystems, 17, 1678–1693. https://doi.org/10.1002/2016GC006283
Kissel, C., Liu, Z., Li, J., & Wandres, C. (2017). Magnetic signature of river sediments drained into the southern and eastern part of the South China Sea (Malay Peninsula, Sumatra, Borneo, Luzon and Taiwan). Sedimentary Geology, 347, 10–20. https://doi.org/10.1016/j.sedgeo.2016. 11.007
Kissel, C., Van Toer, A., Laj, C., Cortijo, E., & Michel, E. (2013). Variations in the strength of the North Atlantic bottom water during Holocene. Earth and Planetary Science Letters, 369-370, 248–259. https://doi.org/10.1016/j.epsl.2013.03.042
Kruiver, P. P., Dekkers, M. J., & Heslop, D. (2001). Quantification of magnetic coercivity components by the analysis of acquisition curves of isothermal remanent magnetisation. Earth and Planetary Science Letters, 189(3-4), 269–276. https://doi.org/10.1016/S0012-821X(01)00 367-3
Laj, C., Wang, PX., & Balut, Y. (2005). MD 147/Marco Polo 1-IMAGESXII cruise report. In Les rapports de campagne à la mer, IPEV, ref: OCE/2005/ 02.
Liu, J., Chen, Z., Chen, M., Xiang, W. Y., & Tang, X. (2010). Magnetic susceptibility variations and provenance of surface sediments in the South China Sea. Sedimentary Geology, 230(1-2), 77–85. https://doi.org/10.1016/j.sedgeo.2010.07.001
Liu, Z., Zhao, Y., Colin, C., Stattegger, K., Wiesner, M. G., Huh, C. A., et al. (2016). Source-to-sink processes offluvial sediments in the South China Sea. Earth-Science Reviews, 153, 238–273. https://doi.org/10.1016/j.earscirev.2015.08.005
Lowrie, W. (1990). Identification of ferromagnetic minerals in a rock by coercivity and unblocking temperature properties. Geophysical Research Letters, 17, 159–162. https://doi.org/10.1029/GL017i002p00159
Lüdmann, T., Wong, H. K., & Berglar, K. (2005). Upwardflow of North Pacific deep water in the northern South China Sea as deduced from the occurrence of drift sediments. Geophysical Research Letters, 32, L05614. https://doi.org/10.1029/2004GL021967
Milliman, J. D., & Farnsworth, K. L. (2011). River discharge to the coastal ocean: A global synthesis (p. 384). Cambridge: Cambridge University Press.
Nguyen, T. T. H., Zhang, W., Li, Z., Li, J., Ge, C., Liu, J., et al. (2016). Magnetic properties of sediments of the Red River: Effect of sorting on the source-to-sink pathway and its implications for environmental reconstruction. Geochemistry, Geophysics, Geosystems, 17, 270–281. https:// doi.org/10.1002/2015GC006089
Ouyang, T., Appel, E., Jia, G., Huang, N., & Zhu, Z. (2013). Magnetic mineralogy and its implication of contemporary coastal sediments from South China. Environmental Earth Sciences, 68(6), 1609–1617. https://doi.org/10.1007/s12665-012-1854-1
Ouyang, T., Li, M., Appel, E., Fu, S., Jia, G., Li, W., & Zhu, Z. (2017). Magnetic properties of surface sediments from the Pearl River estuary and its adjacent waters: Implication for provenance. Marine Geology, 390, 80–88. https://doi.org/10.1016/j.margeo.2017.06.002
Ouyang, T., Li, M., Zhao, X., Zhu, Z., Tian, C., Qiu, Y., et al. (2016). Sensitivity of sediment magnetic records to climate change during Holocene for the northern South China Sea. Front. Earth Sciences, 4(54). https://doi.org/10.3389/feart.2016.00054
Ouyang, T., Tian, C., Zhu, Z., Qiu, Y., Appel, E., & Fu, S. (2014). Magnetic characteristics and its environmental implications of core YSJD-86GC sediments from the southern South China Sea. Chinese Scientific Bulletin, 59(25), 3176–3187. https://doi.org/10.1007/s11434-014-0438-8 Qu, T. (2000). Upper-layer circulation in the South China Sea. Journal of Physical Oceanography, 30(6), 1450–1460. https://doi.org/10.1175/
1520-0485(2000)030<1450:ULCITS>2.0.CO;2
Qu, T., Girton, J. B., & Whitehead, J. A. (2006). Deepwater overflow through Luzon Strait. Journal of Geophysical Research, 111, C01002. https:// doi.org/10.1029/2005JC003139
Roberts, A. P., Chang, L., Rowan, C. J., Horng, C. S., & Florindo, F. (2011). Magnetic properties of sedimentary greigite (Fe3S4): An update.
Reviews of Geophysics, 49, RG1002. https://doi.org/10.1029/2010RG000336
Robertson, D. J., & France, D. E. (1994). Discrimination of remanence-carrying minerals in mixtures, using isothermal remanent magnetisation acquisition curves. Physics of the Earth and Planetary Interiors, 82(3-4), 223–234. https://doi.org/10.1016/0031-9201(94)90074-4 Sarnthein, M., Pflaumann, U., Wang, P. X., & Wong, H. K. (1994). Preliminary report on Sonne-95 cruise “Monitor Monsoon” to the South China
Sea. Reports, Geol.-Paläont. Inst. Univ. Kiel, Nr. 68, Kiel 1994.
Sarnthein, M., Schneider, B., & Grootes, P. M. (2013). Peak glacial C-14 ventilation ages suggest major draw-down of carbon into the abyssal ocean. Climate of the Past, 9(6), 2595–2614. https://doi.org/10.5194/cp-9-2595-2013
Sathiamurthy, E., & Voris, H. K. (2006). Maps of Holocene sea level transgression and submerged lakes on the Sunda shelf. The Natural History Journal of Chulalongkorn University, 2, 1–44.
Solheid, P. A., Laj, C., & Banerjee, S. K. (2003). Data report: Mineral magnetic properties of sediments from Site 1144, northern South China Sea. In W. L. Prell, et al. (Eds.), Proceedings ODP, Scienific Results (Vol. 184, pp. 1–8).
Steinke, S., Hanebuth, T. J., Vogt, C., & Stattegger, K. (2008). Sea level induced variations in clay mineral composition in the southwestern South China Sea over the past 17000 years. Marine Geology, 250(3-4), 199–210. https://doi.org/10.1016/j.margeo.2008.01.005
Szczuciński, W., Jagodziński, R., Hanebut, T. J. J., Stattegger, K., Wetzel, A., Mitręga, M., et al. (2013). Modern sedimentation and sediment dispersal pattern on the continental shelf off the Mekong River delta, South China Sea. Global and Planetary Change, 110, 195–213. https:// doi.org/10.1016/j.gloplacha.2013.08.019
Szczuciński, W., Stattegger, K., & Scholten, J. (2009). Modern sediments and sediment accumulation rates on the narrow shelf off central Vietnam, South China Sea. Geo-Marine Letters, 29(1), 47–59. https://doi.org/10.1007/s00367-008-0122-6
Wang, L., Hu, S., Yu, G., Ma, M., & Liao, M. (2017). Comparative study on magnetic minerals of tidalflat deposits from different sediment sources in Jiangsu coast, eastern China. Studia Geophysica et Geodaetica, 61(4), 754–771. https://doi.org/10.1007/s11200-016-0375-x Wang, L., Sarnthein, M., Erlenkeuser, H., Grimalt, J., Grootes, P., Heilig, S., et al. (1999). East Asian monsoon climate during the late Pleistocene:
High-resolution sediment records from the South China Sea. Marine Geology, 156(1-4), 245–284. https://doi.org/10.1016/S0025-3227(98) 00182-0
Wang, P. X., Li, Q., & Li, C. F. (2014). Geology of the China Seas. In Developments in Marine Geology (Vol. 6, 687 pp.). Amsterdam, Netherlands: Elsevier. https://doi.org/10.1016/B978-0-444-59388-7.00001-9
Wang, P. X., Prell, W. L., & Blum, P. (2000). Proc. ODP, initial reports, 184, College Station, TX (Ocean Drilling Program). https://doi.org/10.2973/ odp.proc.ir.184.2000
Wang, P. X., Wang, B., Cheng, H., Fasullo, J., Guo, Z. T., Kiefer, T., & Liui, Z. Y. (2017). The global monsoon across time scales: Mechanisms and outstanding issues. Earth-Science Reviews, 174, 84–121. https://doi.org/10.1016/j.earscirev.2017.07.006
Wang, Y., Wang, S., & Liu, M. (2017). Magnetic properties indicate sediment provenance and distribution patterns in the Bohai and Yellow Seas, China. Continental Shelf Research, 40, 84–95.
Wiesner, M. G., Wetzel, A., Catane, S. G., Listanco, E. L., & Mirabueno, H. T. (2004). Grain size, areal thickness distribution and controls on sedimentation of the 1991 Mount Pinatubo tephra layer in the South China Sea. Bulletin of Volcanology, 66(3), 226–242. https://doi.org/ 10.1007/s00445-003-0306-x
Yao, Y. T., Harff, J., Meyer, M., & Zhan, W. H. (2009). Reconstruction of paleocoastlines for the northwestern South China Sea since the Last Glacial Maximum. Science in China Series D: Earth Sciences, 52(8), 1127–1136. https://doi.org/10.1007/s11430-009-0098-8
Zhang, Y. W., Liu, Z. F., Zhao, Y. L., Wang, W. G., Li, J. R., & Xu, J. P. (2014). Mesoscale eddies transport deep-sea sediments. Scientific Reports, 4(1), 5937. https://doi.org/10.1038/srep05937
Zheng, X., Kao, S., Chen, Z., Menviel, L., Chen, H., Du, Y., et al. (2016). Deepwater circulation variation in the South China Sea since the Last Glacial Maximum. Geophysical Research Letters, 43, 8590–8599. https://doi.org/10.1002/2016GL070342
Zhong, Y., Chen, Z., Li, L., Liu, J., Li, G., Zheng, X., et al. (2017). Bottom water hydrodynamic provinces and transport patterns of the northern South China Sea: Evidence from grain size of the terrigenous sediments. Continental Shelf Research, 140, 11–26. https://doi.org/10.1016/j. csr.2017.01.023