HAL Id: hal-01514375
https://hal.archives-ouvertes.fr/hal-01514375
Submitted on 26 Apr 2017
HAL is a multi-disciplinary open access
archive for the deposit and dissemination of
sci-entific research documents, whether they are
pub-lished or not. The documents may come from
teaching and research institutions in France or
abroad, or from public or private research centers.
L’archive ouverte pluridisciplinaire HAL, est
destinée au dépôt et à la diffusion de documents
scientifiques de niveau recherche, publiés ou non,
émanant des établissements d’enseignement et de
recherche français ou étrangers, des laboratoires
publics ou privés.
QSI Models
Assia Kamal Idrissi, Arnaud Malapert, Rémi Jolin
To cite this version:
Assia Kamal Idrissi, Arnaud Malapert, Rémi Jolin. The Route Network Development Problem based
on QSI Models. The 6th International Conference on Operations Research and Enterprise Systems
(ICORES 2017), Feb 2017, Porto, Portugal. pp.3-11. �hal-01514375�
Assia Kamal Idrissi
1, Arnaud Malapert
2and R´emi Jolin
1 1Milanamos, 1047 route des Dolines, Sophia Antipolis, France2Universit´e Cˆote d’Azur, CNRS, I3S, France
{assia.elafouani, remi.jolin}@milanamos.com, [email protected]
Keywords: Airline Schedule Design, Route Network Development, Forecasting demand, Quality of Service Index, Time-independent Model, Graph Database.
Abstract: The growth of air passenger needs has forced airlines to improve their quality of service. Airlines have to choose flight schedules by considering demand, passengers preferences and competitors. The problem of allocating a new flight involves the route network development, and consists to determine a set of (Origin-Destination) pairs to serve and then choose flight schedules with respect to the Quality of Service Index (QSI) model. In this PhD project, we work with a software tool developed by the company Milanamos that helps airline managers to make decisions about destinations to serve. As a starting point, we define the flight radius problem related to this software. It is a sub-problem of the route network development problem and aims to optimize the visualization of the pertinent network by showing only interesting airports regarding QSI model. In this paper, we present the problem of allocating a new flight and formulate the flight radius problem as a problem of finding maximal sub-graph. Our objective is to locate in the network what routes represent business opportunities and are attractive regarding competition so it can be visualized. We construct the graph from Milanamos the database using the time-independent approach and store it in Neo4j a graph database. We describe the process of generating and storing the graph in Neo4j and sum up by outlining the expected outcome.
1 RESEARCH PROBLEM
The growth of air passenger needs has forced airlines to improve their quality of service. At best, the air-lines should offer flights that match the expectations of their passengers. In order to capture a large flow of the passengers, the airlines should focus on airline schedule design which is one of the important com-ponents and evokes complex decisions. It takes the airline passenger demand, airport and aircraft charac-teristics and then generates a selection of flight legs as outputs those maximize the airline company profit subject to resource constraints (aircraft and airport capacity, maximal working hours, minimal ground time,...). A flight leg or segment is defined with three attributes: Origin-Destination (OD) pair (an OD pair is a couple of airports), arrival/departure time and air-craft type (Hall, 2012). Airline schedule design aims to answer the following questions:
• Where to fly?
• How frequently to fly? • When to fly?
• How much capacity to provide on each flight? • What are the competitive choices of flight
sched-ules?
It’s a process with making decisions at different stages about opening new routes or adding new flights which need a demand forecasting that is not always based on historical data when airlines decide to include a new destination. Therefore, demand is calculated and the best decision is chosen to maximize their profit. These decisions are very important for an line, quality of service and prices influence the air-line’s ability to attract travelers. However, we deal with a multi-objective problem. The airline company has to take into consideration the passengers choice. In fact, it may consider criteria such as travel costs, travel time and also the type of flight. For example, a businessman may try to optimize his travel time, a student wants to minimize his costs and a visitor may wish to avoid connecting flight. So, at the end, users have different preferences over the criteria and type of flights is one of these criteria. There are three dif-ferent kinds of flights: non-stop flight, direct flight and connecting flight. A non-stop flight is a single flight with no intermediate stops. It is the preferred choice for most passengers. In the absence of such flights, passengers must take either a direct flight or 3
a connecting flight. A direct flight or through flight is operated by the same aircraft and includes at least one intermediate stop; passengers stay on board dur-ing the trip. Note that the flight number remains the same throughout the trip. A connecting flight requires an aircraft change for passengers in a hub. Thus, the trip includes at least two different planes with two dif-ferent flight numbers. A Trip is a sequence of flight legs taken by passengers to complete a journey.
The problem of allocating a new flight concerns the first two questions of airline schedule design, that is, determining a set of OD pairs and then choosing the arrival and departure times for an aircraft, given certain constraints, that minimize costs and maximize the profit of an airline company.
Adding a new flight leg to the current network is complicated and involves several decisions:
• Scheduling decisions must be made according to all flight legs connected with the new addition flight leg. They must decide which flight leg to add after considering competitors.
• Measuring Route ’Profitability’: determines eco-nomic profitability of opening a new flight, if it involves a new destination. The other costs must be considered including the additional cost of the airport and also calculate the prices in order not to lose their passengers but to capture a new de-mand. That depends on the existence of current routes that could be connecting flight as well as expected future competition.
In this work, we aim to determine a set of (OD) pairs for allocating new flights. This problem evokes the selection of routes to be flown but some operational and economic considerations must be taken to op-timize an airline network. A route is a sequence of flights with unique flight numbers that begins at the origin airport and ends at the destination airport. Therefore, a forecasting demand is required to esti-mate passenger demand for each route and then de-termine the expected cost and finally compute flight time and revenue. Forecasting demand is the key ele-ment while an airline is planning to add a new flight. An airline needs to estimate the total number of pas-sengers who are willing to take this route, especially if the route is already operated by other airlines. It has to supply enough seats to satisfy the demand. On the one hand, we deal with retrieving set of origin-destination pairs. On the other hand, we look for the
best itineraries based on three principal criteria ofQSI
models (Quality of Service Index) which let airlines project potential market share impact on each deci-sion. QSI model is a market share model that is used to estimate the probability that a traveler selects a spe-cific itinerary connecting an airport pair (Jacobs et al.,
2012). Two KPIs (Key Performance Indicator) are
considered in potential market share impact: number of passengers and revenue for the airline company, that is, adding a new flight by allocating capacities to maximize the revenue.
1.1 State of the Art
The air transportation industry has evolved rapidly over the last years. Route network development, schedule design, fleet assignment, aircraft mainte-nance routing and crew scheduling that represent the five facets of the air transportation optimization prob-lem (Rebetanety, 2006):
Route Network Development: deciding which set of origin-destination pairs to serve. The network design problem consists of determining where to fly (Belobaba et al., 2015).
Schedule design : defining the frequency of each flight. Scheduling determines where and when the airline will fly.
Fleet Assignment: specifying the type and the size of aircraft serving each flight in a given schedule (Rebetanety, 2006).
Aircraft Routing: determining feasible aircraft routes, sequences of flight legs flown by an air-craft type under maintenance and time constraints (Jacobs et al., 2012).
Crew Scheduling: assigning crews to the flights. Airlines have the choice to create new routes or in-crease/decrease the frequency of exiting routes with respect to operational and economic constraints. The latter does not require the route network develop-ment since the route already exists. Note that cre-ating a new route requires a lot of investment (Car-mona Benitez, 2012). Relevant literature exists for airline scheduling and routing. Most researches deal with minimization of the airline cost. (Dobson and Lederer, 1993) studied profit maximization with re-spect to quality of service and modeled flight sched-ules including company costs and consumer choice. The objective was to maximize profit against fixed schedules and prices for other airlines, demand was calculated for each route as a function of the ser-vice quality of all routes to attract passengers. They used a heuristic algorithm to calculate optimal sched-ules and prices with two classes of customers busi-ness and non-busibusi-ness and solved a sample problem with 12-period and 5-city which gives 120 flights and 20 (OD). The competition between airlines has in-creased. In order to deal with competition, airlines have to increase their market share. In this regard, QSI criteria are integrated in our model to get poten-tial market share impact for an airline. Figure 1 shows 4
the criteria used in the QSI model: Revenue and costs Time Regret Frequency Distance Type of aircraft Departure Time Capacity Costs of airport Surcharge Costs Cost of revenue Brand perception Type of
flight Type ofairlines
Figure 1: Criteria of QSI models.
The three principal criteria are highly correlated: Revenue and costs consists to fix an attractive price to capture more traffic. The price must be deter-mined in comparison with other flights in respect of
the competition. Time is the elapsed flying time and
finallyRegret is the regret compared to the optimal
duration and cost. Each of these criteria is related to other factors that affect the estimation of poten-tial market share: Brand perception is a factor in-cluded in the category revenue and costs because the airline market share of total forecast demand for the new route depends on the existence of current and ex-pected future competition. In addition, the Brand per-ception of travel costs criteria fixes the price for routes against competing airlines. Surcharge costs include maintenance costs, fuel and others stuff. When the route involves a new destination, additional costs of the airport must be considered. Cost of revenue con-cerns marketing and advertising. Moreover, time cri-teria concerns both airline managers who must decide which flight to schedule and passengers. Regarding revenue and costs, the focus is solely on the airline company. In fact, airline costs are driven by fleet and flight schedule. Finally, the regret criterion focuses on avoiding regrets that may result from making a non-optimal decision of time or price when choosing a low-cost airline or a connecting flight. The passen-gers do not have the same regret of the same route. Regarding competition, departure time can be deter-mined and then frequency. In fact, passengers have preferences for routes. These preferences depend on the QSI criteria typically the departure time desired. The type of flight is either a principal criterion. In fact, airlines may choose to serve the route with
non-stop flights rather than going through their hub espe-cially, when they see a high demand for travel on this route.
The route network development is considered as the initial problem addressed by the airlines, our work position in this research field. Airlines choose what routes to serve and what prices to fix so that the pas-sengers have the quality and the safety services, the first issue to consider is forecasting demand for po-tential new routes. Three common methods for fore-casting air travel: trends, gravity models, and simu-lation (Swan, 2008). Since no single model guaran-tee accuracy, the most commonly used in literature is the gravity model. (Sivrikaya, 2013) studied this model to estimate the domestic air travel demand for any city pair, two levels of forecasts were considered: 1. Microscopic model; airport specific or city pair specific data. 2. Macroscopic model: region or coun-try. The aim of the study is to analyze the determin-ing factors in air travel demand, it is a semi-log linear model based on geographic, demographic and socioe-conomic variables such as population, GDP, distance, travel Time. In addition, (Marwaha and Kokkolaras, 2015) used the gravity model to estimate OD demand figures for Canada but in function of routes distances. Modeling a flight network is similar to a railway network which is smaller but more complicated than road networks (junctions are nodes, streets are edges) due to different operations constraints which rely on some kind of periodic timetable. Timetable is a listing of times at which events are intended to take place and are the basis behind any flight models. The problem can be solved by modeling the network as a simple graph where edge weights represent travel times on the corresponding connection. In order to model the flight network and thus obtain a graph, there are many approaches cited in the literature for route planning. The time-expanded model includes the time depen-dencies of the timetable in the graph where each node represents an event of the timetable and edge con-nects two consecutive events (Kirchler, 2013). This approach allows modeling the time-dependent infor-mation with more flexible modeling of additional con-straints. Therefore, this approach yields a huge graph. The condensed model is a time-independent model where edges correspond to the aggregate of all avail-able connections between two nodes. While the first approach allows a more flexible model but constructs a big graph, the latter uses only smaller inputs. A key point is that the output graph contains a single node per station rather than multiple nodes per station. Thus, instead of applying routing algorithms to the whole graph, we opt to choose the condensed model in such a way that a routing algorithm does not
nec-essarily explore some useless parts of the graph. Once the graph is generated, routing problems are ad-dressed by finding itineraries that are satisfying time constraints. The routing problem is modeled in litera-ture in different ways. As an example, it was modeled to find an optimal flight path that avoids geographi-cal obstacles (Bast et al., 2015). Another work was dealing with routing problems and researches were interested to find the shortest path in the flight net-works during a time period with respect to several criteria (transfer, time...). As the shortest path algo-rithm, (Delling et al., 2009) used Dijkstra algorithm to solve the earliest arrival problem. It retrieves the quickest connections according to multiple criteria. Although, the railway model can be adapted to flight timetables, they developed a new model that takes into account check in and check out time and transfer time when it’s a connecting flight; it was due to the fact that the problem of instantaneous transfers has an even greater impact on realism flights than on railway queries. These researches studied the routing problem related to passengers.
1.2 Our Contribution
In this paper, we aim to solve the problem of allocat-ing a new flight. It is represented as the route network development problem. We work with Milanamos, a startup company specialized in air transportation. Milanamos has developed a decision tool for airline managers to analyze and simulate a new market. Our problem derived from this application and targets new destinations for a given (OD). We proposed this sub-problem (Flight radius sub-problem) which is related to the route network development problem. It helps to enhance the visualization of the application by show-ing only interestshow-ing destinations. Therefore, it can be implemented in the short term within the exist-ing application and helps airline managers to make decision about where to fly. The data are stored in a NoSQL database. The first challenge is to generate the graph from a missing and erroneous data since the real-world data are generally incorrect inputted. Hence, a data pre-processing step is required to fil-ter our data. The result of the selection of routes will be implemented to optimize the Milanamos applica-tion (See secapplica-tion 3.3). We use the time independent approach to model the flight network. The selection of routes is based on QSI criteria to be competitive against other airlines serving same (OD) pair. Thus, the condensed graph constructed includes these crite-ria. Once it’s done, we would like to apply the routing algorithms to enumerate itineraries under certain con-straints.
This paper is organized as follows. Section 2 de-scribes objectives of this project. In Section 3, we ex-plain the methodology and include formal definitions of timetables, present the formalization of the prob-lem discussed above and describe the database infor-mation used in our research as well as the difficulties encountered when industry data are missing. We con-clude with the current research of our problem.
2 OUTLINE OF OBJECTIVES
The long-term goal of this PhD project is the opti-mization of multimodal networks. Our first step is to enhance the visualization in PlanetOptim. Hence, for an airline managers, what is the relevant sub-network related to a given flight? What are the pas-sengers origins and destinations? This represents a preliminary step before studying the allocation of new flights, that is determining a set of (OD) pairs and the arrival and departure times with respect to the QSI cri-teria. The project is organized into five major steps. The first two ones have already been performed and their outcome is described in this document:
• Generation of the condensed graph and store it in a graph database;
• Formulation of the flight radius problem for en-hancing the visualization;
• Solving the flight radius problem in
PlanetOptim;
• Modeling and solving of the route network devel-opment problem with respect to QSI criteria; • Integration other transportation modes in a
multi-modal network.
3 METHODOLOGY
This section presents the formalization of the flight radius problem, describes the flight database, and ex-plain the construction of the condensed graph based on the flight database. Network design and routing problems often rely on graph theory. Therefore, we first recall basic definitions of graphs.
3.1 Preliminaries
A graph G is a tuple G = (V,E) consisting of a fi-nite set V of nodes or vertices and a set E ⊆ V ×V of edges which are ordered pairs (u,v) if the graph is di-rected. The node u is called the tail of the edge, and v is called the head. Each edge (u,v) ∈ E has an associ-ated non-negative weight w(u,v). In a directed graph, 6
the edges point from one node to another. For in-stance, airline networks are weighted directed graphs where the weights represent the prices or the duration of the flight. A direct flight from one city to another does not necessarily imply that there is also a direct
return flight. A sub-graph G0= (V0,E0)of a graph G
where V0is a subset of V and E0 is a subset of E. A
path is a sequence of nodes {v1,v2, ...,vk} such that
for each 1 ≤ i < k the condition (vi,vi+1)∈ E holds.
If additionally v1=vk, then the path is a cycle. The
length of a path is the sum of its edge weights along the path and is denoted by:
δ(P) :=k−1
∑
i=1
w(vi,vi+1).
A path in G is called elementary if no vertex oc-curs more than once. A graph G is strongly con-nected if there exists a path joining any two vertices. A transportation network should be a strongly con-nected graph.
3.2 Problem Formalization
The essence for each flight model is a timetable from which we construct the condensed graph. A flight
timetable is defined by a 4-tuple (
C
,A
,F
,T
)whereA
a set of airports,F
is a set of flights,T
is thepe-riodicity of the timetable and
C
is a set of elementaryconnections. An elementary connection c ∈
C
is a5-tuple c = ( f ,o,d,ts,te)which represents flight f ∈
F
departing from airport o ∈
A
at ts<T
and arriving atairport d ∈
A
at time te<T
. Concretely, anelemen-tary connection corresponds to an event in a timetable. Let cap(c) denote the capacity, let pax(c) denote the number of passengers, and let r(c) denote the total
revenue. Let t(c) = te−tsbe the flight duration
asso-ciated with the elementary connection.
A passenger trip (c1,c2, . . . ,cn−1,cn) is a sequence
of elementary connections, with the origin of an el-ementary connection the same as the destination of its predecessor in the sequence, and the elapsed time between two successive connections at least as great as the minimum connecting time:
o(ci+1) =d(ci)∧te(ci) +MCT (d) ≤ ts(ci+1)
∀1 ≤ i ≤ n − 1 Where MCT is the minimum connecting time at the destination airport d.
The condensed graph is a time-independent represen-tation of the flight network. Nodes represent airports meanwhile the presence of an arc indicates that there exists at least one elementary connection between the two airports. Each arc is constructed by aggregating
all elementary connections between each pair of
air-ports. Let
C
od={c ∈C
| o = o(c) ∧ d = d(c)} be theset of elementary connections between two airports o & d. The following labels are associated with the arc (o,d) :
• Fod=|
C
od| is the number of elementaryconnec-tion between o and d;
• Cod=∑c∈Codcap(c) is the total capacity in terms
of the number of passengers;
• Pod=∑c∈Codpax(c) is the total number of
passen-gers;
• Rod=∑c∈Codr(c) is the total revenue;
• ¯Rod=minc∈Cod pax(c)r(c) is the minimum revenue per
passenger;
• Tod =minc∈Codt(c) is the minimum flight
dura-tion;
• Dodis the distance between the two airports.
Frequency, capacity and number of passengers are the target market that determines for airlines what routes to operate. We choose the sum aggregation for these criteria since it indicates the importance of the route so the airline decides to increase the frequency or open new route. Concretely, a passenger trip is a unique path p in the time-expanded graph whereas many passengers trips are associated with the same path in the condensed graph. The existence of a path in the condensed graph is a necessary (but not suffi-cient) condition to the existence of a passenger trip. In addition, a path between o & d in the condensed graph gives a lower bound on the cost and duration of a passenger trip that goes along the same airports.
We aim to determine the set of (OD) pairs that would be interesting for an airline manager. The prob-lem is to identify flights and routes that represent busi-ness opportunities and are attractive regarding com-petition. But the flight network is so large that it can’t be visualized. So, we aim to display only the relevant airports with respect to the edge (o,d). It means that there exists a route connecting these air-ports passing through the arc (o,d) subject to time and cost constraints. A naive algorithm could enumerate all paths passing through the arc, but the number of paths can grow exponentially. With this aim, let R be a Boolean regret function defined on paths of the condensed graph G. The problem consists in finding a maximal sub-graph such that each node or arc sup-ports a path accepted by the regret function.
Hence, the problem is formulated as follows: Input: a graph G = (V,E), the arc (o,d), the regret
function R
Output: a subset E0⊆ E such that G0= (V0,E0)is a
sub-graph of G and that each node supports a path accepted by the regret function.
vnthat passes by (o,d) and is shorter than the shortest
path between these nodes with a constant factor and false otherwise. If such path exists then all vertices of this one are added to the sub-graph. This
func-tion depends on the shortest path between v1and vn
in terms of duration or cost and it’s defined for each criterion: cost and time (duration). We fix a lower bound for each criterion with a minimum stopover de-sired. Let’s o & d represent two airports in the graph G where the node o is the tail of the edge (o,d) and d the head. The problem consists in finding an
inter-esting path for a given vertex o1 regarding the edge
(o,d). That is finding at least one path from node o1
to node d1 that passes through the edge (o,d) such
that is shorter than the shortest path p∗ between o1
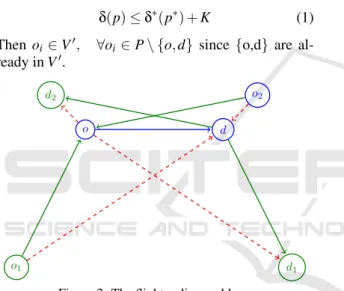
and d1 plus a constant factor K. See Figure 2: ∃ a
path p = {o1,o2...ok,o,d,d1} where:
δ(p) ≤ δ∗(p∗) +K (1)
Then oi ∈ V0, ∀oi ∈ P \ {o,d} since {o,d} are
al-ready in V0. o o1 d d1 o2 d2
Figure 2: The flight radius problem.
Figure 2 explains the flight radius problem. The
blue edge is the (o,d) connection and {o1,d1,o2,d2}
represent the set of candidate vertices meanwhile the
red dashed edge is the shortest path. The nodes o2
and d2are not going since there exists a shortest path
between o and d2in the graph (respectively from o2
to d).
Concretely, such a path that satisfies the regret function exists if and only if exists a path reaching
o from o1or departing from d to d1acceptable to the
function R(p).
Proof. Let p = {o1, . . . ,o,d,d1} be the path from o1
to d1that passes through the edge (o,d) and verify
in-equality 1. Then:δ(p) ≤ δ(p∗)+K
⇒ δ({o1, . . . ,o,d,d1}) ≤ δ(p∗) + K
⇒ δ({o1, . . . ,o,d} ∪ (d,d1))≤ δ({o1,d1}) + K
⇒ δ({o1, . . . ,o,d}) + w(d,d1) ≤ δ({o1,d1}) + K
However, the shortest path satisfies the triangle in-equality property:
δ({o1,d1}) ≤ δ({o1,d}) + w(d,d1)
Thus:
δ({o1, ...,o,d}) ≤ δ({o1,d}) + K
In this paper, we start by modeling the flight radius problem in the additive case and aim to study also the multiplicative case which is more complicated.
3.3 Flight Database
We first present the software tool PlanetOptim and the graph database proposed besides MongoDB and conclude by describing the process of generating and storing the condensed graph in Neo4j.
3.3.1 Description of PlanetOptim
Our inputs derived from PlanetOptim software de-veloped by the firm Milanamos. It is a decision-making tool that helps airline companies to analyze market, scheduling flights and forecasting demand to maximize revenue. PlanetOptim is composed of three principal modules: Analysis market, Flight sim-ulators and analysis of the hub and routes. We are in-terested in the second module which is the flight sim-ulator, it consists of simulating flight in function of supply and demand. This one assists the user in eval-uating and displaying for a specific flight departure time the connections from 45 until 360 minutes after the Minimum Connecting Time (Milanamos, 2016). Especially when a company wants to add a new flight, it looks for the best time of departure time in order to maximize the connections and thus the number of passengers traveling in that flight. PlanetOptim is based on a NoSQL flight database named Optimode. Milanamos uses MongoDB for this database to store both structured and unstructured data without schema constraints and thus no option join. In MongoDB, we talk about collections and documents rather than ta-bles and rows in relational databases. We are inter-ested in these collections while generating the con-densed graph, data are monthly:
• Capacity: Includes data about equipment, origin, destination, airlines. All data about frequency, seat per operation, capacity.
• O&D: It contains all information about passen-gers itinerary: origin, destination, connecting points, duration, number of passengers, revenue... • Schedule: Schedule is composed of individual flights between two airports. We distinguish be-tween the two types of schedule: Rotations and routing. A routing is a set of aircraft routes. How-ever, Rotations are routing which begin and end at the same airport. (Barnhart et al., 2003) Schedule collection contains information related to fleets, (OD) pairs, flight numbers...
• Segment: Contains all data of only flight legs: ori-gin, destination, number of passengers, revenue, distance, type of aircraft.
In the air transportation management, the O&D mar-ket is defined by a passenger’s point of entry and exit from the airline system and it’s important to the air-lines because it let’s them know how many passengers travel between the two cities during a certain time pe-riod. However, Segment market information gathered for a specific route operated by an aircraft from a point of origin and a destination when it’s a non-stop flight (Milanamos, 2016). We are based on these collec-tions from which we extract information to construct the condensed model. Basically, we are interested in the segment collection since it provides all informa-tion for each segment typically the number of passen-gers traveled from origin to a destination rather than O&D collection which only gives the number passen-gers for the whole route and not for each sequence or segment of the route.
In optimode, data are collected monthly so it is worthwhile to keep this frequency rather than aggre-gate to high frequency (e.g. yearly). Note that this make most sense for a monthly result when the orig-inal data covers a whole number of months: in par-ticular aggregating a monthly data to yearly starting in February does not give a conventional yearly data. Moreover, it provides a better analysis of evolution traffic per month and then gives a more accurate re-sult. Besides, database does not use graph structure and stores data in disconnected way.
That needs for compact structure to regroup data, store and visualize the graph.
3.3.2 Graph Database
The graph was implemented using the Neo4j graph database. It is one of the popular graph databases stands for Cypher query language. It is used in many use cases, typically network routing.
Neo4j Graph Database follows the property graph
model to store and manage its data. It has the fol-lowing characteristics (Robinson et al., 2013): Repre-sents data in nodes, relationships and properties. Both nodes and relationships contain properties. A rela-tionship connects a pair of nodes, it has a direction, type, a start node and an end node.
We use Neo4j as another alternative that repre-sents a data structure to store the condensed graph. It is an open source project with more utilities besides
NoSQLdatabase (MongoDB). Neo4j represents a graph
structure that regroups data contained in collections and helps to visualize the graph and also the result of queries. As an example: See what happens if we allocate a new flight to the network which it’s
real-ized by adding a new edge to the graph. It makes a lot of sense to store it there since relationships de-scribe if there is at least flight between an OD pair in contrast with MongoDB which requires updating all related collections. Moreover, we can do our query easily without any join now that it’s provided free by the graph. This graph database response perfectly to our needs since it performed well on the graph traver-sal. (Holzschuher and Peinl, 2014). With Neo4j, we are able to implement algorithms and then store them as a stored procedure to use it in Cypher. It is easy to handle it by the user in PlanetOptim.
We are working in a business context. Aviation data are highly connected and grows day over days and
Neo4jperforms well and handles this. Actually, we
are studying different models to store our data in Neo4j:
• Store all information in a single relationship be-tween an (OD) pair;
• Store monthly data per relationship;
• Construct relationship per criterion between each pair of nodes.
The latter two models generate a huge graph since we duplicate relationships per month but allows to quickly access information. We are benchmarking response time of the following questions (and many others):
• What is the path between an OD pair with the min-imum transfer?
• What is the average capacity since 2015? • What is set of O-D for a period 2016 with capacity
greater than a certain value?
• If I want to fly from Paris to New York. Check-ing for direct flights or check for flights with a stopover at some airport.
The second model is more flexible for several reasons. Firstly, data are monthly collected so it makes sense to create relationship per period which is a month of the year. Secondly, adding a period is realized by adding a relationship. However, it consists to fetch and get the relation and then set the properties in the first models even for the deletion is the same thing. Thirdly, the existence of a ’null’ value does not pre-vent the calculation of an average or a sum and finally response time is so fast.
The graph in Neo4j is represented as an adjacency list. To test the existence of a relationship between a couple of nodes, the time response is not constant in contrary to adjacency matrix.
3.3.3 Extraction Process
We get into some issues while extracting data as a part of collecting real world data. We estimate that at least 10% of data are erroneous. Besides, missing data of
certain airports such as: distance, region...and about some flights such as: Departure time, arrival time, du-ration.
The graph was generated based on three collec-tions: Segment, Capacity and Schedule. The data are extracted as follows: firstly, we get the information about revenue, number of passengers and distance for each month and (OD) pair by aggregated the monthly data then a first join is set to obtain the frequency and the capacity corresponding to this month and (OD). Finally, a second join between Segment and Sched-ule collection to fetch the duration. Another issue en-countered is the distance. Both tables Schedule and Segment contains this information. The first one is collected from booking service. However, the sec-ond is calculated by our formula. After a comparison, we conclude that we don’t have the same distance for routes matched between collection. The problem is due to erroneous geographic coordinates of airports, the distance is recalculated using the correct coordi-nates. The process of extracting data is as follows:
• Step 1: Aggregate the frequency and seat per op-eration for each (OD) pair in capacity collection using the aggregation functions cited in 3.2; • Step 2: Aggregate duration of schedule collection; • Step 3: Aggregate the revenue and the number of passengers in segment collection and then use the function join to get the attributes aggregated in step 1 & 2 for that (OD) pair.
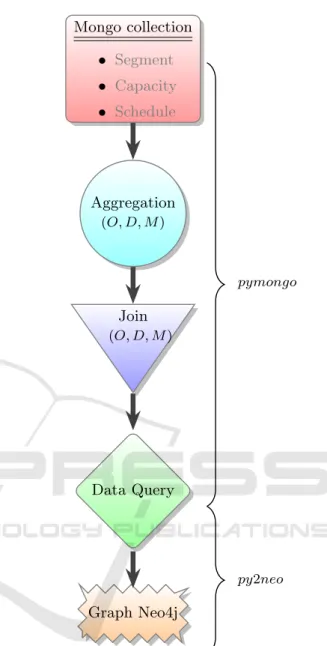
Note that we use python to do join since this op-tion is absent in NoSQL MongoDB. Python works per-fectly with MongoDB via the pymongo api. The fol-lowing figure 3 describes the process of generating condensed graph:
Since we opt to monthly frequency, we aggre-gate data per (origin, destination, month of the year):
(O,D,YM). After the process of extracting data, we
store the graph in Neo4j using the driver py2neo. Nodes represent airports, relationship per period (a month of year) and properties regroup the labels of the condensed graph. The graph was generated over the last year (2015) and has 11,668 nodes and 608,812 relations.
4 STAGE OF THE RESEARCH
The overall airline scheduling design process involves hierarchical steps starting with the route network de-velopment and ending with crew assignment. Route network development is especially important with re-spect to timing and costs for airlines. In this paper, we focus on allocating a new flight problem that con-sists of determining a set of OD pairs and then
choos-Mongo collection • Segment • Capacity • Schedule Aggregation (O, D, M ) Join (O, D, M ) Data Query Graph Neo4j pymongo py2neo
Figure 3: The process of constructing the graph.
ing the arrival and departure times for an aircraft. We presented a sub-problem of this problem (Flight ra-dius problem) which helps airline managers to visual-ize the interesting sub-network of such a flight based on QSI models. The result can be implemented in the short term within the existing application in order to improve the visualization of flight network and thus help airline managers to make routing decision about set of (OD) pairs to serve and also choose schedules that maximize revenue. We formulated the problem as finding a maximal sub-graph such that each edge sup-ports a valid path. Such path depends on regret func-tion that model the passengers preferences regarding the cost and the duration and then showed how to con-struct graph from a real data which it’s stored in a 10
NoSQLdatabase and presented an alternative to store the graph.
Our research aims to solve the problem of allo-cating a new flight which is a sub-problem of route network development problem based on QSI method-ology that is most used by airlines in trip choice.
Regarding future work, it would be interesting to choose a shortest path algorithm to solve the flight radius problem and as mentioned in section 3 ’Outline of Objectives’, the next step in this research is to solve the allocating a new flight since the first two of the five objectives outlined have already been accomplished. We may extend our recent work on the flight route planning to multimodal route planning.
5 EXPECTED OUTCOME
The final outcome of this research is to help airline managers to make rational decisions by improving the application PlanetOptim. We aim to define a new problem of modeling expert decision-making in air traffic and then solve it by using our expertise in graph theory; apply algorithms that have already studied in the literature but also propose new one adaptable to graph database. Moreover, our objective is to study the complexity of these algorithms in the case of the graph databases that are little studied in academic area especially that they don’t stand for adjacency matrix.
REFERENCES
Barnhart, C., Belobaba, P., and Odoni, A. R. (2003). Ap-plications of operations research in the air transport industry. Transportation science, 37(4):368–391. Bast, H., Delling, D., Goldberg, A. V., M¨uller-Hannemann,
M., Pajor, T., Sanders, P., Wagner, D., and Werneck, R. F. (2015). Route planning in transportation net-works. CoRR, abs/1504.05140.
Belobaba, P., Odoni, A., and Barnhart, C. (2015). The global airline industry. John Wiley & Sons.
Carmona Benitez, R. (2012). The Design of a Large Scale Airline Network. TU Delft, Delft University of Tech-nology.
Delling, D., Pajor, T., and Wagner, D. (2009). Engineer-ing time-expanded graphs for faster timetable infor-mation. In Robust and Online Large-Scale Optimiza-tion, pages 182–206. Springer.
Dobson, G. and Lederer, P. J. (1993). Airline scheduling and routing in a hub-and-spoke system. Transporta-tion Science, 27(3):281–297.
Hall, R. (2012). Handbook of transportation science, vol-ume 23. Springer Science & Business Media.
Holzschuher, F. and Peinl, R. (2014). Performance op-timization for querying social network data. In EDBT/ICDT Workshops, pages 232–239.
Jacobs, T. L., Garrow, L. A., Lohatepanont, M., Koppel-man, F. S., Coldren, G. M., and Purnomo, H. (2012). Airline planning and schedule development. In Quan-titative Problem Solving Methods in the Airline Indus-try, pages 35–99. Springer.
Kirchler, D. (2013). Efficient routing on multi-modal trans-portation networks. PhD thesis, Ecole Polytechnique X.
Marwaha, G. and Kokkolaras, M. (2015). System-of-systems approach to air transportation design using nested optimization and direct search. Structural and Multidisciplinary Optimization, 51(4):885–901. Milanamos (2016). User Manual of PlanetOptim.
Rebetanety, A. (2006). Airline schedule planning in-tegrated flight schedule design and product line design. University Karlsruhe (TH). PhD thesis, PhD thesis, 2006. Available at http://www. iks. kit. edu/fileadmin/User/calmet/stdip/dip-rabentanety. pdf. Accessed 2013 January 30.
Robinson, I., Webber, J., and Eifrem, E. (2013). Graph Databases. O’Reilly Media, Inc.
Sivrikaya, O. (2013). Demand forecasting for domestic air transportation in turkey. The Open Transportation Journal, 7(1):20–26.
Swan, W. (2008). Forecasting air travel with open skies. In joint EWCKOTI Conference.