HAL Id: hal-02938784
https://hal.archives-ouvertes.fr/hal-02938784
Submitted on 21 Sep 2020HAL is a multi-disciplinary open access archive for the deposit and dissemination of sci-entific research documents, whether they are pub-lished or not. The documents may come from teaching and research institutions in France or abroad, or from public or private research centers.
L’archive ouverte pluridisciplinaire HAL, est destinée au dépôt et à la diffusion de documents scientifiques de niveau recherche, publiés ou non, émanant des établissements d’enseignement et de recherche français ou étrangers, des laboratoires publics ou privés.
metal-chelating peptides from surface plasmon
resonance binding parameters
Laurence Muhr, Steve Pontvianne, Katalin Selmeczi, Cédric Paris, Sandrine
Boschi-Muller, Laetitia Canabady-Rochelle
To cite this version:
Laurence Muhr, Steve Pontvianne, Katalin Selmeczi, Cédric Paris, Sandrine Boschi-Muller, et al.. Chromatographic separation simulation of metal-chelating peptides from surface plasmon resonance binding parameters. Journal of Separation Science, Wiley-VCH Verlag, 2020, 43 (11), pp.2031-2041. �10.1002/jssc.201900882�. �hal-02938784�
Received: 29/08/2019; Revised: 25/01/2020; Accepted: 18/02/2020
This article has been accepted for publication and undergone full peer review but has not been through the copyediting, typesetting, pagination and proofreading process, which may lead to differences between this version and the Version of Record. Please cite this article as doi:
Chromatographic Separation Simulation of Metal-Chelating Peptides from Surface Plasmon Resonance Binding Parameters
Laurence MUHR1, Steve PONTVIANNE1, Katalin SELMECZI2, Cédric PARIS3, Sandrine BOSCHI-MULLER4 and Laetitia CANABADY-ROCHELLE1*
1Université de Lorraine, Ecole Nationale Supérieure des Industries Chimiques, Laboratoire Réactions et Génie des Procédés (UMR CNRS-UL 7274), 1 rue Grandville, 54000 Nancy, France
2Université de Lorraine, Laboratoire Lorrain de Chimie Moléculaire UMR 7053 CNRS-UL, Boulevard des Aiguillettes, BP 70239, 54506 Vandoeuvre-lès-Nancy cedex, France
3Université de Lorraine, PASM platform, ENSAIAFrench engineering school, 2, avenue de la Forêt de Haye, 54000 Vandoeuvre-lès-Nancy, France
4Université de Lorraine, Laboratoire IMoPA, 54506 Vandoeuvre-lès-Nancy cedex, France Running title: IMAC separation simulation of peptides from SPR binding parameters
(*) Author to whom the correspondence should be addressed: E-mail: laetitia.canabady-rochelle@univ-lorraine.fr
Telephone number: +33 (0)3.72.74.38.86. Fax number: +33 (0)3.83.59.58.24. List of non-standard abbreviations:
IMAC: Immobilized Metal ion Affinity Chromatography SPR: Surface Plasmon Resonance
MCP: Metal-Chelating Peptides
Key words: chelation, immobilized metal ion affinity chromatography, modelling, peptide, surface plasmon resonance.
Abstract. Some metal-chelating peptides have antioxidant properties, with potential nutrition, health and cosmetics applications. This study aimed to simulate their separation on immobilized metal ion affinity chromatography from their affinity constant for immobilised metal ion determined in surface plasmon resonance, both technics being based on peptide-metal ion interactions. In our approach, first, the affinity constant of synthetic peptides was determined by surface plasmon resonance and used as input data to numerically simulate the chromatographic separation with a transport-dispersive model based on Langmuir adsorption isotherm. Then, chromatographic separation was applied on the same peptides to determine their retention time and compare this experimental tR with the simulated tR obtained from simulation from surface plasmon resonance data. For the investigated peptides, the relative values of tR were comparable. Hence, our study demonstrated the pertinence of such numerical simulation correlating immobilised metal ion affinity chromatography and surface plasmon resonance.
1. Introduction
Various industrial sectors (i.e. pharmacy, cosmetics, or food) have an increasing need of new biomolecules 1. Peptides from plant and animal resources present a potential interest due to their bioactive properties, such as anti-hypertension 2, 3, anti-thrombosis 4, anti-carcinogenic effect 5, etc. Bioactive peptides can be obtained either by peptide synthesis, by their extraction from natural resources, or through protein hydrolysis. In this latter case, their use is often limited because of their presence in a complex mixture of peptides and also their low concentration in a peptide hydrolysate.
Antioxidant is a generic term that gathers various mechanisms including reducing capacity, radical scavenging activity and metal chelation activity. Transition metal ions can cause the production of radical species in organisms. Hence, upon metal chelation with a peptide, free radical production can be inhibited and oxidation phenomena delayed. According to the literature, some peptides with metal chelation properties would act as potential antioxidant according to their amino acid residues in their sequence. Indeed, the common structure of amino acid, NH2CHRCOO-, contains C-terminal carboxylate (COO-) and N-terminal amino (NH2) groups. These donor groups, with others from side chains such as the thiol
This article is protected by copyright. All rights reserved. 3 group of cysteine, the imidazole group of histidine, the indole group of tryptophan or the carboxylate COO- of acid aspartic can bind to many metal ions 6, 7.
To this date, the separation of bioactive peptides inside a complex mixture is still studied empirically: peptides are separated into various fractions, each one being evaluated for their bioactivity up to isolate the peptide of interest and identify its sequence by mass spectrometry.
Various separation techniques take advantage of the interaction between an immobilised metal ion and a proteinous molecule (i.e. peptides, polypeptides or proteins) present in complex biological samples. Among them, immobilised metal ion affinity chromatography (IMAC) can separate proteins and peptides efficiently 8. To separate proteins or peptides from complex mixture, IMAC has been studied for years 9. Nevertheless, this technique presents some disadvantages i.e. the high cost of IMAC phase 8, a modest sensitivity, a throughput and limited flexibility, in addition to the waste of molecule of interest upon the washing up of the non-specific binding molecules 10. Since chromatography is time-consuming, a pre-screening system can help to determine the presence of metal-chelating peptides (MCP).
Some studies investigated the link between chromatography and Surface Plasmon Resonance (SPR) 11, 12. This optical biosensor 13, which measures the change of refractive index, is related to the adsorption of the analyte initially circulating in solution onto the immobilized ligand. Such technology is comparable to Quartz Crystal Microbalance technology (QCM) to investigate the affinity and binding kinetics. Indeed, using a Ni2+-NTA chip, SPR could determine the affinity constant of peptide for Ni2+. SPR technology is similar to IMAC for a same complexing agent (NTA) and metal ion used. Hence, a methodology could consist in using the information provided by SPR to determine the operating parameters for IMAC separation process.
Vunnum et al. 14 successfully modelled IMAC using a non-linear multicomponent equilibrium in the case of proteins. Their simulation required input data such as the number of interaction sites of the protein when adsorbed on the stationary phase, a steric factor related to protein and the experimental determination of a linear equilibrium parameter for adsorption. In a different approach, the aim of this
study was to simulate IMAC chromatographic process from SPR experimental data in order to guide the further peptide IMAC separation. To our knowledge, this approach is new and has never been investigated to date. The Ni2+-IMAC separation simulation from Ni2+-NTA-SPR data relies on the fact that both techniques are based on the same peptide-metal ion interaction mechanism. Indeed, we want to take advantage of SPR accuracy, technology which can determine dissociation constant (KD) from pM up
to mM, in order to enhance the efficiency of metal-chelating peptide enrichment by IMAC, knowing that experimental separation often requires large amount of resources and time.
To overcome this problem, the aim of this study was to simulate the IMAC separation of metal-chelating peptides from SPR data in order to make prediction of separation. Current theory and methods for surface interaction-based analysis/purification were developed from small synthetic molecules to significantly larger and complex biomolecules. Today, we can reveal the heterogeneity in assumed homogeneous interactions using sophisticated numerical tools like reported in the literature 15.
In our work, numerical simulations were tested. The program considered the affinity constant and the capacity deduced from SPR as a model input, the output corresponding to a retention time (tR) 16 -
related to a given imidazole concentration (IMC) required for MCP elution. In parallel, IMAC protocol was set up and applied to the same set of peptides. The simulated results were then compared with IMAC experimental data for validating the IMAC chromatographic modelling.
2. Materials and Methods
2.1. Chemicals
The studied peptides (i.e. HHH, HGH, HW, NCS, DAH, DTH, DSH, EAH, CAH, RTH, GNH) were purchased from GeneCust (Dudelange, Luxembourg; Supplementary information. Figure S1) and selected according to the literature 17, 18 (Supplementary information. Table S1). Their theoretical physical-chemical parameters were determined from Calpep free software (Supplementary information. Table S2).
The NTA reagent kit, the BIAmaintenance Kit and nitriloacetic acid (NTA) sensor chip were purchased at GE Healthcare Bio-Sciences AB (Uppsala, Sweden).
The imidazole and hydrochloric acid solution were purchased from Sigma (Saint Louis, USA). The potassium phosphate monobasic (KH2PO4) and tween 20 Bioxtra, were provided from Sigma Aldrich (Saint Louis, MO, USA). The sodium chloride (NaCl) and di-sodium hydrogen phosphate dodecahydrate (Na2HPO4.12H2O) were purchased from VWR Chemicals (Leuven, Belgium). The ethylenediamine tetraacetic acid disodium salt dihydrate (EDTA-Na2.2H2O) was purchased from Fluka Chemie (Buchs, Swiss). The sodium hydroxide (NaOH) 1M was purchased from Carlo ERBA (Val de Reuil, France). The sodium dodecyl sulfate (SDS) was purchased from Biosolve BV Chimie (Dieuze, France). The nickel(II) sulfate was purchased from Aldrich (Saint Louis, MO, USA). Ultrapure water (18.2 M.cm-1) was obtained using a Milli-Q System (Millipore, USA).
2.2. Surface Plasmon Resonance 2.2.1. Buffer and peptide solution
First, various buffers were prepared. The PBS 1X running buffer was prepared from a 10X PBS (67 mM Na2HPO4.2H2O, 12.5 mM KH2PO4, 150 mM NaCl, pH 7.4). Upon dilution, the PBS 1X was pH-adjusted to 7.4 and tween 20 (0.005% (v/v)) added.
Several regeneration buffers were prepared as in Canabady-Rochelle et al. 19: 500 mM imidazole solution, a running buffer (10 mL of PBS 1X, 0.005% tween 20, pH 7.4, containing 87 µL EDTA at 350 mM) and 0.5% SDS solution. Both imidazole and SDS solutions were prepared in ultrapure water. All SPR buffers were filtered onto a 0.2 µm-membrane filters (WhatmanTM, Buckinghamshire, UK). For viscous solutions (i.e. SDS), ultra-pure water was filtered before dissolving the chemicals. All peptides were dissolved in binding buffer PBS 1X.
To plot SPR sorption isotherm, each peptide was studied at various concentrations ranging from 0 to 100 mM. Over 50 mM, the pH of peptide solution was adjusted to pH 7.4 when necessary, either with concentrated NaOH (10N) or HCl (37% v/v).
2.2.2. Surface Plasmon Resonance experiments
The SPR experiments were led similarly as in Canabady-Rochelle et al. 19 and reported briefly. The binding affinity of peptides and imidazole to Ni2+ was analysed by SPR at 25°C using a Biacore X100 instrument (GE Healthcare, Uppsala, Sweden) equipped with NTA sensor chips. All binding experiments were performed at a flow rate of 20 µL.min-1. A 1-min injection of Ni2+ onto the NTA chip using a NiCl2 solution (500 mM, Biacore kit) was followed with a 1-min stabilization. The NTA flow channel uncharged in Ni2+ was used as reference channel. Then, the peptide sample was injected on both channels for 270s followed by 270s undisturbed dissociation time. Between each studied concentration, a regeneration procedure was performed as in Canabady-Rochelle et al. 19. Four buffer blanks before and one at the end of the experiment were used as references during data processing.
The SPR sensorgramms were processed with BIAevaluate software to obtain isotherms expressed in Resonance Unit (RU, corrected by the offset value) as a function of the peptide concentration C (M). Considering the maximal response (Rmax, RU), the dissociation constants (KD, M) were determined at
equilibrium by fitting the experimental data with the 1:1 binding model. This former model follows the Equation 1.
2.3. Immobilised Metal ion Affinity Chromatography numerical simulation 2.3.1. Langmuir adsorption theory
In IMAC chromatography and for modelling purposes, knowledge of the equilibrium isotherm between the stationary phase and the liquid phase is essential. The original Langmuir adsorption isotherm describes a single layer adsorption. This former isotherm has a convex (upwards) curvature, between the linear part and the maximum surface coverage. For such a so-called Type I isotherm, the corresponding overloaded elution profile has a sharp front and a diffusive rear as previously described 20. It tends to linearity at very low solute concentrations (low surface coverage) and towards an asymptotic value
for high concentrations (whole surface covered with solute). In chromatography, the general Langmuir equation is presented in Equation 2.
with qmax, the maximal capacity (g/L stationary phase), KA , the affinity constant (in L/g) and C, the solute
concentration in mobile phase (g/L).
For using Equation 2 during IMAC simulation, binding parameters (KA and Rmax) measured in SPR must
be first converted.
To discuss value transposition from SPR to IMAC, Equation 2 can be considered. For low peptide concentration in liquid phase, the isotherm slope is given by the factor, whose physical meaning
is linked to the affinity of the peptide for the fixation sites. This affinity can reasonably be assumed independent of the geometry differences induced by a plane ship (SPR) or a spherical particle (IMAC). As far as C value in Equation 2 is expressed in mass concentration (g/L), the affinity constant must be converted in L/g from the SPR value given in M-1, as described in Equation 3.
K
A,IMAC=
K
A,SPRMW
=
1
K
D,SPR´ MW
(3)where MW is the peptide molecular weight expressed in g/mol and KA, SPR (M-1), the inverse of the dissociation constant (KD, M) measured in SPR.
By analogy to IMAC, the maximal SPR response Rmax is reached when all the accessible ligand-binding
sites are occupied by the analyte. Considering this and the work of Vunnum et al. 14, the amount of sites potentially occupied by a peptide depends on its multi-pointed adsorption and its steric hindrance effects. According to SPR chip specification, the binding of 1 ng/mm2 of protein to the sensor surface leads approximately to a response of 1000 RU. Since the matrix is about 100 nm thick, this represents a protein concentration within the matrix of 10 mg/mL 21. Considering the specification given by Biacore and the works of Merwe (2018) 21, a concentration of 1g/L corresponds to 100 RU. Besides, the unit of
qmax,SPR is given in g/L. Therefore, for SPR sensor chip, the qmax, SPR (g/L) was calculated according to
Equation 4:
𝟒
where is the liquid phase concentration at the NTA sensor chip interface (g/L) and Rmax the
maximal resonance determined in SPR (Resonance Unit, R.U.).
Besides, for the building of our model and for a true transposition between SPR and IMAC, the Rmax must
also be converted into a capacity value (qmax) for simulation. In chromatography, the capacity (qmax) is the
quantity of species retained for a given mass or volume of stationary phase (e.g. g/L stationary phase). To transpose a liquid phase concentration in the vicinity of an interface in SPR (qmax, SPR) to a concentration
in a solid phase in IMAC (qmax, IMAC), the accessible area of the stationary phase particle present in a given
volume must be determined in IMAC. For a porous stationary phase in IMAC, the Ni2+-NTA grafted area accessible to peptides depends on porosity.
In spite of this difficulty, it can reasonably be assumed that the ratio qmax, IMAC over qmax, SPR does not
change significantly for the various peptides. This ratio depends on the ratio area over volume of the stationary phase. Using qmax, SPR value for IMAC simulation should therefore enable to compare peptides
behaviours. Hence, a unique notation qmax will be used.
Finally, for better simulation, the competitive effect must also be taken into account especially when imidazole is used for elution in IMAC. For competitive adsorption of several components, the Langmuir adsorption must be adapted; in this latter case, qi is expressed using Equation 5
∑
2.3.2. Transport dispersive model simulation for immobilised metal ion affinity chromatography The numerical simulation used pdepe solver (Matlab 2012b) to predict the retention time in IMAC. The program relies on a transport-dispersive model with Langmuir adsorption isotherm at low solute concentration. This model describes the mass transfer inside the column, assuming isothermal adsorption, radial homogeneity and lumped coefficients for axial dispersion and mass transfer resistances 20. Drawing an analogy between a plug-flow reactor and the chromatographic column, it comprises a mass balance (Equation 6) and a kinetic equation for the stationary phase adsorption (Equation 7):
where t is the time coordinate, z the axial coordinate, T the total porosity, u the superficial velocity, DL
the apparent axial dispersion coefficient, Nc the number of components in the system, L the column
length, km the lumped mass transfer coefficient, and q* the solute concentration in the stationary phase at
equilibrium as defined by the adsorption equilibrium isotherm.
The apparent axial dispersion coefficient, DL,is defined by an empirical correlation with Np, the
theoretical plate number (Equation 8) as described in Guiochon et al. 22.
The number of theoretical plates can be determined experimentally from the chromatogram of an unretained small molecule by measuring the peak width at half maximum peak height.
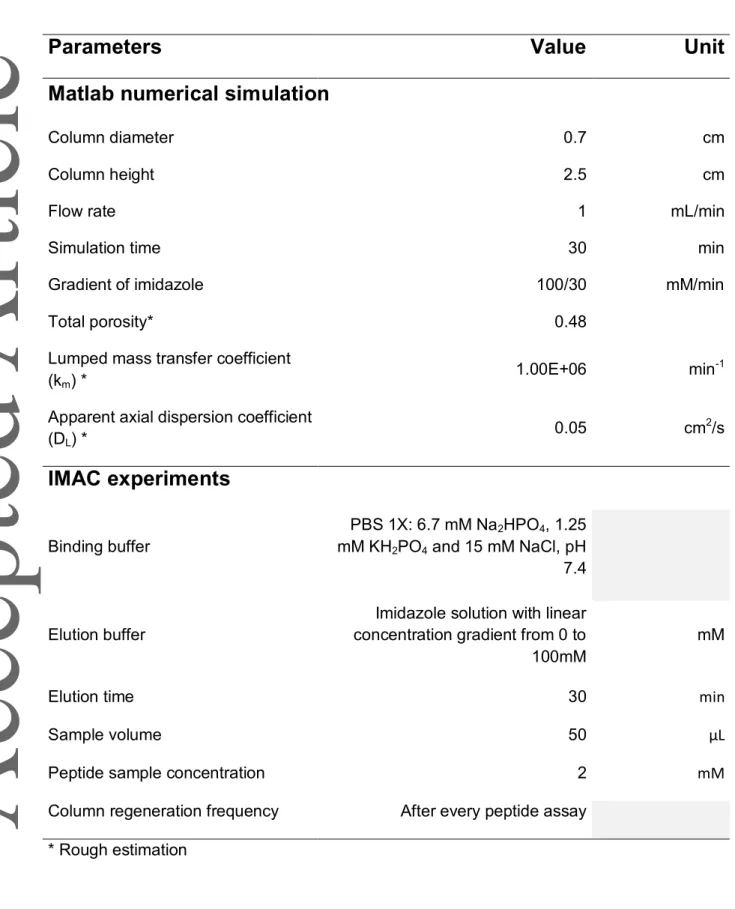
The parameters used for simulation are presented in Table 1. 2.4. Immobilized Metal ion Affinity Chromatography
IMAC used a high-performance liquid chromatography (HPLC) system (Shimadzu, Japan) at room temperature and a flow rate of 1mL.min-1. The HiFliQ column (25mm×7mm i.d., 1mL bed volume;
Generon, UK) was prepacked with NTA resins. The parameters of HiFlick Ni2+-NTA FPLC column are presented in Supplementary information (Table S3). The column stored in ethanol was first washed with 0.25 M NaCl aqueous solution after connection to the HPLC. The agarose adsorbent phase was loaded with nickel ions until saturation by passing 10 mM nickel sulfate solution in water through the column.
All peptide solutions were first prepared at 10 mM in PBS 1X as those used in SPR (section 2.2.1). Before IMAC injection, they were diluted in PBS 1Xto a final concentration of 2 mM. The PBS 1X was also employed as the binding buffer. The IMAC operating conditions used are presented in Table 1.
The separation process was done twice on a blank, i.e. 50 µL of the binding buffer and then on peptide sample. After this step, the column was stripped and regenerated.
For IMAC, 50 μL sample was injected after equilibrating the column by 5 column bed volume (BV, i.e. 1mL) of binding buffer. Afterward, 10-15 BV of the binding buffer was percolated through the column until a stable baseline was reached in the column out stream. Strong binding impurities were then eluted with a continuously increasing gradient of imidazole (0-100 mM) in the same binding buffer for 30 min. Finally, the column was washed with 0.25 M NaCl aqueous solution, 0.5 M NaOH in water and again 0.25 M NaCl aqueous solution, 10-15 BV each time. After each run, the resins were stripped and regenerated using sequentially 10 BV of aqueous solutions: 100 mM EDTA, 0.5 mM NaOH and then 10 mM NiSO4, with ultrapure water before and after each solution. During chromatography, the absorbance was monitored at 232 nm, corresponding to the peptide bond absorption 23. The absorbance of the second blank was used for baseline subtraction.
3. Results and Discussion
3.1. Peptide-metal ion interaction characterization
3.1.1. Theoretical physical-chemical and structural parameters of peptides
The theoretical structures of studied peptides were plotted using Chemdraw free software (Figure S1). According to Sigel, peptide-metal ion chelation is favoured by the existence of anchors such as histidine
in the peptide sequence 24. Strong interactions are also expected when coordinating groups like hydroxyl(-OH), amine(-NH2), or carboxylate(-COO-) are presented in the side chain of the peptide. Besides, physical-chemical properties of peptides were estimated according to PepCalc (Supplementary information. Table S2). They were further used to interpret the experimental chromatographic results. At pH 7.4, negatively charged peptides are able to interact with positively charged metal ion Ni2+. Some peptides presented a negative charge of -0.9 (i.e. DMH, DAH, DTH, DSH, and EAH). According to Table S2, most of the investigated peptides possess an iso-electric point lower than 7.4, except HHH, RTH, GNH, HGH and HW. Hence, these peptides are negatively charged under operating condition (pH 7.4) and their interaction with positively charged Ni2+ may be favoured.
According to Sigel and Martin 24, the chelate effect between peptide and metal ion is favoured with the presence of anchor present inside a peptide sequence such as histidine (i.e. HGH, HHH, DAH etc.). Besides, we expect a favoured interaction between peptide and metal ion when coordinating groups such as hydroxyl (OH), amine (NH2) or carboxylate are present in the side chain of a given peptide.
3.1.2. Surface Plasmon Resonance sensorgramms and determination of binding parameters In SPR, peptides were studied over a range of concentrations, injected to react with the Ni2+ on the NTA-Ni2+ chip. As example, the off-set-corrected sensorgramms obtained on NCS, HGH and HW peptides are given in Figure 1. Whole sensorgramms of all the investigated peptides are presented in supplementary data (Figure S2). When a given peptide presents an affinity with Ni2+ and its concentration is increased, the Ni2+ is saturated with peptides, corresponding to a plateau value (i.e. no more metal ions available for peptides in excess). In the range of concentration studied, all the investigated peptides (i.e. HHH, HGH, HW, NCS, DAH, DTH, DSH, EAH, CAH, RTH, and GNH) showed saturation.
From these sensorgramms, all the binding constants (Rmax, KD and KA) were determined according to the
1:1 binding model fit (Equation 1), the Rmax being corrected by the off-set value of the corresponding isotherm (Table 2).
The higher the KA value or the lower the KD value, the better the peptide affinity with metal ion.
Hereafter, the KA is used to describe the affinity of peptides for immobilized Ni2+.
The KA value of HHH was of 1.44 × 10⁴ M-1. In 2009, Knecht et al. 25 found a KA value for HHH of 2
× 105 M-1, similar to our results considering our experimental conditions. We used Phosphate buffer with salt instead of HEPES with salt and EDTA in their experiments. Generally, other parameters of the method were similar. When considering Table 2, the affinity of peptides for Ni2+ evolves in the following rank:
HHH>HW>HGH>NCS>DTH>CAH>DAH>DSH>GNH>EAH>RTH.
Generally, the Histidine-containing peptides present a noticeable affinity with metal ions, with KA varying
from 1.61 × 10² M-1 to 1.44 × 10⁴ M-1 for those containing either one or two His residues.
The KA values for HHH, HGH and HW are comprised within 103-104 M-1 and are respectively 10 or 100
times higher than those of the others peptides (~102 M-1). Hence, except for HW, peptides sequences containing two His residues present a higher affinity with Ni2+ as compared with peptides containing a single or no His residue.
The investigated peptides present either the His residue in the N-terminal part (i.e. HW, HHH, HGH), or in the C-terminus (i.e. RTH, DTH, GGH etc.). The first group presents a higher affinity with Ni2+ than the second one. In agreement with Liler 26, the metal ion chelation is stronger when substitution occurs on the amide nitrogen bound rather than through the substitution of hydrogen on the amide oxygen. Hence, His residue seems important for peptide adsorption onto the immobilized Ni2+. These results agree with the study of Porath et al. 17 concerning the histidine- metal chelation capacity.
3.2. Immobilised Metal ion Affinity Chromatography metal-chelating
peptide elution
3.2.1 IMAC numerical simulation
The SPR adapted parameters used for the simulations (i.e. KA (g/L) and qmax (g/L)) and according to our
developed model, the simulated retention times obtained are presented in Table 2.
For the majority of investigated peptides (i.e. EAH, DSH, NCS, RTH, DTH, DAH, CAH, and GNH), the simulated retention time evolved form 0.54 min up to 0.78 min. For peptides with higher binding affinity parameters in SPR (HGH, HW and HHH), the simulated retention time was respectively of 4.18 min, 10.02 min and 10.34 min.
3.2.2 Experimental chromatography
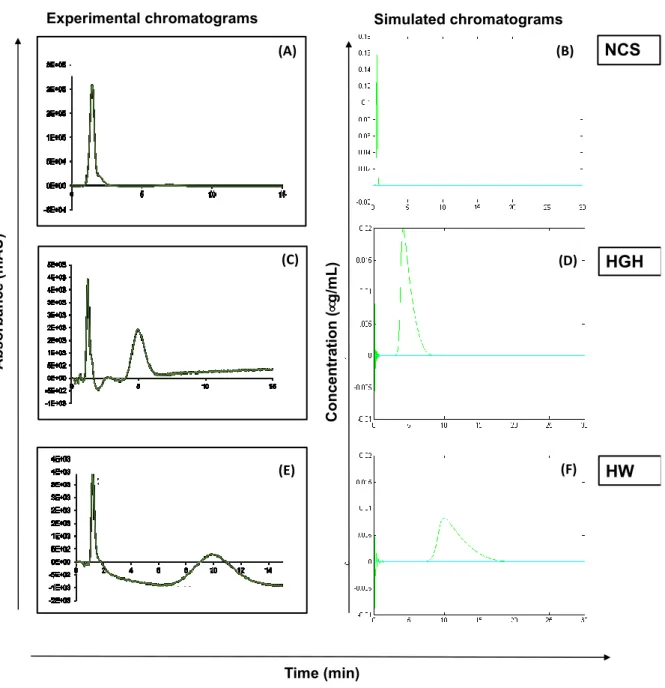
The Figure 2 presents the experimental chromatograms obtained for an elution carried out in the absence of imidazole for peptides NCS, HGH and HW taken as examples (Figure S3 in supplementary data for whole chromatograms). Whatever the peptide studied, a peak is observed at about 1.2 min. This value corresponds to the time required for a non-retained species to go through the tubes and the column interstitial volume, until reaching the detector. This species may be an impurity, present in the various peptides investigated.
The time required to go through the tubes and the detector (tm, min) is therefore given by Equation 9.
with (min), the time required to go through column interstitial volume. The former t0 value can be calculated using Equation 10.
- is the porosity of the column (=0.48), - V is the volume of the column (V=1 mL) - and Q the flow rate (Q=1mL/min).
According to our experimental conditions, is determined to be equal to 0.48 min and the
value can be calculated as equal to 0.72 min. Hence, each experimental retention time value (tR, min) must be corrected by the former calculated value in order to evaluate the retention time in the column solely.
The experimental retention times, corrected or not by the tm are gathered in Table 2. Note that for DTH
peptide, the chromatogram presents several peaks and the choice of the appropriate peak is uncertain. Besides, the 3 most retained peptides (i.e. HGH, HW and HHH) in experimental IMAC are those presenting indeed the highest affinity constant determined in SPR.
3.2.3 Comparison between simulation and experimentation
The Figure 2 compares the experimental and the simulated chromatograms for peptides HGH, NCS and HW solely. These compounds were chosen since their simulated retention times were in good agreement with the experimental one in the absence of imidazole (Table 2). As previously mentioned, the experimental set up includes tubes and detector whereas simulations take only into account the retention in the column. The correction factor, tm value of 0.72 min, must therefore be considered to compare
experimental and simulated chromatograms, which are in quite good agreement.
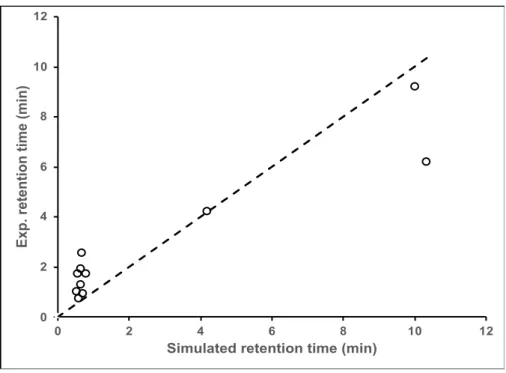
Figure 3, presenting the experimental retention time measured in IMAC as a function of the simulated retention time using our developed model, allows the comparison of the retention time obtained either by experiment or simulation for all the studied peptides. It can be observed that for the peptide species weakly bound (i.e. EAH, DSH, RTH, DTH, DAH, CAH, GNH), the simulation slightly underestimates the retention times whereas for the most retained peptides species (i.e. HW and HHH), this one is over-estimated. Despite these gaps, the trend is correct since the peptides are distributed close the bisectrix.
Hence, from data obtained in SPR, we can simulate with accuracy the peptide retention in a IMAC column.
In our study, the elution chromatography was simulated at low peptide concentration. Hence, the retention time depends mainly on the slope (KA qmax) of the isotherm at the origin corresponding to the
linear part of the isotherm while the qmax asymptotic value has almost no significant impact on this retention time. Therefore, the correct trend between simulation and experimental retention time tends to validate the product but further work must be carried out to estimate each value, which must be
transposed for IMAC separately. Indeed, each value of KA and qmax taken independently have an impact
on the shape of the Langmuir isotherm. These former values affect the shape of chromatograms obtained, notably on the diffusive rear. We can observe that the rear of chromatogram is more diffusive in the case of simulation contrarily to those observed in the case of chromatographic experiments. This observation justifies the work planned in perspectives to estimate each value of KA and qmax
independently.
3.3. Application of simulation: imidazole concentration effect on the peptide
retention time
In order to optimize the separation time and to evaluate the effect of the imidazole concentration on the retention time, some simulations can be done. In this latter case, the Langmuir competitive sorption isotherm described by Equation 5 was used with (L/g) and (g/L) parameters determined for
imidazole in SPR and adapted for IMAC simulation given in Table 2.
As example, the Figure 4 presents the evolution of the simulated retention time of HW as a function of the imidazole concentration in the case of isocratic elution. Figure 4 was obtained from 22 simulations launched at fixed imidazole concentration, each simulation giving a simulated retention time.
Similarly, some simulations were carried out to optimise a gradient in the case of multi-component separations. The Figure 5 compares the separation of HW, HGH and NCS in the absence (panel A) and in the presence (panel B) of imidazole gradient varying from 0 to 100 mM, for 30 min. It can be observed
min, while keeping a good separation. These simulations are presented in order to illustrate some examples of applications of the simulation tool we developed, even if we do not have the corresponding experimental measurements to confront experience and simulations.
4
Conclusion and Perspectives
The aim of this work was to simulate peptide elution in Ni2+-IMAC from SPR data in order to predict chromatographic separation. While taking into account the advantages of biosensors over IMAC chromatography in terms of peptide quantity and solvent volumes used, experimental cost could be largely reduced before launching time-consuming separation steps.
An appropriate simulation would enable to predict the peptides’ retention time in IMAC and the effect of the imidazole concentration upon elution. In this work, the IMAC behaviour of 11 small-sized peptides (mainly di and tri-peptides) was simulated by a MatLab® program from their affinity constant and capacity determined in SPR and then confronted to experimental data obtained in IMAC chromatography. A transport-dispersive model, along with Langmuir adsorption isotherm, was chosen for numerical simulation of IMAC. The comparison of simulated IMAC retention times with the experimental ones proved that the modelling was correct, which tends to validate the transposition of the product KAqmax from SPR to IMAC. Simulation developed in this work can provide both a general idea on the time of retention in IMAC and the effect of imidazole concentration on elution behaviour. Hence, the order of peptide affinity determined in SPR gives a trend for the peptide elution in IMAC, where the di and tri-peptides containing either two histidine residues (i.e. HHH and HGH) or a N-term histidine (i.e. HW) can be detected as having affinity with Ni(II), at the same time, they can be adsorbed to the Ni(II) on the IMAC column. To confirm this trend, the same methodology should be applied to a larger bank of peptide (~200 peptides).
The perspectives of this work focus on the estimation of both KA and qmax value itself for IMAC
simulations (and not only the KA qmax product), that could be applied to higher concentration ranges in
peptide. The knowledge of these data will enable to simulate chromatographic modes such as frontal chromatography for preparative purposes.
Methodology aiming at predicting qmax, IMAC from qmax, SPR must be developed. For that purpose, qmax,,IMAC should be experimentally determined for imidazole and for several peptides using frontal chromatography, which requires a significant amount of pure peptides. Calculation of the ratio
for imidazole and
peptides should allow to check whether this ratio presents a significant variation or not whatever the peptide sequence. If this ratio presents small variations, the methodology will rely on the determination of this ratio for imidazole only, avoiding the need of a significant amount of expensive pure peptides. Besides, the values of KA and qmax will be further adjusted and validated by comparison of the rear of the
chromatograms (simulated versus experimental).
Finally, the approach set up in our work for simple sites should be deepen for more complex systems as initiated by Forssen et al. 15.
Acknowledgments
The authors would like to thank Jingwen TAN, Jingiao REN, Hugo MARTINS-LIBONE. Besides, they acknowledge support of the “Laboratoire Réactions et Génie des Procédés” by the "Impact Biomolecules" project of the "Lorraine Université d'Excellence"(Investissements d’avenir – ANR project number 15-004).
Conflict of interest: none
5
References
1 Valeur E., Guéret S.M., Adihou H., Gopalakrishnan R., Lemurell M., Waldmann H.,
Grossmann T.N., Plowright A.T., New modalities for challenging target in drug discovery.
Angew. Chem. Int. Ed. 2017, 56, 10294–10323.
2 Marczak E.D., Usui H., Fujita H., Yang Y., Yokoo M., Lipkowski A.W., Yoshikawa M., New
antihypertensive peptides isolated from rapeseed. Peptides, 2003, 24, 791-98.
3 Pihlanto-Leppälä A., Bioactive peptides derived from bovine whey proteins: opioid and
ace-inhibitory peptides. Trends Food Sci. Technol., 2000, ,11, 347-56.
4 Ariyoshi Y., Angiotensin-converting enzyme inhibitors derived from food proteins. Trends
Food Sci. Technol., 1993, 4, 139-144.
5 Messina M., Messina V., Increasing use of soyfoods and their potential role in cancer
prevention. J. American Diet. Assoc., 1991, 91, 836-40.
6 Wong J.W., Albright R.L., Wang N.-H., Immobilized metal ion affinity chromatography
(IMAC) chemistry and bioseparation applications. Sep. Purif. Methods, 1991, 20: 49-106.
7 Porath J., IMAC-Immobilized metal ion affinity based chromatography., TrAC Trends Anal.
Chem., 1988, 7, 254-59.
8 Alhazmi H.A., Nachbar M., Albishri H.M., Abd El-Hady D., Redweik S., El Deeb S. Watzig
H., A comprehensive platform to investigate protein-metal ion interactions by affinity
capillary electrophoresis. J. Pharm. Biomed. Anal. 2015, 107, 311-317.
9 Helfferich F., Ligand exchange: a novel separation technique. Nature, 1961, 189, 1001-02.
10 Weinberger S.R, Morris T.S., Pawlak M. Recent trends in protein biochip technology,
Pharmacogenomics, 2000, 1, 395-416.
11 Hernández V.A., Samuelsson J., Forssén P., Fornstedt T. Enhanced interpretation of
adsorption data generated by liquid chromatography and by modern biosensors. J.
Chromato A., 2013, 1317, 22-31.
12 Arnell R., Ferrza N., and Fornstedt T. Analytical Characterization of Chiral Drug-Protein Interactions: Comparison between the Optical Biosensor (Surface Plasmon Resonance) Assay and the HPLC Perturbation Method. Anal. Chem. 2006, 78, 1682-1689.
13 Jönsson U., Fägerstam, L., Löfas, S., Stenberg, E., Karlsson, R., Frostell, A., Markey, F. and
Schindler, F., Introducing a biosensor based technology for real-time biospecific
interaction analysis. In Ann. biol. clin., 1992, 19-26.
14 Vunnum S., Gallant S.R., Kim Y.J., Cramer S.M., Immobilized metal affinity chromatography: Modeling of nonlinear multicomponent equilibrium. Chem. Eng. Sci., 1995, 50,11, 1785-1803.
15 orsse n P., Multia E., Samuelsson J., Andersson M., Aastrup T., Altun S., Wallinder D., Wallbing L., Liangsupree T., Riekkola M.-L., and Fornstedt T. Reliable Strategy for Analysis of Complex Biosensor Data. Anal. Chem., 2018, 90, 5366-5374.
16 Fornstedt T., Forssén P., Westerlund D. Basic HPLC Theory and Definitions:
Retention,Thermodynamics, Selectivity, Zone Spreading, Kinetics, and Resolution, in: V. Pino, J.L. Anderson, A. Berthod, A.M. Stalcup (Eds.), Anal.Sep. Sci., Wiley-VCH Verlag GmbH & Co. KGaA, Weinheim, Germany, 2015: pp.
1-24.http://doi.wiley.com/10.1002/9783527678129.assep001 (accessed January 23, 2017).
17 Porath J., Carlsson J., Olsson I., Belfrage G., Metal chelate affinity chromatography, a new
approach to protein fractionation. Nature, 1975 258: 598-599.
18 Hemdan E.S., Porath J., Development of immobilized metal affinity chromatography: II.
Interaction of amino acids with immobilized nickel iminodiacetate. J. Chromatogr. A, 1985,
323: 255-64.
19 Canabady-Rochelle L., Selmeczi K., Collin S., Pacs A., Muhr L. and Boschi-Muller S. SPR
Screening of Metal chelating Peptides for their Antioxidant Properties. Food Chem., 2018,
239, 478-485.
20 Fornstedt T. Characterization of adsorption processes in analytical liquid-solid chromatography. J. of
Chromatogr. A, 2010, 1217: 792–812.
21
Merwe
P.A.
2018.
Surface
plasmon
resonance.
From
biophysics:
http://www.biophysics.bioc.cam.ac.uk/wp-content/uploads/2011/02/spr1.pdf
22 Guiochon G., Felinger A., Shirazi, D.G., Katti A.M., Fundamentals of Preparative and Nonlinear Chromatography, 2nd Ed. San Diego: Academic Press imprint of Elsevier, Boston, MA, 2006.
23 Schmid F.X., Biological Macromolecules: UV‐visible Spectrophotometry, eLS. 2001.
24 Sigel H., Martin R.B. Coordinating properties of the amide bond. Stability and structure of
metal ion complexes of peptides and related ligands. Chem. Rev., 1982, 82: 385-426.
25 Knecht S., Ricklin D., Eberle A.N., Ernst B., Oligohis-tags: Mechanisms of binding to Ni2+-NTAsurfaces. J. Mol. Recognit., 2009, 22, 270–279.
2
6 Liler M., Studies of nuclear magnetic resonance chemical shifts caused by protonation. Part
I. Substituted acetamides and some N-methyl-and NN-dimethyl-derivatives. J. Chem. Soc.
B: Phys. Org. 1969, 385-89.
Figure 1. Sorption isotherms obtained for NCS, HGH and HW model peptides corrected by the offset. 0 5 10 15 20
0.E+00 1.E-02 2.E-02 3.E-02 4.E-02 5.E-02
0 20 40 60 80
0.E+00 2.E-04 4.E-04 6.E-04 8.E-04 1.E-03
-20 0 20 40 60 80 100
0.E+00 5.E-04 1.E-03 2.E-03
NCS HGH HW R e sp o n s e (R U ) Concentration (M)
Figure 2. Comparison between experimental chromatograms obtained during elution without imidazole for some peptides (NCS, HGH, and HW) (= 232 nm) and their simulated chromatograms. Panels (A), (C) and (E): experimental chromatograms. Panels (B), (D) and (F): Simulated chromatograms.
Simulated chromatograms NCS HW HGH C o n ce n tr at io n ( µ g /m L ) Experimental chromatograms HGH HW NCS A b so rb a n ce ( m A U ) Time (min) (A) (B) (C) (E) (D) (F)
Figure 3. Comparison of experimental and simulated retention time in IMAC.
Figure 4. Evolution of the simulated retention time of HW as a function of the imidazole concentration for an elution carried out in isocratic mode.
0 2 4 6 8 10 12 0 2 4 6 8 10 12 E xp . r et en ti o n t im e (m in )
Simulated retention time (min)
0 2 4 6 8 10 12 0 0.02 0.04 0.06 0.08 0.1 0.12 S im u la te d r e te n ti o n t im e (m in ) Imidazole Concentration (M)
Figure 5. Simulation of the separation of HW, HGH and NCS without (A) and with (B) an imidazole gradient, varying from 0 to 100 mM in 30 minutes.
(A)
(B)
Time (min) Time (min) C o n c e n tr a ti o n ( mg /m L ) C o n c en tr a ti o n ( mg /m L )Table 1. Parameters used for Matlab® numerical simulation and IMAC experiments.
Parameters
Value
Unit
Matlab numerical simulation
Column diameter 0.7 cm
Column height 2.5 cm
Flow rate 1 mL/min
Simulation time 30 min
Gradient of imidazole 100/30 mM/min
Total porosity* 0.48
Lumped mass transfer coefficient (km) *
1.00E+06 min-1
Apparent axial dispersion coefficient
(DL) * 0.05 cm 2/s
IMAC experiments
Binding buffer PBS 1X: 6.7 mM Na2HPO4, 1.25 mM KH2PO4 and 15 mM NaCl, pH 7.4 Elution bufferImidazole solution with linear concentration gradient from 0 to 100mM
mM
Elution time 30 min
Sample volume 50 μL
Peptide sample concentration 2 mM
Column regeneration frequency After every peptide assay
Table 2. Simulated retention times obtained from SPR experimental data and experimental retention times obtained in IMAC.