Publisher’s version / Version de l'éditeur:
Journal of Materials in Civil Engineering, 5, 1, pp. 83-95, 1993-02
READ THESE TERMS AND CONDITIONS CAREFULLY BEFORE USING THIS WEBSITE.
https://nrc-publications.canada.ca/eng/copyright
Vous avez des questions? Nous pouvons vous aider. Pour communiquer directement avec un auteur, consultez la
première page de la revue dans laquelle son article a été publié afin de trouver ses coordonnées. Si vous n’arrivez pas à les repérer, communiquez avec nous à [email protected].
Questions? Contact the NRC Publications Archive team at
[email protected]. If you wish to email the authors directly, please see the first page of the publication for their contact information.
NRC Publications Archive
Archives des publications du CNRC
This publication could be one of several versions: author’s original, accepted manuscript or the publisher’s version. / La version de cette publication peut être l’une des suivantes : la version prépublication de l’auteur, la version acceptée du manuscrit ou la version de l’éditeur.
Access and use of this website and the material on it are subject to the Terms and Conditions set forth at
Ranking PVC roofing membranes using thermal analysis
Paroli, R. M.; Dutt, O.; Delgado, A. H.; Stenman, H. K.
https://publications-cnrc.canada.ca/fra/droits
L’accès à ce site Web et l’utilisation de son contenu sont assujettis aux conditions présentées dans le site LISEZ CES CONDITIONS ATTENTIVEMENT AVANT D’UTILISER CE SITE WEB.
NRC Publications Record / Notice d'Archives des publications de CNRC:
https://nrc-publications.canada.ca/eng/view/object/?id=3c4e334f-dd11-43aa-b8d5-1fe2cb4e1f60 https://publications-cnrc.canada.ca/fra/voir/objet/?id=3c4e334f-dd11-43aa-b8d5-1fe2cb4e1f60R A N K I N G P V C R O O F I N G M E M B R A N E S U S I N G T H E R M A L A N A L Y S I S
By R. M. Paroli, I O. Dutt, 2 A. H. Deigado 3 and H. K. Stenman 4 ABSTRACT: The effects of accelerated heat aging on three polyvinyl chloride (PVC)
roofing membranes was determined using thermogravimetry (TG), dynamic me- chanical thermal analysis (DMA), and tensile testing. The heat aging was done at 100~ and 130~ In general, it was found that the degradation of the reinforced PVC roofing membranes was proportional to the aging temperature and exposure time. Furthermore, it was found that these thermoanalytical techniques can be used to not only record the changes incurred by the samples due to heat aging, but also to provide a ranking of the heat stability of the various materials. The order of stability, using these techniques, was determined to be V1 < V3 < V2, which corresponded with the observed order of stability from actual records obtained on roofs. The results obtained demonstrate that TG and DMA, in conjunction with tensile testing, provide a viable, routine method of evaluating the quality of single- ply PVC-based roofing membranes.
INTRODUCTION
Polyvinyl chloride (PVC) has b e e n studied for m a n y years, and its me- chanical and chemical p r o p e r t i e s are quite well known ( A b b a s and Sorvik 1975; Turi 1981; Titow 1984; W y p y c h 1985, 1986; F e l d m a n 1989). A l t h o u g h thermal analysis techniques have b e e n used quite extensively in the chemical characterization o f PVC, they have rarely b e e n applied to the study of PVC- based roofing materials. The roofing industry has generally relied on me- chanical testing as an indicator of quality and performance. Since roofing materials range in composition from p o l y m e r - m o d i f i e d b i t u m e n to P V C and e t h y l e n e - p r o p y l e n e - d i e n e m o n o m e r ( E P D M ) r u b b e r with a variety of re- inforcement, it is difficult to predict their long-term b e h a v i o r solely on the basis of results from mechanical tests. To reduce the time r e q u i r e d to eval- uate the durability of roofing m e m b r a n e s , accelerated aging by artificial weathering is used. The artificial weathering systems simulate t e m p e r a t u r e , humidity, and solar radiation; often, the individual p a r a m e t e r s in the arti- ficial weathering systems are m o r e intense than the average values u n d e r general exposure conditions. Following the heat-aging process, the materials were tested and the results were c o m p a r e d with those o b t a i n e d using well- known standards. It is very difficult, and p e r h a p s even unjustified, to com- p a r e the mechanical p r o p e r t i e s of a range of materials from b i t u m e n - b a s e d to p o l y m e r - b a s e d , without taking into account the micro and cfiemical pro- cesses involved. The b e h a v i o r of these materials is related to macroscopic
1Res. Ofcr., Inst. for Res. in Constr., Nat. Res. Council of Canada, Ottawa, Ontario, Canada K I A 0R6.
2Sr. Res. Ofcr., Inst. for Res. in Constr., Nat. Res. Council of Canada, Ottawa, Ontario, Canada K I A 0R6.
3Tech. Ofcr., Inst. for Res. in Constr., Nat. Res. Council of Canada, Ottawa, Ontario, Canada K I A 0R6.
4Mgr., Arch. and Engr., Services, Dept. of Real Estate, Canada Post Corp., Ottawa, Ontario, Canada K I A 0B1.
Note. Discussion open until July 1, 1993. To extend the closing date one month, a written request must be filed with the ASCE Manager of Journals. The manuscript for this paper was submitted for review and possible publication on January 28, 1992. This paper is part of the Journal of Materials in Civil Engineering, Vol. 5, No. 1, February, 1993. 9 ISSN 0899-1561/93/0001-0083/$1.00 + $. 15 per page. Paper No. 1844.
behavior, and to the chemical composition and molecular arrangement. Although simulation is helpful in predicting the performance of materials, it is of paramount importance that the behavior of the material be under- stood. It is for this reason that the Counseil International du Batiment pour la Recherche, l'Etude et la Documentation/R6union Internationale des Lab- oratories d'Essai et de Recherche sur les M~iteriaux et los Constructions (CIB/RILEM) Joint Committee on Membrane Roofing Systems (that in- cludes elastomeric, thermoplastic, and modified-bituminous roofing) has initiated investigation on the applicability of thermal analysis or thermoan- alytical techniques. Our previous work has demonstrated that thermogra- vimetry (TG) and dynamic mechanical analysis (DMA) can be used to predict the relative durabilities of EPDM-based roofing membranes (Dutt et al. 1990; Paroli et al. 1990).
Thermogravimetry (TG) can be used to determine how the chemical composition has been altered by heat aging, and D M A can provide infor- mation on changes in glass transition temperatures (Tg), the storage modulus (a measure of hardness), and the loss moduli (associated with energy ab- sorption, e.g., degradation of macromolecules). The objective of this study is to examine how thermal techniques can be used to characterize and rank PVC-based roofing membranes in conjunction with conventional mechanical tests when attempting to solve problems related to roofing materials.
EXPERIMENTAL
Sample Preparation
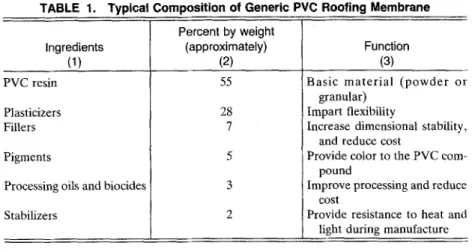
Three commercially available PVC roofing membranes were obtained and labeled as V1, V2, and V3. A typical composition for the PVC roofing samples used in the thermal analyses, as well as the mechanical tests, is given in Table 1. Each material was cut into seven pieces of about 150 mm • 250 ram. One piece was used as a control, three were placed in an air- circulating oven preheated at 100~ and the remaining three were placed in an air-circulating oven set at 130~ for heat aging. One piece of each material was removed from the oven, in turn, after one, seven, and 28 days, and specimens were then cut out for tensile testing and thermal analyses.
TABLE 1. Typical Composition of Generic PVC Roofing Membrane
Percent by weight
Ingredients (approximately) Function
(1) (2) (3)
PVC resin Plasticizers Fillers Pigments
Processing oils and biocides Stabilizers 55 28 7 5 3 2
Basic material (powder or granular)
impart flexibility
Increase dimensional stability, and reduce cost
Provide color to the PVC com- pound
Improve processing and reduce cost
Provide resistance to heat and light during manufacture
Dynamic Mechanical Analysis
The PVC control and aged samples were cut ( - 1 m m thick, 5 m m long, 12 m m deep) and tested in a Polymer Laboratory dynamic mechanical thermal analyzer ( P L - D M T A Mark I) using software version 4.0. The experimental profile was as follows: a fixed frequency of 10 Hz; a heating rate of 2~ min-1; and a temperature range between - 1 2 0 ~ and 80~ The D M A was operated in the single cantilever mode using test frame L and clamp type C. In the Polymer Laboratory system, a sinusoidal stress is applied to a vibrator unit using a sinusoidal current. The stress imposed upon the specimen is therefore directly related to the amount of current delivered to the vibrator. The sample is subjected to strain via the induced displacement. A more detailed description is presented in Dutt et al. (1990).
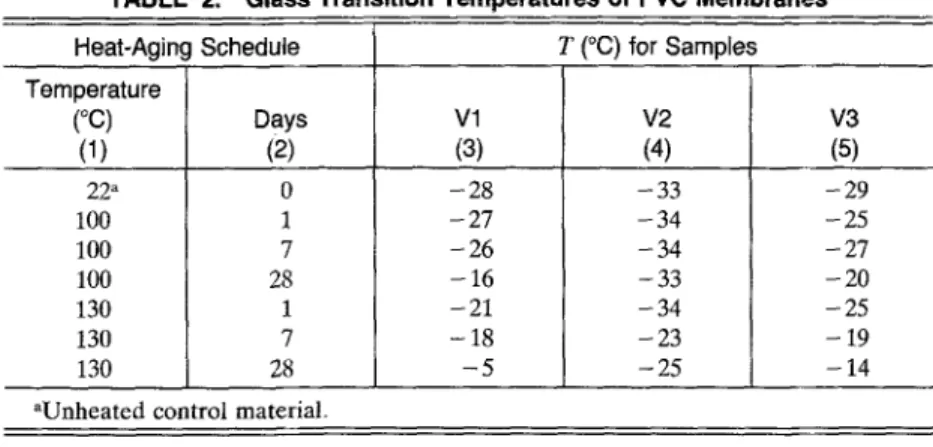
The glass transition temperatures (a-transition) values were obtained from the maximum in the loss modulus (E") versus temperature curve. The glass transition temperature data for all three samples are summa- rized in Table 2.
Thermogravimetric Analysis
A DuPont Instruments model 951 thermogravimetric analyzer inter- faced to a model 9900 and 1090 computer was used to record the weight loss of each PVC roofing sample. Approximately 25-40 mg of sample was cut using a hole puncher to ensure a uniform shape and a better contact with the sample pan. The analyses were carried out at tempera- tures between 20~ and 800~ using a nitrogen gas flow of 100 m L / m i n - 1 and a scanning rate of 20~ Although both the weight loss (TG) and the computer calculated first derivative weight loss ( D T G ) curves were recorded, only the D T G curve was used because it provided the desired quantitative data. The data obtained from the D T G curves are tabulated in Table 3 as a function of heat-aging temperature and exposure time.
Tensile Testing
The heat-aged material was conditioned at room temperature (22~ _+ 2~ for a minimum of 24 h prior to testing. The control and aged specimens were cut using a dumbbell-shaped die in a hydraulic press (overall dimen- sions were 149.16 m m long and 37.5 m m wide). The tests were carried out
TABLE 2. Glass Transition Temperatures of PVC Membranes
Heat-Aging Schedule T (~ for Samples Temperature (~ Days Vl V2 V3 (1) (2) (3) (4) (5) 22 a 100 100 100 130 130 130 0 1 7 28 1 7 28 -28 -27 -26 -16 -21 -18 - 5 -33 -34 -34 -33 -34 -23 -25 -29 -25 -27 -20 -25 - 19 -14 aUnheated control material.
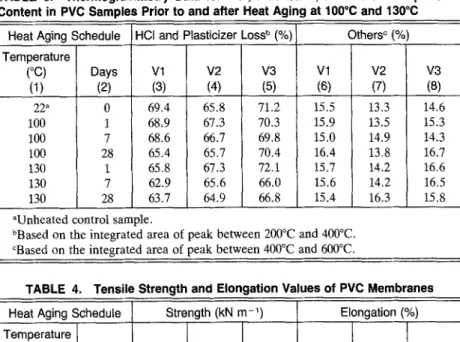
TABLE 3. Thermogravimetry Data for HCI, Plasticizer, and Other Components Content in PVC Samples Prior to and after Heat Aging at 100~ and 130~
Heat Aging Schedule HCI and Plasticizer Loss b (%) Others ~ (%) Temperature (~ Days V1 V2 V3 V1 V2 V3 (1) (2) (3) (4) (5) (6) (7) (8) 22" 0 69.4 65.8 71.2 15.5 13.3 14.6 100 1 68~9 67.3 70.3 15.9 13.5 15,3 100 7 68.6 66.7 I 69.8 15.0 14.9 14,3 100 28 65.4 65.7 I 70.4 16.4 13,8 16,7 130 1 65.8 67.3 72.1 15,7 14.2 16,6 130 7 62.9 65.6 66.0 15.6 14.2 16.5 130 28 63.7 64.9 66.8 15.4 16.3 15.8
aUnheated control sample.
bBased on the integrated area of peak between 200~ and 400~ cBased on the integrated area of peak between 400~ and 600~
TABLE 4. Tensile Strength and Elongation Values of PVC Membranes
Heat Aging Schedule Strength (kN m -1) Elongation (%) Temperature (~ Days V1 I V2 V3 V1 V2 V3 (1) (2) (3) (4) (5) (6) (7) (8) 22" 0 31.1 28.9 29.7 124 65 229 100 1 27.5 28.8 29,1 149 47 153 100 7 31.9 23.4 33.0 124 54 175 100 28 33.6 27.5 33.7 51 47 158 130 1 28.9 24.7 30.7 139 89 201 130 7 35.2 25.2 34.0 47 54 165 130 28 32.6 25.4 29.8 45 22 183
"Unheated control material.
at r o o m t e m p e r a t u r e using an Instron tensile tester (model 1122) with a gauge length of 60 m m and a cross-head speed of 60 m m / m i n - 1 . The load and elongation curves were r e c o r d e d on the machine chart r e c o r d e r , as well as stored in the computer. Five specimens were tested for each heat con- ditioning, and the m e a n values of l o a d and e l o n g a t i o n - a t - b r e a k were re- corded (Table 4).
RESULTS AND ANALYSIS
Dynamic Mechanical Analysis
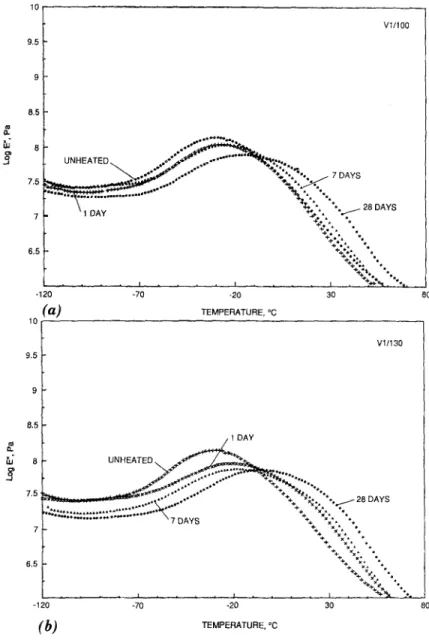
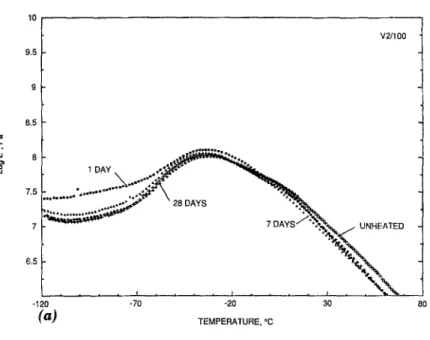
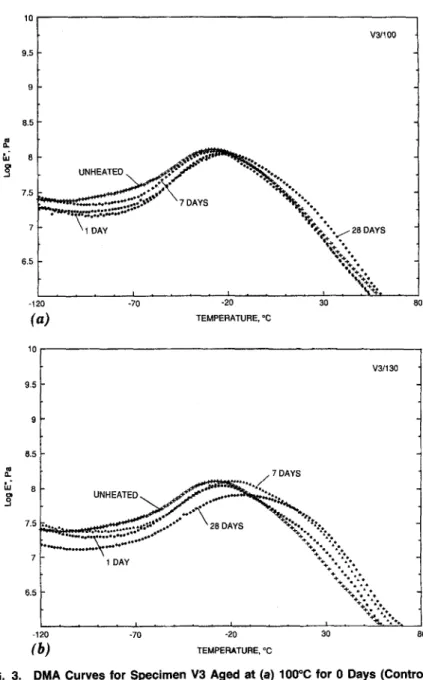
The D M A curves for samples V1, V2, and V3 h e a t aged at 100~ and 130~ are p l o t t e d in Figs. 1 - 3 , respectively. The glass transition t e m p e r a - tures
(Tg)
for all t h r e e P V C samples increased after h e a t aging. The sample that a p p e a r e d to be the most stable of the three was V2. A s can be seen from Fig. 2 and Table 2, the To for this sample did not vary much, even after 28 days of h e a t aging at 1~)0~ The Tg did show a change of - 1 0 ~ when s u b j e c t e d to the m o r e severe t e m p e r a t u r e of 130~ for seven and 28 days. TheTg
for sample V1 w e n t from - 2 8 ~ (control) up to - 16~ after28 days at 100~ The most substantial change occurred when V1 was ex- posed to 130~ for 28 days; the T~ after this heat aging was - 5 ~ PVC sample V3 appears to be more stabl~ than V1, as its Tg changed from - 29~ (control) to - 20~ after being heat aged for 28 days at 100~ and - 14~ after being heat aged for 28 days at 130~
The changes observed in the glass transition temperatures of the PVC
10 9 5 9 8 5 7 . 5 7 V~/100 6.5 - 1 2 0
(a)
10 U N H E A T E D ~ . o ~ , ... . . . . . . . " C . '.. f DAY 1 D A Y .,~,', " , + ~ . , , .. ++~ . + . % ~ ++%, , +p,% , . . . . ~ . . . I . . . t . ~.-,.**"~. " - . . - 7 0 -20 3 0 T E M P E R A T U R E . ~ 80 V 1 / 1 3 0 9.5 9 8.5..j1DAu
++ ...~o2.;.,,,.~.. 9 . o.~176 7"5 ~ I ~ " J J "" . . " *+ % , * " -- . . o " ~ ++ x . . *o ~ 2 8 D A Y S , ~ , , , , . ~ 1 7 6 1 7 6 1 7 6 9 1 4 9 o~*o + x 9 o 7 D A Y S + x 9 9 + x . 9 7 % ~ . , ~ +., xx. , . ++ ~,,. . 6.s %§ ";" " % Z , "-. . . . . ~ . . . J . . . ~ . . *++'~ "..,, - 1 2 0 -70 -20 3 0(b)
T E M P E R A T U R E . ~ 8 0FIG. 1. DMA Curves for Specimen V1 Aged at: (a) 100~ for 0 Days (Control), 1 Day (1/100), 7 Days (7/100), and 28 Days (28/100); and (b) 130~ for 0 Days (Control), 1 Day (1/130), 7 Days (7/130), and 28 Days (28/130)
#. tu o~ _a 9.5 9 8.5 8 7.5 7 6.5 -120
(-)
V2/1001 DAY_.x. "
~
... " ... :-: 2sDAYs%N.
-70 -20 30 TEMPERATURE, ~ 80 10 9.5 9 8,5 ~u 8 7.5 7 6.5 V2/130 1 D A Y ~ ~ ~ ! % " . . . ' ~ , b - ",'V~.,~.o j 7 DAYS ... ~ "~.'.,~,~..Zo.W.
.,, . .t, o~% 9 - = : . . . . -120 -70 -20 30 ( b ) TEMPERATURE. ~ 80FIG. 2. DMA Curves for Specimen V2 Aged at (a): 100~ for 0 Days (Control), 1 Day (1/100), 7 Days (7/100), and 28 Days (28/100); and (b) 130~ for 0 Days (Control), 1 Day (1/130), 7 Days (7/130), and 28 Days (28/130)
samples can be attributed to the loss of plasticizer from the specimens, and also to the loss of HCI. The loss of HC1 is also the cause of the discoloration that is commonly observed after the samples have been heat aged. The zip- like thermal degradation mechanism of PVC is believed to be as follows
(Wypych 1985, 1986):
- C H 2 - C H C 1 - C H 2 - C H C I - C H e - A - C H = C H - C H 2 - C H C 1 - C H 2 - + HC1 A - C H = C H - C H = C H - C H 2 - + HCI . . . (1) The observed discoloration is due to the formation of conjugated double bonds. This autocatalyzed reaction increases the
Tg.
The degradation pro- cess can eventually lead to the deterioration of the backbone of the polymer. At higher temperatures, the thermal degradation of PVC involves both pyrolysis and combustion. Lattimer and Kroenke have proposed that as PVC thermally degrades, aromatic compounds such as benzene are formed (Lattimer and Kroenke 1988).Thermogravimetric Analysis
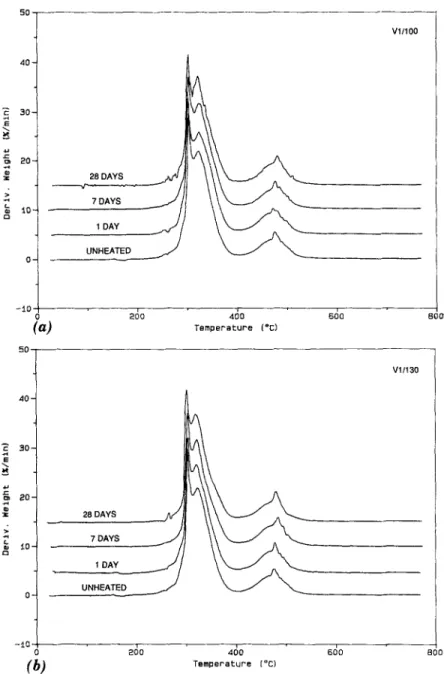
The TG curves for the V1 PVC (control and heated samples) are shown in Fig. 4. As can be seen, under a nitrogen atmosphere approximately 80% of the weight loss occurs between 200 ~ and 600~ In this range, there are two weight-loss regions; the larger loss occurs in the 200-400~ region, and the other loss occurs in the 400-600~ region. As previously mentioned, thermal degradation of PVC is characterized by two types of processes. The primary process, known as dehydrohalogenation, forms polyenes (double- bonds), and the secondary processes involve reactions associated with the newly formed polyenes (Turi 1981). Examples of secondary processes in- clude cross-linking, gel formation, cyclization, chain scission, benzene for- mation, oxidation, and Diels-Alder reaction with additives (Turi 1981). PVC degrades via the elimination of HCI, and does not involve main chain scis- sion. It has been reported that practically all HCI (60 wt%) is released by the time the sample has reached 220~ (Turi 1981). Thermogravimetric- mass spectrometric (TG-MS) studies have shown that the degradation prod- ucts of PVC were composed of HC1, aromatics, and other hydrocarbons such as ethylene, ethane, propylene, xylene, and methane (Stromberg et al. 1959; Mardosky 1964). The first weight loss observed in Fig. 4 (200- 400~ can be attributed to the elimination of HCI and plasticizers, and the weight loss at (400-550~ may result from the volatilization of any of the other components that have been reported above 400~ (Stromberg et al. 1959; Mardosky 1964).
Stabilizers are added to PVC to neutralize the effect of HCI, thus off- setting the catalytic effect of HCI with respect to the degradation of PVC (Wypych 1986). Commercial formulations usually contain a large number of compounding ingredients such as platicizers, impact modifiers, and mold lubricants, in addition to stabilizers (see Table 1). The shoulder occurring between 250~176 (Fig. 4) is probably due to the volatilization of the stabilizer.
Unmodified PVC is one of the least stable polymers used commercially. It is very sensitive to mild heating, with the first sign of discoloration ap- pearing after several hours at temperatures in the range of 100 ~ 140~ (Turi 1981). As can be seen for sample V1 (Fig. 4a), the weight loss in the 200 ~ 400~ region does not vary significantly, even after 28 days of heating at 1000C. Almost no decrease is observed when the sample is heat aged for one day at 1000C. A similar trend is observed when the samples were heated for the same number of days at 130~ [Fig. 4(b)]. The percent weight loss in the region of 400~176 also remains unchanged. The weight loss in the
1 0 9.5 9 8.5 7.5 7 6.5 -120
(.)
V3/100 UNHEATED ~ ~ ~ % , ~ . , ~ , ~ [ . . . - ; , , \ ,*.. "..~ : : : : ; ; : . ; , "
\7
DAYS~."-..
"4.'t.'v*l%ytz.r~'lP~
%.\ 1 DAY
it~';i". /
28 DAYS. . . . t . . . I . . . . t , ,'% '~t -70 -20 30 TEMPERATURE, ~ oD o, 95 9 8.5 8 75 7 ... 9 , / 7 DAYS UNHEATED.
~
. . . . ":,,~
~ ~ " . - " " ~ 28 DAYS § t..,. -'~..,...~:.-':::::, .,-_-...-" *§ 1 DAY 6.5 V3/130 ++ ". 9 % § .. ".. % . . . ; . \ ' . : t . + + . , . § u *** ++. -,*. -20 30 . . . . I =120 -70 80 ( b )TEMPERATURE,
~FIG. 3. DMA Curves for Specimen V3 Aged at (a) 100~ for 0 Days (Control), 1 Day (1/100), 7 Days (7/100), and 28 Days (28/100); and (b) 130~ for 0 Days (Control), 1 Day (1/130), 7 Days (7/130), and 28 Days (28/130)
200~176 for the control sample was 69.4%, after 28 days at 100~ the detected loss was 65.4%, and 63.7% after 28 days at 130~ This slight decrease in weight loss (after heat aging) implies that some HCI had been released during heat aging.
It is well known that dehydrochlorination occurs mainly at the surface, and causes a color change in PVC due to the formation of polyenes (Tuff
5 0 - 4 0 "2 30 ~ 2 0 ~ > o O- -1O
(-)
50 40' 30 ca 20 c~ V1/100j OAYS__
7 DAYS J I DAY UNHEATED , . ~ a~0 4~0 ~ o Boa Temperature (~ Vl/130 ( ~ ) Temperature (~FIG. 4. Derivative TG(DTG) Curve for theY1PVC Sample Heat Agedfor 0 (Un- heated), 1, 7 and 28Days at: (a) 100~ and(b) 130~
1981; Wypych 1985). A visual inspection of the V1 PVC samples heated at t00~ did not reveal any significant sign of discoloration or loss in flexibility until 28 days, whereas the samples heated at 130~ for seven and 28 days became brown and brittle. The loss in flexibility may indicate that the PVC at 130~ has cross-linked and/or lost some of its plasticizer.
50 4 0 . "~ 30" ~ 2 0 " Q -iO 50 4 0 3 0 2 0 == 10' V?J100 28 DAYS 7 DAYS 1 DAY UNHEATED
/a~ 2d0 4do 6do
Temperature (~ BOO 28 DAYS 7 DAYS 1 DAY UNHEATED - i O
O ( b ) 2~o 4~o s~o
TQmgerlture ('C)
V2/130
800
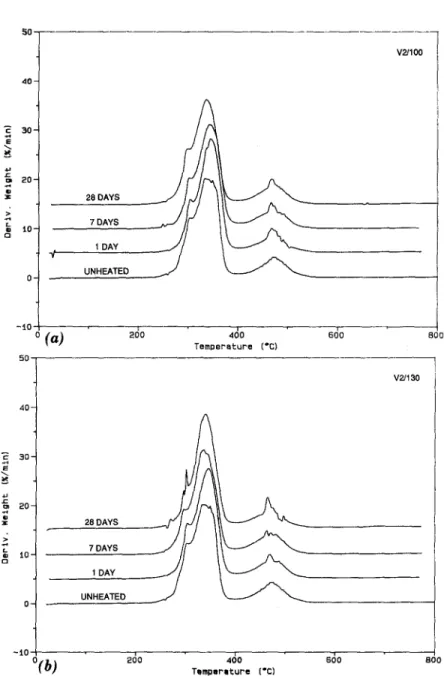
FIG. 5. Derivative TG (DTG) Curve for the V2 PVC Sample Heat Aged for 0 (Un- heated), 1, 7 and 28 Days at: (a) 100~ and (b) 130~
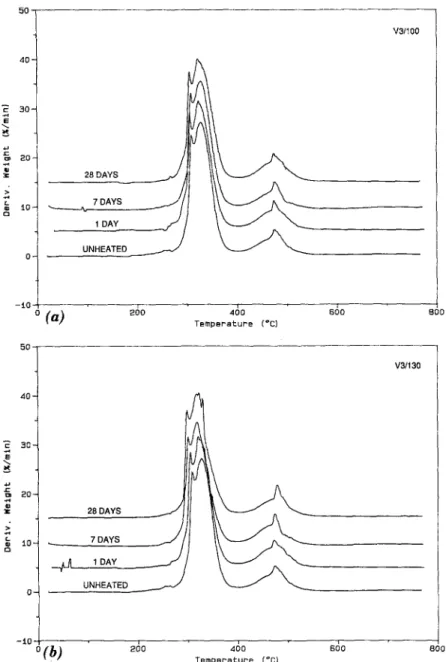
those for the V3 PVC are displayed in Fig. 6. The thermograms of the V3 sample show a similar trend to that observed in the V1 PVC samples, i.e., a slight decrease in the percent weight loss in the 200~176 region. No decrease is observed for the V2 samples in the same region. This may indicate that the V2 PVC has a greater thermal stability at 100 ~ and 130~ than the V1 PVC. Visual inspection of the V2 samples heated at 100~ showed neither sign of discoloration nor loss in initial flexibility, which
5 0 - 40- -~ 30- w 2 0 - m c iO- Q - i O / f l 7 DAYS S / / / I
I
DAY
_./'7
o (a) ~00T-
Temperature(~
V3/I
O0 5 0 - 8 0 0 4 0 ' 2G Q__r
g 28 DAYS-~~I
7
DAYSZL--J/
V3/130 - i O - o (b) 2~o 460 ~o Temperature(~
8 0 0FIG. 6. Derivative TG (DTG) Curve for V3 PVC Sample Heat Aged for 0 (Unheated), 1, 7 and 28 Days at: (a) 100~ and (b) 130~
indicates that heat-aging did not have a significant effect on the sample. However, the V2 PVC heated at 130~ showed some discoloration after seven days, and a major discoloration and loss of flexibility after 28 days. The V3 PVC showed slight decrease in flexibility and some visual discol- oration after seven days when heated at 100 ~ and 130~ thus indicating probable loss of HCI and/or plasticizer. Although all the PVC roofing sam-
ples are reinforced with some scrim, the thermal stability of samples V1 and V3 appears to be lower than that of the V2 PVC material. The lower thermal stability of the V1 and V3 materials may result from the type of stabilizer used and/or the compounding process. The thermogravimetric results in- dicate that the order of thermal stability of the PVC samples is V1 < V3 < V2.
Tensile Testing
The tensile strengths and elongation values for the three PVC specimens are listed in Table 4. As can be seen, there is no clear trend in the values for mechanical strength for any of the samples. In the case of percent elongation, a significant change is only observed after 28 days of heating at 100~ for samples V1 and V3; sample V2 does not exhibit any significant difference after being subjected to the same aging process. The V2 PVC was also quite stable at 130~ after one and seven days of heating. The sample did, however, change dramatically after 28 days of aging. The V1 and V3 samples show changes in their elongation values after seven days of heat treating at 130~
Although no substantial change was observed in the mechanical tests, the thermal analyses did record differences in the samples that were subjected to heat aging. Since the PVC samples are reinforced, it is possible that the mechanical data cannot reflect the changes incurred by the matrix material through heat aging. In this case, thermogravimetry and dynamic mechanical analysis can be used to record the behavior of the material, regardless of whether or not it is reinforced. This finding shows the importance of using both mechanical testing and chemical characterization in diagnosing roofing problems. Additionally, predictions of the behavior of the materials using TG and DMA are confirmed by field observations. Roofs made with V1 material developed more problems than those made with V3 roofing ma- terial. It was also found that roofs made from V2 material had the least amount of recorded problems.
CONCLUSIONS
Thermal analysis is a useful tool for the characterization of PVC roofing materials. Mechanical analysis was unable to clearly demonstrate that the material properties had been modified by heat aging. T G and DMA were able to not only record the changes incurred by the samples due to heat aging, but also to provide a ranking of the heat stability of the various materials. Furthermore, the order of stability V1 < V3 < V2 corresponded to the observed order of stability from actual records obtained on roofs.
Thermoanalytical techniques are important prognostic tools for predicting the behavior of single-ply roofing membranes. These techniques may also be used for developing new formulations of roofing materials.
ACKNOWLEDGMENTS
The writers wish to thank V. S. Ramachandran and N. P. Mailvaganam for their very useful comments, and D. Charron for her assistance in pre- paring this manuscript. This joint research project is funded by Canada Post Corporation, Department of National Defense, the Department of Public Works Canada, and the National Research Council of Canada.
APPENDIX. REFERENCES
Abbas, K. B., and Sorvik, E. M. (1975). "On the thermal degradation of poly(vinyl chloride)." J. Appl. Poly. Sci., 19, 2991-3006.
Dutt, 0., Paroli, R. M., Mailvaganam, N. P., and Turenne, R. G. (1991). "Glass
transitions in polymeric roofing membranes-determination by dynamic mechanical analysis. 3rd Int. Symp. on Roofing Technol., National Roofing and Contractors
Association, Rosemont, Ill., 495-501.
Feldman, D. (1989). Polymeric building materials. Elsevier Applied Science, New
York, N.Y.
Lattimer, R. P., and Kroenke, W. J. (1980). "Formation of volatile pyrolyzates from poly(vinyl chloride)." J. Appl. Poly. Sci., 25(1), 101-110.
Mardosky, S. L. (1964). Thermal degradation of organic polymers. John Wiley &
Sons, New York, N.Y.
Paroli, R. M., Dutt, O., Delgado, A. H., and Mech, M. N. (1991). "Characterization of ethylene-propylene-diene monomer (EDPM) roofing membranes using ther- mogravimetry and dynamic mechanical analysis." Thermochimica Acta, 182, 303-
317.
Stromberg, R. R., Straus, S., and Achhammer, B. G. (1959). "Thermal decom- position of poly(vinyl chloride)." J. Polymer Sci., 35, 355-368.
Titow, W. V. (1984). PVC Technology. 4th Ed., Elsevier Applied Science Publishers
Ltd., London, England.
Turi, E. A. (1981). Characterization of polymeric materials. Academic Press, New
York, N.Y.
Wypych, J. (1985). Polymer science library 3: Polyvinyl chloride degradation. Elsevier
Science Publishers, B. V., Amsterdam, The Netherlands.
Wypych, J. (1986). Polymer science library 4: Polyvinyl chloride stabilization. Elsevier