Publisher’s version / Version de l'éditeur:
Vous avez des questions? Nous pouvons vous aider. Pour communiquer directement avec un auteur, consultez la première page de la revue dans laquelle son article a été publié afin de trouver ses coordonnées. Si vous n’arrivez pas à les repérer, communiquez avec nous à [email protected].
Questions? Contact the NRC Publications Archive team at
[email protected]. If you wish to email the authors directly, please see the first page of the publication for their contact information.
https://publications-cnrc.canada.ca/fra/droits
L’accès à ce site Web et l’utilisation de son contenu sont assujettis aux conditions présentées dans le site LISEZ CES CONDITIONS ATTENTIVEMENT AVANT D’UTILISER CE SITE WEB.
Internal Report (National Research Council of Canada. Institute for Research in Construction), 1988-09
READ THESE TERMS AND CONDITIONS CAREFULLY BEFORE USING THIS WEBSITE. https://nrc-publications.canada.ca/eng/copyright
NRC Publications Archive Record / Notice des Archives des publications du CNRC :
https://nrc-publications.canada.ca/eng/view/object/?id=3f4b628b-27de-44f4-ad41-c1f16cab8d2a https://publications-cnrc.canada.ca/fra/voir/objet/?id=3f4b628b-27de-44f4-ad41-c1f16cab8d2a
NRC Publications Archive
Archives des publications du CNRC
For the publisher’s version, please access the DOI link below./ Pour consulter la version de l’éditeur, utilisez le lien DOI ci-dessous.
https://doi.org/10.4224/20358494
Access and use of this website and the material on it are subject to the Terms and Conditions set forth at
Indoor Air Quality Assessment in Building M-55
I
I Ref I
Ser
TH
1 biona~ Research Conseil national R427 Iuncil Canada de recherches CanadaI -- ~- ~
?
!'.
572'. hitutefor lnstitut de.~ ~. ~ -- ~ ~. Research in
recherche en
3onStruction construction
door Air Quality Assessment
in
Building M-55 (CISTI)
C.Y. Shaw, R.G. Evans, R.J. Magee, H.
Unligil
and C.J. ShirtliffeInternal Report
No.
572Date of issue: September 1988
ANALYZED
This is an internal report of the Institute for Research in Construction. Although not intended for general distribution, it may be cited as a reference in other publications.
EXECUTIVE SUMMARY
Building M-55 is a fully air-conditioned eight-storey
library/office building in which the first four floors are office floors and the remaining four house library stacks.
The floor area of the lower three floors is about 4800 mi
each and that of the upper five floors is about 2400 mZ
each. The building has a central core area housing two passenger elevators, two stairwells, washrooms, service shafts and a small sitting area. Except for the second and third floors, the floor space is fairly open with very few individual offices.
An investigation of the air quality in this building was
requested by the NRC Safety Officer. The main purpose of the
investigation was to determine whether there is a health hazard to M-55 staff or visitors, and if so, to provide
recommendations for correcting the problem. The events
leading to this request included ( 1 ) a formal complaint of
prolonged allergic reaction and decline in health by a staff
member working on the first floor, and ( 2 ) several verbal
complaints of headaches, eye irritations, and stuffy and uncomfortably dry air in the stacks area by the photocopying
staff on the fifth and sixth floors. Since 1981, two ad hoc
studies have been conducted to identlfy the causes of the complaints. As the results of these studies were
inconclusive, a thorough study was conducted to assess the air quality of this building.
The plan for the investigation consisted of ten tasks
including collection of background information, assessment of the performance of HVAC systems, identification and
measurement of indoor contaminants, and establishment of the basis for remedial measures. The investigation was begun in
March 1987 and completed in February 1988. The results are
summarized as follows:
1. Building
a. The building, including mechanical rooms, was relatively clean. The level of dirt and dust was low both in office and library stacks floors. Boxes, soiled carpets, used air filter materials and furniture stored in the basement could however, become sources of contaminant emissions.
b. Very few plant pollens or fungal spores were detected in
the indoor air or nn the floor, suggesting that thcy wcrc
effectively removed by the air filters in the HVAC
systems.
c. Air in some areas was too warm and too dry, especially in
d. No abnormally high concentrations of Carbon Monoxide (CO), Carbon Dioxide (COz ) , Nitrogen Oxides (NOX ) ,
Formaldehyde, suspended particulate matter and total colony forming units were detected in the office areas.
e. Total Volatile Organic Compound (TVOC) concentration was consistently high on the sixth floor. The TVOC
concentration for the library stacks floors was higher than that for the office floors.
2. HVAC systems
a. The total outdoor air supply rate was more than adequate: the average outdoor air supply rate per
person was greater than 18 L/s ( ASHRAE recommends 10
L/s per person. ) .
b. Air distribution within the building was good.
c. The outdoor air supply duct of some systems had too much fluid resistance. For example, the outdoor air
supply rate through System 8 was almost zero when
the outdoor air damper was set at 75% open position.
d. Air filters worked efficiently in filtering out particles, bacteria and fungal propagules.
e. Air prefilter fibers were treated (bonded) with a synthetic polymer resembling urea-formaldehyde foam.
f. Concentrations of microorganism were abnormally high immediately downstream of the water spray unit in most systems.
g. Biocide treatment for water spray units was
ineffective: Water reservoirs of most water spray units were heavily contaminated.
RECOMMENDATIONS
The following remedial measures are recommended:
Immediate Actions
1. Building
a. Check and adjust all thermostats and humidistats and install shades for the skylights.
b. Install separate exhaust air systems for copying machines.
c. Conduct house cleaning in the basement and repaint the floors in the mechanical rooms
d. Repeat formaldehyde measurements in Rooms 157 and ti14
in summer.
2. HVAC Systems
a. Clean and disinfect all water spray systems
b . Develop and apply a new preventive maintenance program.
c. Check all HVAC systems for unintentionally closed dampers.
d. Balance air flows of main supply and return air
fans for all systems (excluding System # 3 ) ; install an outdoor air supply fan, if necessary.
e. Check with the suppliers and ensure that air prefilters are not treated (bonded) with urea-formaldehyde foam; replace them, if necessary.
2. Future Actions
a. Replace existing water spray systems.
b. Increase the air flow rate of the cafeteria exhaust air system.
c. Install a CO2 controller to control the outdoor air
1.0 INTRODUCTION
The investigation was undertaken at the request of the NRC Safety Officer. The main objective was to conduct an
assessment of the air quality in Building M-55, where the Canada Institute for Scientific and Technical Information
(CISTI) is located. Specifically, we were asked to determine whether there is a health hazard to the staff or visitors, and if so, to suggest measures to correct the problem.
The request was prompted by occupant complaints of prolonged allergic reaction, decline in health, and air that is too stuffy and too dry. This investigation was conducted by the Building Performance Section, IRC and assisted by the Fire Research Section, IRC, the Plant Engineering Services and the Bureau of Chemical Hazards of the Health and Welfare Canada. To augment the investigation, an independent study was conducted by the Division of Biological Sciences, NRC to provide a qualitative analysis of the principal organisms in the air and water samples. The Biological Sciences' report has been distributed through the NRC Occupational Health and Safety Office. This report presents the results of the IRC study and the recommendations.
2.0 BACKGROUND
2.1 Building
Building M-55 is an eight-storey, air-conditioned and humidity-controlled library/office complex in which the
lower four floors are office floors and the upper four house library stacks. It was occupied on February 11, 1974 by
about 400 employees. The floor area of the lower three floors is about 4800 m2 each and that of the upper five
floors is about 2400 m2 each. The main entry floor has a
public work area with work table facilities for 100 persons
and a lounge/reading area seating 50 persons. Each library stack floor has six private study carrels and a
lounge/seating area in the centre core. The central core area also houses two passenger elevators, two stairwells, washrooms, a book elevator and service shafts. Except for the second and third floors, the floor space is fairly open with very few individual offices.
The building has nine air-conditioning systems (see Figure 1). Systems 1 and 2 are all-air two-deck systems that serve
the fourth to the seventh floors; System 3 is a 100% uutduor
air supply-only system serving the centre core area of the whole building. The outdoor air intake and exhaust air openings for these three systems are located in the north and south walls of the mechanical room directly above the
seventh floor. Systems 3, 4 and 8 serve the third floor,
ground, first and second floors. Two of the six systems for the lower four floors (Systems 6 and 9 ) are induction
systems and serve the perimeter wall area; the other four (Systems 4,5,7 and 8) are all-air two-deck systems and serve the interior area between the centre core and the perimeter wall. Outdoor air for the six systems comes from four
outdoor air intake shafts which are located outside the building, about 5 m above grade level, beside the north and south walls (see Figure 1).
The HVAC systems are operated from 5 am to 6 pm for Mondays and 6 am to 6 pm for other week days. On weekends and
holidays the systems operate only two hours from 1 pm to 3
pm. Except for System 3, the amount of outdoor air supplied
by each system is regulated automatically based on the outdoor air temperature. As well, each system has a water spray unit for humidity control.
2.2 Previous Investigations
The Institute for Research in Construction had conducted two previous investigations of this buildinglsz. The first one was conducted in 1981 as a result of employees' complaints of headaches and stuffy air. Measurements of Carbon
Monoxide, Carbon Dioxide, Ozone and suspended particulate concentrations were conducted between April 27 and May 6 on the ground, second and third floors. As the measured
concentrations were all within the limits recommended by the ASHRAE Ventilation Standard 62-19813, no causal agents could be identified and therefore, no remedial measures were
recommended.
In August 1986, the NRC Safety Officer asked IRC to conduct another investigation. The request was prompted by (1) a formal complaint of prolonged allergic reaction and decline in health from an employee working in the south and south- east area of the first floor in March 1986, (2) complaints from employees working in the photocopy areas on the fifth and sixth floors concerning headaches, eye irritations and
stuffy air, and (3) the growing recognition of indoor air
quality problems in buildings in general. As guidelines for indoor air quality assessment have been improved steadily since 1981, so too have the sampling techniques for
po1.lutant detection. Thus, in addition to the chemical
contaminants measurcd in the 1381 study, concentratiunv u p
total volatile organic compounds (TVOC) and fungal spores were measured. As well, dust samples, liquid samples and air samples were examined for prin~i~a1'component.s.
The most significant finding of the second study was that the TVOC concentrations in the complaint areas on the first and sixth floors exceeded values which one European
researcher found to cause complaints4. The main source of TVOC was identified to be the exhaust gas from the copying
machines using a liquid toner transfer process. Although high TVOC levels in some areas were identified as a possible cause for the occupant complaints, the investigation was not extensive enough to either identify or rule out other
possible causes.
A meeting of all interested parties was held in October 1987
to discuss the results. It was agreed that the NRC Safety
Officer should formally request IRC to conduct a thorough assessment of the indoor air quality of this building and recommend corrective measures, if needed.
2.3 Problem Identification
According to the American Conference of Governmental
Industrial Hygienists (ACGIH), building-related complaints can be classified into two groups: building-related illness and sick-building syndrome5, While both share many of the flu-like symptoms, building-related illness is defined as a clinically verifiable disease entity such as
hypersensitivity pneumonitis, humidifier fever, Pontiac fever, Legionnaire's disease, or allergic dermatitis5. The
symptoms of these diseases are given in Table 1 6 . Sick
building syndrome describes a constellation of mucous membrane irritation, headache, and fatigue which may be caused by a multitude of indoor air contaminants present at low levels, including tobacco smoke5. The most common
symptoms, as identified by the World health Organization,
include' (see also Table 1):
1. eye, nose, and throat irritation;
2. sensation of dry mucous members and skin;
3. erythema (redness of the skin caused by irritation);
4. mental fatigue;
5. headaches, high frequency of airway infections and cough';
6. hoarseness, wheezing, itching, and unspecific
hypersensitivity;
7. nausea and di~ziness.
Some researchers have also identified the following common characteristics for sick building syndrome based on their investigations8 . 9 :
1. The symptoms are nonspecific and often resemble those
experienced with a common cold or a respiratory ailment. 2. The severity of the complaint increases as the day
progresses. Complaints disappear when the individual is out of the building, i.e., evenings and weekends. Also, the complaint is not usually reflected in an increase in sickness absence.
3. The affected buildings are usually energy-efficient
buildings, which are fairly new in design and construction or have been recently returbished.
temperature, humidity, and lighting at their work location.
Sick building syndrome is diagnosed when complaints and symptoms are associated with occupancy of the building but no causal agent can be positively identified. Several causes have been postulated for the sick buildlng syndrome, but none of them have been convincingly implicated as the definitive c a ~ s e ~ ~ ~ ~ . The postulated causes include
inadequate ventilation, noise, lighting, formaldehyde and other volatile organic compounds, micro-organisms, excess of air-borne particles, work stress, and air that is too warm, too cold, too dry or too h ~ m i d g * ~ ~ ~ 1 1 ,
3.0 PROPOSED PLAN
As requested by the CISTI management, no occupant survey was conducted for this building. The nature of occupant
complaints could therefore be obtained only from the inter- office memorandums supplied by CISTI. The symptoms described by the employees, the failure to identify the causal agents in the two previous studies, and the lack of clinical
evidence of known building-related illness all suggest that the indoor environment of this building resembles that of sick building syndrome. The plan developed for assessing the indoor air quality, therefore, includes a thorough check of the heating, ventilating, and air-conditioning systemsiz. Other tasks include collection of background information, identification and measurement of indoor contaminants, and establishment of a basis for remedial measures. Details of the plan, measurement methods used, and a time schedule and costs for executing it are included in Appendix A.
4.0 RESULTS AND DISCUSSION
The results are discussed in terms of performance of HVAC systems, and levels of non-biological and biological
contaminants. The exposure limits used to interpret the
results are obtained from various standards, guidelines, and
published literature. Two guidelines are closely followed :
ANSI/ASHRAE Standard 62-1Y81R, "Ventilation for Acceptable
Indoor Air QualityWl3, and Health and Welfare Canada (HWC) Guideline, "Exposure Guidelines for Residentla1 Indoor Air Quality"14. The HWC Guideline is intended for residential
buildings where there can be 24 hr/day exposure and
therefore, the requirements may be more stringent than that for offzce environment.
4.1 Performance of HVAC Systems
The performance of a HVAC system is evaluated by ( 1 ) its
ability to supply an adequate amount of "clean" outdoor air for ventilation, ( 2 ) the ability to distribute the
ability to maintain air temperature, relative humidity and other parameters to create a thermally comfortable
environment for the bccupants.
Adequacy of Ventilation Air
One way to check the adequacy of a building's ventilation air is to ensure that its minimum air change rate meets the ventilation requirement recommended by prevailing standards such as ASHRAE 62-198113. As the air change rate includes the amount of outdoor air supplied by HVAC systems and air infiltration, the minimum air change rate occurs when the weather is warm and calm (to minimize air infiltration) and the outdoor air dampers are set at the minimum position.
The minimum air change rate of the building was measured
five times in May 1987 on calm days. Figure 2 shows the
measured tracer gas concentrations as a function of time for various sampling locations. It indicates that the air change rates (determined by the slope of the concentration decay curve) from various sampling locations were similar.
Concentrations in the occupied areas were also about the same, as were the concentrations in the return ducts. The tracer gas level was, however, lower in the floor space than that in the return ducts for most floors; suggesting that some short circuiting occurred between supply and return air flows, probably due to the presence of partitions and
library stacks.
The measured air change rates varied from 0.4 to 0.6 air changes per hour (ac/h), depending on the sampling locations and the weather conditions. 0'.4 ac/h is used in subsequent calculation as the minimum air change rate for the building.
The average amount of outdoor air received by each occupant was estimated based on the following assumptions: (1)
because almost all the occupants were located on the first four office floors and there were no common return air ducts connecting these floors and the library floors, the volume of the first four floors (67 000 m 3 ) was used; and (2) the number of occupants was assumed to be 400. The average amount of outdoor air received by each occupant was
According to ASHRAE Standard 62-1Y81R, for offices with no unusual indoor air contaminants, indoor air quality shall be considered acceptable if 10 L/s per person of "clean"
outdoor air is provided for the occupied space. Assuming that all the known air contaminant sources in this building will be eliminated or controlled after the remedial measures
overall outdoor air supply rate for the building should be more than adequate.
Air Distribution
To check air distribution, four tracer gas tests were
conducted in May 1987. In the first test, a small amount of
SF6 was injected at the supply duct of HVAC System Y to
create a point source, Immediately following injection, tracer gas samples were taken, at 10-minute intervals, at the main return ducts on each floor using an automated sampling system. In addition, every 10 minutes eight samples each were collected manually from the first and second floors and four samples each were collected from the third, fourth, fifth and sixth floors.
The tracer gas concentrations of each sampling location are
plotted against time in Figure 3. As shown, the tracer gas
dispersed quickly in the zones served by the same HVAC system and then spread to other zones on the floors connecting by common return ducts. Concentrations were
nearly equal in less than 2 h. There was very little tracer
gas getting into the library stacks floors. This suggests that if a contaminant source exists at the test location, the areas served by the same HVAC system will be
contaminated quickly and that other areas connecting by
common return ducts will also be affected i n l e s s than 2 h.
This suggests, again, that outdoor air will be distributed throughout the floor space in much less time because it enters every floor both through the exterior wall and the supply air registers. The test was repeated three times, each time with a new location as the contaminant source, and each time with similar results. The three additional
injection locations were the outdoor air supply duct of
System 8 , Room 157 and the library stacks area on the sixth
floor.
There are no guidelines or standards for office buildings. In general, when tracer gas is injected at an area with
known contaminant sources (e.g., a designated smoking room), the concentrations at surrounding areas should approach that of the injection location as slowly as possible, thereby indicating that the contaminated air is not exhausting to the surrounding rooms. On the other hand, for general offices, the tracer gas should disperse to other areas in the building as fast as possible to facilitate a uniform distribution of outdoor air. For this building, the tracer gas concentrations in the zones served by the same HVAC were
nearly equal in about half an hour. This is satisfactory,
based on our experience on houses with forced air heating systems.
Tracer gas was also used to determine whether exhaust air re-enters the building. This was done by injecting a small amount of tracer gas into an exhaust system and measuring the concentrations at the outdoor air intake of each HVAC system. All exhaust systems of the building were checked in November and December 1987. The amount of exhaust air re- entering the building was minimal.
Outdoor Air,and HVAC Systems and Others
Visual inspections revealed that the outdoor air supply ducts of some of the HVAC systems have too many bends. This is particularly true for the systems serving the office floors. The problem was first noticed during the
measurement of microbial contaminants in System 8. The
number of colony forming units in the return air and in the air immediately downstream of the outdoor air damper were almost identical; suggesting that no air was coming from the
outdoors. A follow-up inspection on the supply air duct of
System 8 revealed that the amount of outdoor air supplied
through this system was almost zero when the outdoor air damper was at 75% open position. The problem was probably caused by a combination of high fluid resistance in the supply air duct, an oversized return air damper and a
powerful return air fan. Other supply air systems were also checked. The condition of other systems was not nearly as bad as System 8.
As well, the air flow rates through some of the supply air registers of System 4 were very low. Visual inspection
indicated that this was caused by an unintentionally closed fire damper (The problem was corrected at that time).
Thermal Comfort
Thermal comfort16 at selected locations within CISTI was evaluated on the basis of measurements of room temperature
(dry bulb), mean radiant temperature, air velocity, and relative humidity. Spot checks at three elevations above floor level were conducted in Rooms 79, 157, 249, 260, 307, and 614 between January 29 and February 1, 1988. Conditions in Room 249 and 307 were found to be outside the comfort zone specified by ASHRAE for winter conditions.
Specifically, Room 249 was too warm and Room 307 which has a separate air-conditioning system was too dry. Air
velocities in Room 249 exceeded the recommended upper limit of 35 cm/s during tests conducted on January 29 and February 1.
A second series of thermal comfort evaluation in the
building involved 6-hour monitoring in Rooms 157, 243, 249, 260, 263B, 26YD, and 275 between January 5 and March 23, 1988. The objectives were (1) to examine the fluctuations in the four comfort parameters, (2) to determine their
average values during the office hours, and (3) to
characterize zone to zone variability in thermal environment of an office floor. The second floor was selected because of the prevalence of windows and skylights on this level. In these tests, measurements made at 75 cm above floor level were automatically recorded every 6 minutes over a 6-hour period. Figure 4 shows the results for Room 157, and gives the HWC guideline values for relative humidity and the value of air velocity recommended by ASHRAE. Radiant temperatures are given for readings taken horizontally at 180 degrees to each other. The results indicated that the measured radiant temperatures which ranged from 24.3 to 26.3 C were within the ASHRAE recommendation that radiant temperatures should not differ by more than 10 C in the horizontal direction. The results also indicated that the measured relative
humidity of 17 to 21% was well below HWC guidelines. This conclusion is also apparent when the data obtained at
approximately Y:30 am, 10:OU am, 19:00 noon, and 2:U0 pm are plotted on the ASHRAE comfort chart for winter conditions
(Figure 5).
Similar plots are given in Figure 6 for the second floor sampling locations. The results indicate that the
temperature in Room 249, 263B, and outside Room 26YD were higher, and the relative humidity in these areas were lower than that would normally be considered comfortable under winter conditions.
4.2 Chemical Contaminants and Particulate Matter
Non-biological contaminants monitored included Carbon Monoxide, Oxides of Nitrogen, Carbon Dioxide, Total Hydrocarbons or Total Volatile Organic Compounds, TVOC,
Formaldehyde and particulate matter (suspended and settled).
Some of these contaminants (e.g., CO, COz ) were selected
because they are Listed in various standards as typical
indoor air pollutants, and others (e.g., Total Hydrocarbons) were selected on the basis of the two previous studies.
Carbon Monoxide (CO)
Carbon Monoxide is produced in the combustion of carbonaceous materials and also in human metabolism.
Concentrations of CO were monitored for about three months starting August 1987 at one location outside the building near the roof level, at the return duct and near the centre of the occupied area (on each of the seven upper floors). On the ground floor measurements were taken at the return duct only. The measured concentrations in the building varied
from 1 to 7 ppm for weekdays, while the outside
concentrations ranged from 1 to 3 ppm. The i n s i d e and
outside concentrations were almost equal during weekends; suggesting that raised CO levels were likely due to human metabolism.
The acceptable short-term exposure ranges for CO in residential indoor air, according to Health and Welfare
Canada are up to 11 ppm (average concentration) for 8 hour
exposure, and up to 25 ppm for 1 hour exposure. The CO
concentration in this building is, therefore, within the HWC guidelines.
Oxides of Nitrogen (NO%)
Nitrogen Dioxide (NOz) is the only oxide of nitrogen which has been shown to be detrimental to human health at
concentrations that may be encountered in indoor airx4. The
primary outdoor sources of NOz are vehicular and industrial emissions. As the outdoor air intake for System 8 is
adjacent to the building's south-east shipping and receiving dock, it was felt that vehicular exhaust could enter the building by this route. NOz was continuously monitored
first at Room 157 (served by System 8) and then in the
outdoor air intake of System 8 for a month at each location.
The measured concentrations were less than 0.04 ppm which is within both the HWC short-term acceptable limit of 0.25 ppm
(one hour average concentration) and long-term acceptable limit of 0.05 ppm.
Carbon Dioxide ( COz )
Carbon Dioxide is produced by metabolic processes and by the combustion of fossil fuels1*. The average concentration of COz in the atmosphere is about 340 ppm, but levels vary widely with time and location. Similar to CO measurements, COz concentrations were measured at two locations on each of the seven upper floors (i.e., at the return duct and near the centre of the occupied area) and at one outdoor location near the roof level. On the ground floor, measurements were taken at the return ducts only.
Measurements of COz were conducted in January 1988 for a week with the HVAC systems operating in the automatic mode
(i.e., the outdoor air supply dampers were adjusted
automatically, based on the outdoor air temperature). The measured concentrations during office hours varied from 340 to 440 ppm and the air change rates ranged from 0.8 to 0.99 air changes per hour. The maximum concentrations reported in the two previous studies were 370 ppm (1981) and 480 ppm (1986) respectively.
According to HWC, the lowest concentration at which adverse health effects has been observed in human is 7000 p p m i 4 .
Although a maximum exposure level of 3500 ppm should provide a sufficient margin to protect against any adverse health effects, ASHRAE recommends 1000 ppm for office
buildings13~14. This level represents the steady state concentration produced by occupants in sedentary activity
with a ventilation rate (outdoor air) of 7.5 L/s per
occupant. This building meets both the ASHRAE and the HWC COz requirements.
Relation Between COz concentration and Air Change Rate In the absence of significant combustion sources, the
concentration of COz in indoor air depends on the occupancy load and is inversely related to the supply of outdoor air. As well, in the absence of significant indoor sources,
indoor levels of contaminants such as odours can be
controlled by increasing ventilation. Therefore, although at concentrations lower than 1000 ppm, COz is not a cause for occupant complaints, it may be used as an indicator of the combined effect of ventilation rate and indoor contaminants,
and hence, air quality1
.
To obtain the relationship between COz concentration and air change rate for this building, three additional COz tests were conducted. The first two consisted of a one-week measurement period and the third was a one-day test.
Concentrations of COz were measured at the same locations as in the previous test. For the first two tests, the air
change rate of the building was controlled manually by setting the outdoor air supply dampers of all HVAC systems at the 100% and 75% open positions respectively. The one- day long test was conducted with all the outdoor air supply dampers set at the minimum open position. The actual air change rates were measured regularly during each test period and the results were averaged to obtain the mean air change rate (the air change rates varied slightly from time to time because of weather changes).
During each test, 15 COz concentration profiles were
measured each day. Figure 7 shows typical daily COz
concentration profiles measured on the third and sixth floors, where the maxlmum and the minimum overall indoor concentrations were observed. The measured air change rate was 0.61 ac/h. Results indicate that the COz concentration measured in the occupied area (floor space) was generally lower than that measured in the return duct for the same floor level. The difference was more pronounced at the
office floor (third) than that at the library floor (sixth). The reason for this discrepancy has not been determined.
The daily COz concentration profiles in Figure 7 reflect the
presence or absence of occupants. The indoor COz level remained very near the outdoor levels from midnight until
about 7 : 3 U am when employees began to arrive for work.
Indoor levels then increased, reaching the first peak
concentration at 12 noon. The level subsequently decreased
slightly during the lunch period and then increased again to
pm. From then on the COz concentration decreased steadily,
reaching the outdoor level at about 1 2 midnight.
For weekdays, the daily maximum CO2 level always occurred at the return duct of the third floor. For each of the three week-long tests, the five-workday average of the daily maximum COz concentrations measured in the third floor return duct, Cmar, were calculated. Values of Cmax are plotted against corresponding average air change rates in
Figure 8. Also shown is an analytically derived relation
between the two variables for this building (see Appendix A
for details). The results show that Cmax decreased as the air change rate increased. The rate of decrease became much
lower when the air change rate was greater than 1 ac/h.
During the test where the air change rate was controlled to determine the relationship between CO2 concentration and air change rate, complaints about poor air quality increased
with the CO2 level. Occupant complaints about poor air
quality started when the CO2 concentration in the office
floors exceeded 4 5 0 ppm which corresponded to a measured air
change rate of about 1 ac/h, or 4 0 L/s per person on
average. When the COz level exceeded 5 2 0 ppm, the number of
complaints became unacceptable and the test was
discontinued. This suggests that the CO2 level for this building should be controlled at below 4 5 0 ppm to reduce occupant complaints.
Total Volatile Organic Compounds or Total Hydrocarbons
Total Hydrocarbons include all Volatile Organic Compounds
(TVOC). Volatile organic compounds refers collectively to a
large number of organic vapours which contaminate indoor
air. Over 3 0 0 volatile organic compounds have been
identified in indoor air at concentrations exceeding 1
ppbla. Volatile organic compounds are consistently found in higher concentrations indoors than outdoors and their
concentrations in a building are variable with time and location, suggesting the presence of significant indoor sources18. Such sources include building materials, consumer products, cleaning solvents, paints, adhesives, cosmetics, hot water, and indoor combustion sources.
According to ASHRAE, acute exposure to high levels of many volatile organic compounds is associated with irritation of the eyes and the upper respiratory tractla.
Concentrations of TVOC were measured indirectly from January
2 5 to 3 1 , 1 9 8 8 by continuously monitoring the concentrations of Total Hydrocarbons at three locations: the photocopying area of the sixth floor where the maximum concentration had
been detected previously, and the return ducts of Systems 2
and 8 which represent the average concentration of the
library stacks area and the office floors, respectively. The
68 mg/m3 for the 6th floor, 3 to 11 mg/m3 for the library
stacks area, and 1 to 2 mg/m3 for the office floors. The air
change rates during the measurement period ranged from 0.8 to 0.99 air changes per hour.
Figure Y shows typical daily TVOC concentration profiles
measured at the three locations. The measured air change rate was 0.8 air changes per hour. The daily TVOC
concentration profiles reflect the use of copying machines, as indicated by the results for the 6th floor where
photocopying is performed daily at about Y am and 2 pm. As shown, the TVOC level remained very near the background
level (about 3 mg/m3 for the library stacks area) from
midnight until about 7:30 am when employees began to arrive for work. It then increased, reachzng the first peak
concentration at Y:30 am at the end of the morning scheduled photocopying period. The level subsequently decreased
slightly between 10 am and 1:30 pm depending on the work load of the day. It then increased again to reach another peak at 2:30 pm at the end of the afternoon scheduled photocopying period. From then on the TVOC level varied with tlme but followed a downward trend, reaching the background level at about 6:30 pm. The TVOC generated on the 6th floor dispersed quickly to the upper four floors (which are served by the same HVAC systems), as indicated by a similar change in the TVOC level in the return duct of the library stacks area. The Level in the return duct for the office floors remained virtually unchanged, suggesting that little or no volatile organic compounds spread to the office floors from the sixth floor.
HWC has not yet set an acceptable exposure range for TVOC, simply because the health effects of VOC in complex mixtures over the range of concentrations encountered in buildings are not well understood. An internal HWC memorandum to the employees working in a building with VOC generated by
similar copying machines suggests that an average
concentration of about 5 mg/m3 is not considered to cause
significant health hazard. The 5 mg/m3 value was the average
concentration measured in the HWC building in question and is about 1/400 the occupational exposure limit proposed by the manufacturer.
Since more well defined exposure limits will not likely be established in the near future, efforts should be made to reduce the VOC levels in the building as much as possible or to eliminate the VOC sources. Figure 10 shows the relation between daily maximum VOC concentrations and air change rate for weekdays. The measurement was conducted during the same time and under the same conditions when a similar relation for CO2 was obtained. The result indicates that the VOC
concentration on the 6th floor decreased from 58 to about 44 mg/m3 as the air change rate increased from 0.9 (HVAC
maximum amount o f o u t d o o r a i r t h e HVAC s y s t e m s c o u l d
d e l i v e r . ) . T h i s s u g g e s t s t h a t t h e b e s t way t o r e d u c e t h e VOC l e v e l s i n t h e b u i l d i n g i s t o e l i m i n a t e t h e s o u r c e s .
Formaldehyde
Formaldehyde (IICHO) is a common contaminant of i n d w r air due Lo i t s use in a wide r a n g e of products (building materials, paper products, textiles, etcj, and due to i t s release from combustion sources (eg. smoking). The primary health effect due to acute exposure to HCHO is irritation of t h e eyes, ears, and throat. Although t h e epidemiological studies conducted to date provide little convincing evidence that formaldehyde is carcinogenic in human populations, the possibility cannot be excluded owing to limitations of t h e available data1? Five 5-day long t e s t s were conducted to measure formaldehyde
concentrations in CISTI using Dupont Pro-Tek C60 Dosimeters, between September, 1987 and February, 1988. A total of 41 locations within t h e building were tested, in addition to ambient samples taken on the roof. Results a r e summarized in Table 2 and Figure 11. The highest HCHO concentrations observed during this study were recorded during t h e f i r s t t e s t conducted in mid-September. Two dosimeters were placed in Room 157: one near t h e centre of t h e room and the other near t h e south window. The 5-day average levels were 0.042 ppm near t h e centre of the room and 0.027 ppm near the window. Similarly, two dosimeters were exposed on opposite sides of Room 614 during the f i r s t test. The measured 5-day average levels were 0.046 ppm above one of the six copying machines and 0.027 ppm near a r e t u r n a i r grille. Levels a t other locations in this building were lower than 0.027 ppm during this test. Also, none of the readings in t h e other four t e s t s exceeded 0.023 PPm.
Two possible sources exist for the high HCHO level recorded in Room 6 4 Paper used f o r photocopying may emit formaldehyde when heated during t h e copy process. Also, carbonless copy paper is used for photocopy request forms. Large quantities of free HCHO have been found in several brands of thi9 type of paper1=. When handled,
sensory irritation can result through t r a n s f e r of chemicals used in the copy process to fingertips and subsequently t o the eyes, etc. No apparent sources were identifiable in Room 157.
Ambient HCHO levels of 0.031 ppm were recorded during t h e first test. The highest outdoor concentration recorded during t h e remaining four
tests was 0.02 ppm. Typical outdoor levels of HCHO a r e in the range 0.01 to 0.02 ppm15. During t h e f i r s t test, metal flashing on the roof immediately adjacent to the dosimeter t e s t location was painted, a s were railings a t t h e f r o n t and r e a r entrances to the building. I t is possible that the primer o r paint used may have contained aldehydes that
affected t h e ambient levels.
Because of its potential to cause cancer in humans, Health and Welfare Canada in its guidelines for residential a i r quality t o do not s e t
"acceptable" levels for HCHO. Instead, they propose t h a t for any measurement of HCHO exceeding 0.10 ppm, action should be taken to
reduce the indoor concentration to below 0.05 ppm. These
concentrations a r e t h u s defined a s the "Action" and "Target" levels, respectively. The World Health Organization s e t s a "level of concern" for HCHO a t 0.10 ppm7. While none of t h e recorded values exceeded t h e
HWC Target level of 0.05 ppm, this level was closely approached in Rooms 157 and ti14 during t h e first t e s t series (Sept. 14-18, 1987). The concentration measured by the C60 dosimeter is a n averaged value f o r a
5 day sampling period and peak concentrations can exceed the 0.05 ppm guideline.
Suspended Particulates
The health effects of suspended particulates a r e dependent upon both their physical and chemical naturei5. Fibrous particles (eg. asbestos; man made mineral fibres, MMMF) a r e involved in t h e formation of lung cancer. Heavy metal particles (e.g., lead) can produce a variety of toxic effects in the body. Particulates can also act a s c a r r i e r s for toxic
substances ie.g., organic compounds, sulfates). Particle size determines penetration depth and rate of clearing from t h e respiratory system. Aerodynamic diameter (AD) is used to classify particles of various shapes ranging from perfect s h e r e s to long fibresi4.15. AD is defined
as t h e diameter of a unit density sphere with t h e same settling velocity a s t h e given particle regardless of actual particle size, shape and
density. Particles with AD exceeding approximately 15 urn a r e too large t o be inhaled. Those between 10 and 15 um a r e generally deposited in t h e nasopharyngeal region. The fraction below 10 urn (ie. t h e
"infallible" particulates, IP) a r e divided into "coarse" (approx. 3
-
10 um) and "fine" fractions (below 10 um). Respirable suspendedparticulates (RSP) a r e generally defined a s that fraction below
approximately 3.5 urn AD. I t is t h e RSP fraction t h a t actually penetrates the lungs. Only particles finer than approximately 2.5 um reach the lung alveoli.
Particulate monitoring was undertaken a) to characterize breathing zone levels a t complaint areas and in regions where particle-producing
activities were observed to occur, and b) to examine the building HVAC systems a s possible particle sources and to determine their impact on particle distribution within t h e building.
Similar to COz, sampling was conducted under four different HVAC system operation modes: 100% Fresh Air, 75% FA, 50% FA and Automatic Mode (variable % f r e s h air according to ventilation requirements). Automatic Mode sampling was conducted between August 27-September
18, 1987 and also between October 14 and 15, 1987. The sampling periods f o r 100%, 75% and 50% Fresh Air r u n s were September 28-
October 8, October 15-29, and October 30-November 1, 1987, respectively. Note that the 50% Fresh A i r r u n was discontinued on Monday November
2, 1987 due to occupant complaints caused by high indoor air temperatures.
Particle monitoring in o r d e r of sampling location is given in Table 3. Sampling dates and times, HVAC system identification and operation mode, and t e s t type (supply, r e t u r n , or room a i r ) a r e indicated. The total number of samples taken within the building was about 530015.
The average concentration of total suspended particles (TSP) during working hours in the complaint area (Rm. 157) was found t o be 1.26 ug/m3. The concentration of the respirable fraction was 0.91 ug/m3. Daytime particle levels in this area achieved maximum TSP concentrations of only 1.70 ug/m3 (RSP = 1.35 ug/m3).
The highest particle concentrations in the building were detected in Rooms 82, 87, 614, and 709. Maximum TSP values recorded during
working hours were 5.17, 28.9,'4.61, and 9-05 ug/m3, respectively (these values were well below HWC guidelines). Corresponding RSP values were 2.64, 13.0, 2.01, and 2.89. Local particle sources were apparent in t h r e e of the four locations. Room 82 is the Duplication Room and contains a
large photocopier. Paper cutting and document assembly operations a r e also conducted a t this location. Room 87 is the designated smoking area for t h e building. While spikes in particle levels a t this location were noted throughout periods in which t h e building was occupied, the
highest levels were always recorded between 2:00 and 2:15pm. Room 614 is the photocopy a r e a on t h e 6th Floor. Six photocopiers a r e located at
this location. Regular peaks in particle concentrations occurred a t 9:30am and 2:00pm, corresponding with peak periods of photocopier operation.
Room 709, in contrast to t h e other locations, 1s a s t u d y carrel in t h e 7th
Floor core area with no obvious particle sources. While t h e r e was a photocopier adjacent to this site, this was not operating a t t h e time t h a t the relatively high particle concentrations were detected. Sampling a t t h e supply a i r duct f o r this room indicated that t h e supply a i r was t h e source of the particulates. The ventilation system involved (HVAC #3), is different from all other systems in t h e bullding in t h a t it receives 100% f r e s h outside a i r at all times.
Transient spikes in particle concentration were noted in supply air streams on several occasions. A TSP value of 4.75 ug/m3 was recorded
at a 6th floor supply duct from HVAC System #1 during operation under 100% Fresh A i r conditions. Levels exceeding 10 ug/m3 were noted on two separate occasions during sampling a t a supply duct in Room 79. On one occasion, a level of 14.2 ug/m3 was recorded, on a separate day, TSP reached 22.2 ug/m3. RSP values for these samples were 7.43 and 8.99 ug/m3, respectively. The ventilation system involved (HVAC #5) receives r e t u r n air from two of t h e building locations with relatively high particle concentrations (Rooms 87 and 82), but on t h e dates for which t h e high supply air levels were recorded, the system was
operating under 100% Fresh A i r conditions. Average TSP values for t h e supply air at Room 79 were similarly high only during t h e 100% Fresh A i r run. Morning and afternoon average TSP values were 4.28 and 3.74 ug/m3, respectively.
The HWC guidelines specify acceptable long and short-term exposure ranges ("ALTER" and "ASTER", respectively). For fine particulate matter (defined as less than 2.5 um), ASTER and ALTER values of 100 and 40 ug/m3 were specified (ASTER: average exposure for l h ) . Due t o their potential t o cause cancer, no acceptable ranges were specified for
fibrous particulates. The recommendation was made instead to minimize inhalation and contact with mineral fibres.
Suspended particle concentrations within this building were generally well within t h e Health and Welfare Acceptable Long-Term Exposure Range ("ALTER") value of 40 ug/m3 f o r line suspended particulates. I n
general, the HVAC systems appear to provide adequate particle filtration. The ventilation of the smoking a r e a is such t h a t observed levels of total suspended particulates a r e well below those recorded a t similar locations in other commercial buildingslg. The cause of the a i r quality complaint in Room 157 does not appear to lie in the TSP levels in the area.
Measurements conducted in J u n e of 1986 i n t h e Client Services area of Room 157 indicated similarly low particle concentrations (mean RSP: 0.39 ug/m3). While activities in several locations in the building do generate suspended particulates, the levels recorded do not approach
recommended guidelines. 4 . 3 B i o l o g i c a l C o n t a m i n a n t s A l t h o u g h n o p o s i t i v e e v i d e n c e e x i s t e d f o r d i s e a s e s r e l a t e d t o b i o l o g i c a l c o n t a m i n a t i o n , s u c h a s h u m i d i f i e r f e v e r o r h y p e r s e n s i t i v i t y p n e u m o n i t i s ( s e e T a b l e l ) , b i o a e r o s o l s a m p l i n g w a s c o n d u c t e d b e c a u s e ( 1 ) t h e c o o l i n g t o w e r e x h a u s t a i r may c o n t a m i n a t e t h e o u t d o o r a i r s u p p l y u n d e r c e r t a i n wind c o n d i t i o n s , a n d ( 2 ) t h e r e w a s a t'ormal c o m p l a i n t o f p r o l o n g e d a l l e r g i c r e a c t i o n . The t e r m " b i o a e r o s o l " i s u s e d t o c o l l e c t i v e l y d e s c r i b e a i r b o r n e p a r t i c u l a t e m a t t e r o f m i c r o b i o l o g i c a l o r i g i n , e s p e c i a l l y t h a t f r o m v i r u s e s , b a c t e r i a , f u n g i a n d t h e i r s p o r e s , a n d p r o t o z o a n s l ' . B i o a e r o s o l s a r e u b i q u i t o u s i n i n d o o r a i r a n d g e n e r a l l y d o n o t l e a d t o i n f e c t i o n . They may, h o w e v e r , be a s s o c i a t e d w i t h r e a c t i o n s i n p o p u l a t i o n s o f s u s c e p t i b l e i n d i v i d u a l s . W h i l e I R C ' s i n v e s t i g a t i o n p r o v i d e d a q u a n t i t a t i v e a n a l y s i s o f t h e a i r a n d HVAC s y s t e m s a t M-55, l i t t l e a t t e m p t was made t o i d e n t i f y t h e i s o l a t e d o r g a n i s m s z o . To augment I R C ' s i n v e s t i g a t i o n , a d e t a i l e d q u a l i t a t i v e a n a l y s i s o f s e l e c t e d a i r a n d water s a m p l e s w a s c o n d u c t e d b y t h e B i o l o g i c a l S c i e n c e s o f N R C Z l . The r e s u l t s o f I R C ' s i n v e s t i g a t i o n a n d t h e c o n c l u s i o n o f t h e B i o l o g i c a l S c i e n c e s ' s t u d y w i l l be p r e s e n t e d b e l o w . A i r S a m p l e s The p r i m a r y o b j e c t i v e o f a i r s a m p l l n g f o r b i o l o g i c a l c o n t a m i n a n t s i s t o i d e n t i f y t h e s o u r c e o f a i r b o r n e m i c r o o r g a n i s m s s o t h a t e f f e c t i v e corrective a c t i o n may be u n d e r t a k e n . Between S e p t e m b e r 1987 t o March 1 9 8 8 , more t h a n 8 0 0 a i r s a m p l e s w e r e c o l l e c t e d b o t h i n s i d e a n d o u t s i d e t h e b u i l d i n g , a n d i n v a r i o u s c o m p a r t m e n t s o f t h e HVAC s y s t e m s ( F i g u r e 1 2 )
.
The m e a s u r e d c o n c e n t r a t i o n s o f b a c t e r i a a n d f u n g i i n t h e b u i l d i n g a r e shown i n F i g u r e 1 3 ( f u n g a l p r o p a g u l e s ) a n d
Figure 14 (total count including bacteria and fungi). The results show that the concentrations of microbial aerosols in the main occupied spaces were generally 200 colony
forming units per cubic meters (cfu/m3) or less. The outdoor
concentrations exceeded indoor levels in summer, while the two levels were about the same in winter. The concentrations in specific areas and in areas with potential sources were also measured. The highest values were 494 cfu/mJ
(dishwashing area, Room 216) and 434 cfu/m3 (Room 142, Janitor's closet).
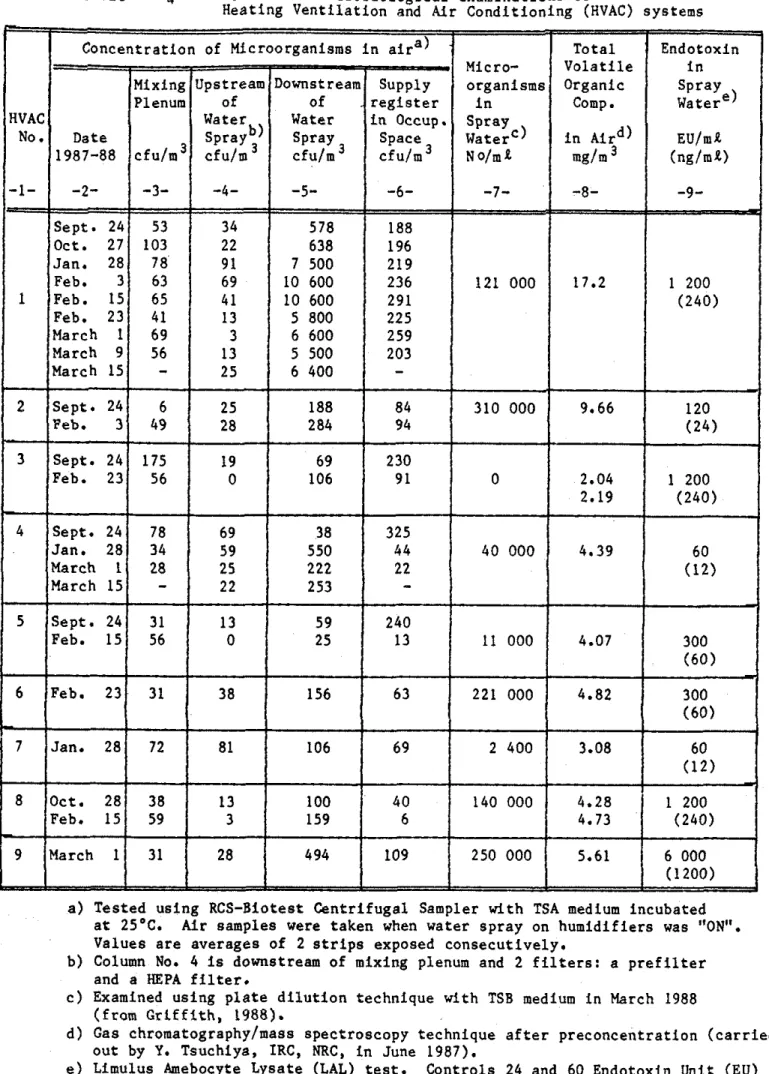
Measurements of cfu's inside the HVAC systems (Table 4) indicate that except for System 7, the cfu's increased by at least a factor of two immediately downstream of the water spray units (Figure 12). This suggests that the water spray units were the major contamination source. To verify this, air sampling was conducted in October 1987 on System 1 with and without the water spray unit in operation. Values of 600 and 10 cfu/m3 respectively, were recorded downstream of the
water spray unit (Figure 15). Immediately upstream of the
water spray unit, about 40 cfu/m3 was detected for both cases.
On January 28, measurements indicated that the concentration of microorganisms in System 1 downstream of the water spray unit increased to 1500 cfu/m3 from its normal value of about 600 (Table 4). To ensure that the concentrations in the
occupied area served by this system would not reach
unacceptable levels, sampling frequency was increased to
weekly intervals from February 3 to March 15 in System 1.
The value of cfu immediately downstream of the water spray unit were 10600 cfu/m3 in the first two weeks of February and then decreased to about 6000 cfu/m3 during the remaining measurement period. The concentration in the mixing plenum before the air filters was about ti6 cfu/m3 and it was about 35 cfu/m3 after the air filters but before the water spray unit. The concentration downstream of the supply air
registers in the occupied area was less than 291 cfu/m3. The outside concentrations were 41 and 44 cfu/m3 at the ground and roof levels, respectively. Visual observations of the microbial colonies revealed that the species composition of the indoor microbial air flora differed from that of the outdoors (species variety was more restricted and fungi formed a smaller percentage of the total than in the outdoors).
HWC guidelines state that "the variety of biological agents that may occur in air is immense, and their potential for effects on susceptible individuals is unpredictable, The complexity of the problem and the lack of data from which contamination levels can be related to diseases incidence mean that it is not possible to recommend limits for
biological agents in general.". On the other hand, ACGIH
levels routinely range from 1 0 0 0 to 1 0 0 0 0 0 cfu/m3 of air.
The indoor levels should be less than 1 / 3 of outdoor levels
where outdoor air is the only source, and should be
qualitatively similar.". Based on the two statements, it would be reasonable to conclude that the concentrations of
microbial aerosols in the main occupied areas (about 200
cfu/m3) are quite low. However, because the species
composition of indoor contaminants was not similar to the outdoors, effort should be made to remove the indoor sources (i.e., water spray systems).
The IRC results are quite similar to those of the Biological Sciences' studyZ1 as indicated by the conclusion of the
Biological Sciences' report quoted below.
"As far as the air quality is concerned, in the rooms tested, there appears to be no problem. The numbers of organisms counted are well below the suggested unofficial upper limit of 500-1000 cfu/m3 of air, and none of the organisms identified ring any alarm bells. The air inside is better than the outside air in terms of numbers and types of micro-organisms observed on the day of testing. This has been a recurring theme in the other tests carried out by
I R C . The one caveat is that populations of organisms are dynamic, and they can vary day to day, week to week etc.,
and it makes it very difficult to generalize. I am
confident in stating that as far as this current examination is concerned, there is nothing here to cause alarm, indeed, my feelings are that it is a very clean environment from a microbiological standpoint."
Water Samples
Eleven water samples from water reservoirs in HVAC spray water systems were analyzed by HWC for endotoxin
contamination levels. Endotoxin is a compound that is part of the cell wall of some bacteria. According to HWC, the inhalation of endotoxins in indoor air may induce an illness known as humidifier fever, The endotoxin concentrations in
HVAC systems 1 to 9 were 1 2 0 0 , 1 2 0 , 1 2 0 0 , 6 0 , 3 0 0 , 3 0 0 , 6 0 ,
1 2 0 0 , 6 0 0 0 EU/ml, respectively (Table 4). The
concentrations in the tap water samples on the ground and
7th floors were 24 and ti0 EU/ml respectively. The results.
suggest that the water reservoir of the water spray unit in
HVAC systems 1 , 3, 8 and 9 were contaminated with bacteria.
Again, there are no published standards of risk associated with exposure to endotoxin. Nor are there any procedures to estlmate the amount of endotoxin that may be released to the air from contaminated water in HVAC systems. Since water spray units in HVAC systems were once more identified as the contamination source, a thorough treatment of such would likely eliminate the problem.
The results are also in genepal agreement with those of the Biological Sciences' study. Again, the conclusion of the Biological Sciences' report is quoted below to support the IRC findings.
"The HVAC water spray sumps are a different story. They are a mess. The numbers of organisms isolated from all but HVAC
System 3 exceed the maximum recommended limit by two orders
of magnitude. The suggested upper limit is no more than l o 3
cfu/ml of water, and most of the HVAC's are in the 105
cfu/ml of water range.
There is no doubt that the source of the organisms found downstream of the water spray originate in the sump water. The populations of organisms isolated downstream correlate
100% with the populations found in any given sump. While
very few of these organisms are finding their way into the
rooms at M-55, cleaning up the sumps will guarantee even
better air quality downstream.
Why System 1 has the highest counts downstream of the spray
when HVAC 1 sump water is not the most contaminated is a bit
of a mystery, but it could be that the coils, or vanes of the cooling unit adjacent to the spray are more heavily contaminated in System 1 than in the other HVAC systems."
Dust Samples
Sixty settled dust samples were collected inside the
building and were examined by light microscope for biogenic air contaminants (including allergens such as plant
pollens). The results indicated that very little dust was accumulated on surfaces within occupied areas. The most
common component was wood pulp likely originating from books and papers. Other components found in the samples were
paint particles (mainly on ground floor), starch, cotton, wool, polyester, rayon, human hairs, and dandruff (mainly in
washroom). A small number of particles which resembled in
their morphology urea formaldehyde particles were detected. These probably originated from air prefilters. More
importantly, no glass and mineral fibers, large biogenic particles of outdoor origin (e.g., moth scales, plant
pollens, fungal spores and hyphal fragments, bird fibers and plant fragments other than pulp) were detected.
Examination of solid samples obtained from air prefilters indicated that they were treated (bonded) with a synthetic polymer resembling urea-formaldehyde foam. Dust accumulated on pre-air filters contained large particles such as
pollens, those on HEPA filters contained mainly small particles.
The results could be summarized as follows:
5.1 Building
a. The building, including mechanical rooms, was relatively clean. The level of dirt and dust was low both in offlce and library stacks floors. Boxes, soiled carpets, used air filter materials and furniture stored in the basement could however, become sources of contaminant emissions.
b. Very few plant pollens or fungal spores were detected in
the indoor air or on the floor, suggesting that they were effectively removed by the air filters in the HVAC
systems.
c. Air in some areas was too warm and too dry, especially in the afternoon.
d. No abnormally high concentrations of Carbon Monoxide
( G O ) , Carbon Dioxide (COz ) , Nitrogen Oxides INOX ) , Formaldehyde, suspended particulate matter and total colony forming units were detected in the office areas.
e. Total Volatile Organic Compound (TVOC) concentration was consistently high on the sixth floor. The TVOC
concentration for the library stacks floors was higher than that for the office floors.
5.2 HVAC systems
a. The total outdoor air supply rate was more than adequate: the average outdoor air supply rate per
person was greater than 18 L/s ( ASHRAE recommends 10
L/s per person. )
.
b. Air distribution within the building was good.
c. The outdoor air supply duct of some systems had too much fluid resistance. For example, the outdoor air
supply rate through System 8 was almost zero when
the outdoor air damper was set at 75% open position.
d. Air filters worked efficiently in filtering out particles, bacteria and fungal propagules.
e. Air prefilter fibers were treated (bonded) with a synthetic polymer resembling urea-formaldehyde foam.
f. Concentrations of microorganism were abnormally high immediately downstream of the water spray unit in most systems.
ineffective: Water reservoirs of most water spray units were heavily contaminated.
6.0 RECOMMENDATIONS
The following remedial measures are recommended:
6.1 Immediate Actions
1. Building
a. Check and adjust all thermostats and humidistats and install shades for the skylights.
Measurements indicated that at times the thermal conditions in some areas (e.g., Rooms 157, 249, 260, 263B, 2ti9D and 307) were outside the ASHRAE's comfort zone. This could be caused by the fact that the main chiller was out of order during the winter of 1987. It could also be caused by inappropriate thermostat and humidistat settings. In addition, shades should be install for all skylights to reduce solar gains.
b. Install separate exhaust air systems for copying machines.
Measurements indicated that the high VOC concentration on the 6th floor was produced by the exhaust gas of the copying machines. As the measurements indicated that VOC levels
could not be effectively reduced by increasing general
ventilation, source removal approaches should be used. It is therefore, suggested that the exhaust gas of all copying machines be discharged directly to a separate exhaust system. Systems 31A to 34A may be used for this purpose.
c. Conduct house cleaning and repaint the floors in the
mechanical rooms
The paint on the floor was peeling off. Thus, the floor in the mechanical rooms should be scraped, etched and
repainted. Also, remove boxes, soiled carpets, used air filter materials and furniture in the basement.
d. Repeat formaldehyde measurements in Rooms 157 and ti14 in summer.
The concentration of formaldehyde in Rooms 157 and ti14 under winter conditions was very close to the HWC's target value of 0.05 ppm. The high level could have been caused by gas emission of fresh paint which was applied outside the building when the formaldehyde measurement was conducted. Thus, measurements chould be rcpcated in thcsc two rooms to ensure that the concentrations meet HWC guidelines under summer conditions.
2. HVAC Systems
a. Clean and disinfect all water spray systems.
The water spray unit in all systems was identified as the major source of biological contamination. The water
reservoir of t.hnse units should be drained and the coils and water eliminators should be scraped and steam cleaned. HVAC systems should not be operated during cleaning period. They should be operated with the outdoor air dampers fully open
for 3 or 4 hours immediately after cleaning.
b. Develop and apply a new preventive maintenance program.
The maintenance program should include maintenance of slime- free surfaces by frequently draining water reservoirs and steam cleaning components, and apply hypochlorite (available
1000 ppm) treatment during cleaning only. The use of biocides in the treatment of water reservoirs is not
recommended, since biocides are carried with the air stream into occupied space with the possible result of toxic and allergic effects on occupants.
c. Check all HVAC systems for unintentionally closed dampers.
d. Balance air flows of main supply and return air
fans for all systems (excluding System # 3 ) ; install an
outdoor air supply fan, if necessary.
It was found that the outdoor air supply rate of System 8
was almost zero when the outdoor air damper was set at 75% open position. This could be caused by a outdoor supply air duct having abnormally high fluid resistance, an oversized return air damper and a powerful return air fan. All outdoor
air supply ducts except for that of System 3 should be
examined, to ensure that similar incidents will not occur. e. Check with the suppliers and ensure that air prefilters are not treated (bonded) with urea-formaldehyde resin; replace them, if necessary.
6.2 Future Actions
a. Replace existing water spray systems
b. Increase the air flow rate of the cafeteria exhaust
air system.
This will prevent cooking odour from spread to other areas. c. Install a C02 controller to regulate the outdoor air
As the level of occupant complaints increased with COz
concentrations, COz can be used as an index for air quality. A COz controller is, therefore, recommended to be used to control the outdoor air supply rate for the office floors. The sensor should be located in the return duct of System 8 and set at 450 ppm.
7.0 REFERENCES
1 Tamura, G.T., 1981. Letter Report, Results of
Measurements of Air Contaminants in the CISTI Building, Division of Building Research, NRC.
2 Walkinshaw, D.S., 1986. Report, Indoor Air Quality in
M-55 (CISTI Building), Institute for Research in Construction, NRC.
3 ASHRAE., 1981. ASHRAE Standard 62-1981, Ventilation
for Acceptable Indoor Air Quality, The American Society of Heating, Refrigerating, and Air-Conditioning Engineers, Inc.
4 Molhave, L., Bach, B. and Pedersen, 0. F., 1986. Human
Reactions to Low Concentrations of Volatile Organic
Compounds, Environment International, V. 18, pp. 167-175.
5 ACGIH, 1987. Guidelines for Assessment and Sampling of
Saprophytic Bioaerosols in the Indoor Environment,
Bioaerosols Committee, ACGIH, Applied Industrial Hygiene.
6 Benard, J.M. 1986. Building-Associated Illnesses in an
Office Environment, Proceedings of the ASHRAE Conference IAQ'86, Managing Indoor Air for Health and Energy
Conservation, ASHRAE.
7 World Health Organization (WHO), 1983. Indoor Air
Pollutants: Exposure and Health Effects Assessment, Working Group Report, Nordlingen, Euro Reports and Studies No.78, Denmark.
8 McDonald, B., 1984. Investigation of Employee
Complaints at Les Terrasses de la Chaudiere, Treasury Board Contract TB/CT-Req B8059, McGill University, Montreal.
9 Finnegan, M.J., Pickering, C.A.C. and Burge, P.S.,
1984. The Sick Building Syndrome: Prevalence Studies, British Medical Journal, vol.289, December.
10 Hodgson, M.J. and Kreiss, K., 1986, Building-
Associated Diseases: An Update, Proceedings of the ASHRAE Conference, IAQ '86, Managing Indoor Air for Health and Energy Conservation, ASHRAE, Georgia, U.S.A.