Publisher’s version / Version de l'éditeur:
ASHRAE Transactions, 108, Pt. 2, pp. 868-874, 2002
READ THESE TERMS AND CONDITIONS CAREFULLY BEFORE USING THIS WEBSITE. https://nrc-publications.canada.ca/eng/copyright
Vous avez des questions? Nous pouvons vous aider. Pour communiquer directement avec un auteur, consultez la première page de la revue dans laquelle son article a été publié afin de trouver ses coordonnées. Si vous n’arrivez pas à les repérer, communiquez avec nous à [email protected].
Questions? Contact the NRC Publications Archive team at
[email protected]. If you wish to email the authors directly, please see the first page of the publication for their contact information.
NRC Publications Archive
Archives des publications du CNRC
This publication could be one of several versions: author’s original, accepted manuscript or the publisher’s version. / La version de cette publication peut être l’une des suivantes : la version prépublication de l’auteur, la version acceptée du manuscrit ou la version de l’éditeur.
Access and use of this website and the material on it are subject to the Terms and Conditions set forth at
Experimental study and zone modelling of smoke movement in a model
atrium
Hadjisophocleous, G. V.; Fu, Z.; Lougheed, G. D.
https://publications-cnrc.canada.ca/fra/droits
L’accès à ce site Web et l’utilisation de son contenu sont assujettis aux conditions présentées dans le site
LISEZ CES CONDITIONS ATTENTIVEMENT AVANT D’UTILISER CE SITE WEB.
NRC Publications Record / Notice d'Archives des publications de CNRC:
https://nrc-publications.canada.ca/eng/view/object/?id=cc9cf499-be60-4bde-8386-1d32776ce6b6 https://publications-cnrc.canada.ca/fra/voir/objet/?id=cc9cf499-be60-4bde-8386-1d32776ce6b6Experimental study and zone modeling of smoke
movement in a model atrium
Hadjisophocleous, G.; Fu, Z.; Lougheed, G.
NRCC-46404
A version of this document is published in / Une version de ce document se trouve dans :
ASHRAE Transactions, v. 108, pt. 2, 2002, pp. 868-874
© 2002, American Society of Heating, Refrigerating and Air-Conditioning Engineers, Inc. (www.ashrae.org). Reprinted by permission from ASHRAE Transactions 2002, Volume 108, Part 2. This paper may not be copied nor distributed in either paper or digital form without ASHRAE's permission.
ASHRAE Transactions: Symposia 865
ABSTRACT
A series of atrium model tests were conducted to investi-gate the effectiveness of the smoke exhaust system in an atrium. The dimensions of the test compartment were 9 m × 6 m × 5.5 m height. The heat release rate ranged from 15 kW to 600 kW. The measured exhaust rate ranged from 1.94 to 5.13 kg/s.
In this study, the experimental interface height between the smoke and cold layer is defined as the position with the maximum temperature or concentration gradient. Three sets of data, including the reduced interface height, smoke layer temperature, and CO2 concentration, are presented in this
paper. The effects of some parameters on smoke conditions are analyzed.
A two-zone smoke movement model is used to predict the interface height, smoke layer temperature, and CO2 concen-tration. This model is briefly described in this paper with the focus on the fluid flow model. It is shown that the model predic-tion compares favorably with experimental results, especially with smoke layer temperature. In addition, the effect of two plume models developed by McCaffrey and Heskestad on the interface height is investigated.
INTRODUCTION
An atrium within a building is a large undivided space, designed to create visual and spatial appeal. When a fire occurs in an atrium or an adjacent space, smoke can fill the atrium and the connected floors and endanger the lives of building occupants. Fire risks of an atrium building are differ-ent from those of traditional buildings, and smoke manage-ment in an atrium is very important (Chow and Lau 1995; Lougheed and Hadjisophoclous 1997).
Smoke management systems are used to limit smoke spread from the atrium space to the connected area and escape routes. They achieve this by confining spread of smoke to a limited region, limiting toxic gas concentration, maintaining the clear height at a certain level for a definite time, and limit-ing the smoke layer temperature (Chow and Lau 1995; Milke 1990).Thus, the prediction of the hazard parameters, includ-ing smoke layer depth, toxic species concentration, and temperature rise in the smoke layer is important in designing an effective smoke management system (Milke and Mowrer 1994).
There are three numerical tools for designing smoke management systems: algebraic equations, computer-based comprehensive zone models, and computational fluid dynamic (CFD) models. A first-order analysis can be conducted using algebraic equations such as those provided by Klote and Milke (1992), Cooper (1995), and Tanaka and Yamada (1985). These equations use the zone model concept. In order to get these algebraic equations, many other assump-tions are required, such as using a constant heat loss factor, neglecting environmental effects, assuming constant density to separately solve the mass and energy conservation equa-tions, and assuming power law heat release rate. A major drawback of these equations is the inability to dynamically simulate the interaction of different smoke management systems (Milke and Mowrer 1994).
The other two types of analytical approaches are computer-based zone modeling and CFD modeling. Due to the fewer simplifications and assumptions made in these models, computer-based approaches increase the accuracy and flexibility of the models. In CFD models, a compartment is divided into a number of small cells, over which the basic
Experimental Study and Zone Modeling of
Smoke Movement in a Model Atrium
George Hadjisophocleous, Ph.D., P.Eng.
Zhuman Fu, Ph.D.
Gary Lougheed, Ph.D.
Member ASHRAE Member ASHRAE
George Hadjisophocleous is a professor and Zhuman Fu is a post-doctoral fellow in the Department of Civil and Environmental Engineering, Carleton University, Ottawa, Ontario. Gary Lougheed is a senior research officer at the National Research Council Canada, Ottawa, Ontario.
HI-02-10-3 (RP-899)
mass, momentum, and energy conservation are assumed. Thus, they can provide more detailed information on the hazard parameters in simulating smoke movement. However, until now, they have not been widely applied to practical cases because of their high computation cost and their difficulties in modeling turbulent combustion and coupling thermal fields to solid phase pyrolysis (Cox 1994).
Current comprehensive two-zone modeling may be considered a compromise between the CFD models and alge-braic equations. In two-zone models, the gas in each compart-ment is assumed to be composed of two layers: a relatively hot upper smoke layer and a relatively cool noncontaminated lower air layer. Within each zone, the properties are assumed to be uniform. The basic mass and energy conservation is applied to each layer. The source terms of the basic conserva-tion equaconserva-tions (i.e., mass and energy exchange rates between neighboring zones) are obtained by modeling relevant fire processes, such as plume entrainment, vent flow, and heat transfer. A comprehensive computer-based two-zone model can eliminate the assumptions used in algebraic equations mentioned above except the two-zone assumption. It can dynamically predict most of the required parameters used in engineering design, such as smoke layer temperature, wall surface temperature, smoke layer thickness, and toxic species concentration in each compartment at any time. Details on current zone models can be found in the literature (Fu and Hadjisophocleous 2000; Fu and Fan 1996; Jones and Forney 1993; Friedman 1992).
The two-zone model was developed for calculating smoke movement in buildings. To determine whether the model is capable of predicting the condition in an atrium with a smoke exhaust system, the model was used to simulate tests. These experiments were conducted to investigate the effec-tiveness of a smoke management system in an atrium (RP-899). Three sets of data are presented in this paper.
DESCRIPTION OF THE EXPERIMENTS
A detailed description of the experiment is provided in Lougheed and Hadjisophocleous (1997). In this paper, only the part related to the two-zone model is presented.
Test Facility
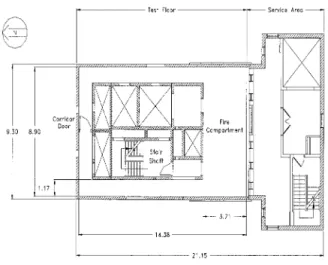
A sketch of the experimental facility is shown in Figure 1. The facility was a large compartment with dimensions of 9 m × 6 m × 5.5 m height. The interior wall surface of the compart-ment was insulated using 25 mm thick rock fiber insulation.
A fan was used to supply fresh air into the compartment through openings in the floor around the walls. These open-ings had a width of 0.1 m and a total length of 22.8 m. The inlet air was supplied to the four sides of the room through a duct system in the under-floor space.
Thirty-two exhaust inlets with a diameter of 150 mm were located in the ceiling of the compartment. These inlets were used to extract the hot gases from the compartment during the tests. All exhaust ducts were connected to a central plenum. A
0.6 m diameter duct was used between the plenum and an exhaust fan. The exhaust system included a two-speed fan with nominal capacities of 3 and 4 m3/s. The actual volumetric flow rate in the main duct was continuously measured during a test. A square propane sand burner was used as the fire source. The burner was capable of simulating fires ranging from 15 kW to 1,000 kW. The heat release rate of the fire was determined using two methods. One was based on the volume flow rate of propane supplied to the burner. The other was based on the oxygen depletion method.
Instrumentation
Twelve CO2 inlets and fifteen thermocouples were
located at one of the room quarter points at various heights. The temperature measurements, together with the CO2
measurements, were used to determine the depth of the hot layer in the compartment.
The volume flow rate, temperature, CO2,and oxygen
concentrations were measured in the main exhaust duct. These measurements were used to determine the heat release rate of the fire, as well as to calculate the exhaust rate of the ventila-tion system. A pitot tube and thermocouple, located at the center of the duct, were used to determine the volumetric flow rate in the duct.
DESCRIPTION OF THE TWO-ZONE MODEL
A two-zone smoke movement model has been developed. The default independent variables of each compartment are pressure, smoke layer enthalpy, smoke layer mass, and lower layer mass, respectively. Various fire submodels have been implemented in this model, which are briefly described below. More details of the model can be found in the paper by Fu and Hadjisophocleous (2000).
ASHRAE Transactions: Symposia 867
Combustion and Chemistry
Combustion is calculated based on the fuel and oxygen mass in the fire plume. It is assumed that if the fuel to oxygen ratio in the fire plume is less than the stoichiometric ratio, then combustion behaves as in open air. If not, combustion will be constrained by the available oxygen based on the oxygen consumption principle. A specification chemistry model is implemented. The mass ratios of C, H, and O with respect to fuel are specified as input data. The mass ratios of CO and SOOT with respect to the mass of carbon-related products (CO2+CO+SOOT) and the mass ratio of any toxic with respect to the fuel are also specified.
Heat Transfer
To calculate conductive heat transfer through the compartment boundaries, a one-dimensional transient conduction model is used.
In a fire room, convective heat loss at the ceiling surface and the upper wall due to a ceiling jet can be calculated using the correlation given by Cooper (1982) and Motevalli and Ricciuti (1992). In this model, the ceiling surface is converted into an equivalent circular surface with the same area, and the plume impingement point is assumed to be at the center of the surface. Convective heat transfer for other surfaces in the fire room or nonfire rooms is considered to be natural convection, and empirical equations for turbulent convective heat transfer are used.
For radiation, a two-surface model is applied. The flame is assumed to be a sphere with its center located at the position of half flame height above the fuel bed, and the radiation flux of the sphere to any direction is assumed to be uniform. The smoke layer is considered to be an absorptive medium, and the lower layer is considered to be transparent.
Fluid Flow Model
Plume Entrainment. In this zone model, two plume
models are implemented. One is McCaffrey’s model (McCaf-frey 1983) and the other is Heskestad’s model with constant coefficients and ignoring virtual origin correction (Heskestad 1995).
McCaffrey’s entrainment model is given in Equation 1:
(1)
where
QC = convective heat release rate,
= mass entrainment rate,
Ze = plume entrainment height,
Ce1 and C e2 = constant coefficients (McCaffrey 1983).
Heskestad’s model is in the form of and (Heskestad 1995):
(2)
(3)
Mechanical Ventilation. A mechanical ventilation
model is implemented. The schematic of the mechanical ventilation opening is shown in Figure 1. Through the open-ing, smoke can be extracted or air can be supplied. Two param-eters can be specified: the vertical extension of the opening and the volume or mass flow rate.
In the case shown in Figure 1, initially the smoke interface is above the opening elevation, and the exhausted gas is lower layer air only. If the plume entrainment rate at the elevation of the exhaust opening is greater than the exhaust rate, then the interface will be formed under the opening, and after that time, the exhausted gas will be smoke only. If the plume entrainment rate at the elevation of the exhaust opening is less than the exhaust rate, and the smoke exhaust system is assumed to be ideally effective, then the interface will be formed at the open-ing elevation, and the exhausted gas is assumed to be composed of two parts—smoke and lower layer gas. For this case, the following formulation has been used in the model to identify how much gas is extracted from each zone.
For mass flow rate specification:
(4)
(5) For volume flow rate specification:
(6)
(7) where is the maximum smoke exhaust rate from the upper layer; and are mass flow rate exhausted from upper layer and lower layer, respectively; is the speci-fied mass exhaust rate of the exhaust fan; and are volume flow rate exhausted from upper layer and lower layer, respectively; is the specified volume exhaust rate of the exhaust fan; and ρU is the density of the smoke layer.
The above method of limiting the maximum smoke exhaust rate is also very helpful to maintain numerical stability and efficiency when the exhausted gas is composed of two parts—smoke and lower layer. Sometimes is difficult to calculate. For the situation shown in Figure 1, is the plume entrainment rate at the elevation of the opening. For this case, if necessary, can also be set as the plume entrain-ment rate at the elevation a small distance below the opening to keep the predicted smoke interface below the opening.
m·e QC --- Ce 1 Ze QC0.4 --- Ce 2 = m·e m·e⁄QC Ze⁄QC0.4 If Ze QC0.4 ---≤0.166, m·e QC --- 0.034 Ze QC0.4 --- . = If Ze QC0.4 --->0.166, m·e QC --- 0.071 Ze QC0.4 --- 5 3 ---0.0018 . + =
m·MU = min m·( Fan, m·max) m·ML = m·F an–m·MU V·MU min V·fan, m·max ρU --- = V·ML = V·Fan–V·MU m·max m·MU m·ML m·Fan V·MU VML · V·Fan m·max m·max m·max
RESULTS AND COMPARISONS
The basic input data used in the model are listed in Tables 1 through 4. It includes fuel properties, thermal properties of the compartment boundaries, the compartment dimensions, and other basic settings.
In total, 40 tests were conducted, from which three sets of test data are presented in this paper for analysis and compar-ison with the model results.
The input data of the exhaust rates and the heat release rates for the three tests are shown in Tables 5 through 10. Some points should be noted. Heat release rates and exhaust rates in the tables are obtained from the experimental data. As shown in Tables 5 through 10, the heat release rates and exhaust rates are taken as input data of the zone model together with the data of Tables 1 through 4. The data of heat release rates and exhaust rates are both time-dependent and piece-wise linear.
The experimental interface height is obtained from both the temperature and CO2 concentration profiles along the
vertical axis from the ceiling to the lower layer. It is defined as the midpoint height between two neighboring thermocouples or CO2 ports, where the measured temperature or
concentra-tion variaconcentra-tion was the largest.
The experimental results, shown in Figures 2 through 10, are the interface heights, hot layer temperatures, and hot layer CO2 concentrations. In addition, the predicted results using McCaffrey’s and Heskestad’s plume models are both presented in Figures 2 to 10.
TABLE 1
Fuel Properties of the Tests
Fuel
Heat of Combustion (MJ/kg)
Radiation Fraction
(Motevalli and Ricciuti 1992) H/F C/F Soot, CO/CRP
C3H8 44 0.27 0.18 0.82 0
TABLE 2
Thermal Properties of the Compartment Boundaries
Ceiling Wall Floor
Thickness (m)0.025 0.025 0.025 Density (kg m-3) 130 130 130 Conductivity (W m-1K-1) 0.08 0.08 0.08 Specific heat (J kg-1K-1) 900 900 900 Surface Emissivity 0.9 0.9 0.9 TABLE 4
Some Basic Settings of the Tests
Test No. Fire Size (kW) No. of Inlets Extension (m) Exhaust Initial Temp. (°C)
1 150-250-600 32 0 High 24
2 25-150-250-600 32 1 High 26
3 25-150-250-600 32 2 High 7
TABLE 5 Exhaust Rate for Test 1
Time (min) 0 3 31 36 45
Rate (kg/s) 4.79 4.79 4.39 3.88 3.88 TABLE 6
Heat Release Rate for Test 1
Time (min) 0 2 15 16 30 31 45 HRR (kW) 0 150 150 250 250 600 600
TABLE 7 Exhaust Rate for Test 2
Time (min) 0 40 45 52.5
Rate (kg/s) 4.79 4.22 3.76 3.76 TABLE 8
Heat Release Rate for Test 2
Time (min) 0 2.5 15 16 27.5 28.5 40 41 52.5 HRR (kW) 0 25 25 150 150 250 250 600 600
TABLE 3
Dimensions of the Tests Dimensions (m)
Length Width Height
Compartment 9 6 5.5
Floor Vent 22.8 0.1 N/A Burner’s surface location 4.5 3.0 0.2
ASHRAE Transactions: Symposia 869
TABLE 9
Exhaust Rate for Test 3
Time (min) 0 48 54 60
Rate (kg/s) 5.13 4.56 3.99 3.99
TABLE 10
Heat Release Rate for Test 3
Time (min) 0 5 20 21 32.5 33.5 45 46 60 HRR (kW) 0 25 25 150 150 250 250 600 600
Figure 2 Predicted and experimental temperatures for
Test 1.
Figure 3 Predicted and experimental CO2 concentrations for Test 1.
Figure 4 Predicted and experimental interface heights for Test 1.
Figure 5 Predicted and experimental temperatures for Test 2.
Figure 6 Predicted and experimental CO2 concentrations for Test 2.
With lower heat release rate (less than 250 kW), the inter-face height determined based on the temperature profiles is comparable to that determined using CO2 concentration
profiles. The smoke layer temperature and CO2 concentrations
are also comparable. When the heat release rate is high (600 kW), the CO2 concentration profile gives considerably higher
interface height and, thus, higher smoke layer temperature and CO2 concentration. With the higher heat release rate tests, there was considerable direct heating of the lower layer near the fire, resulting in higher temperatures measured by thermo-couples located at the room quarter point. For this case, the CO2 measurements are a better indication of the location of the
smoke layer interface.
With the exhaust duct located below the ceiling, hot layer temperature increases and, for most cases, the interface height decreases. Except for the 600 kW case, longer duct extension results in higher smoke CO2 concentration.
In general, the predicted results using the two-zone model are in good agreement with the experimental results, espe-cially the hot layer temperature.
In Test 3, McCaffrey and Heskestad’s models give comparable estimates for the interface heights. For Tests 1 and 2, McCaffrey’s model predicts an interface height, which compares better with the experiment than the interface height obtained using Heskestad’s model.
When the heat release rate is less than 50 kW, the predicted CO2 concentration of the smoke layer is always
much less than the measured value. This may be due to the higher experimental error due to the small values. Also, these are the cases in which there will be plugholing, indicating the model may be overpredicting the efficiency of the mechanical exhaust system. For 150 to 250 kW, the model’s prediction is in good agreement with the experimental data.
When the heat release rate is 600kW, the predicted concentration is considerably higher than the measured data
Figure 7 Predicted and experimental interface heights for Test 2.
Figure 8 Predicted and experimental temperatures for
Test 3.
Figure 9 Predicted and experimental CO2 concentrations
for Test 3.
Figure 10 Predicted and experimental interface heights for
ASHRAE Transactions: Symposia 871
based on the temperature profiles. However, for this case, if we use the CO2 concentration profile to determine the interface
height, then much better agreement can be obtained because the CO2 concentration profile gives higher experimental
inter-face height and higher hot layer CO2 concentration and
temperature. As noted previously, the larger fires result in heating in the lower portion of the compartment, making it difficult to determine the smoke layer interface using the temperature measurements.
As expected, the higher the CO2 concentration is, the higher the temperature rise is. However, temperature is the parameter with the best agreement with the experimental data in this study. Even for the cases where interface heights and CO2 concentrations are not predicted well, the model still predicts very good results for the hot layer temperature.
SUMMARY
This paper presents a comparison between experimental data obtained from tests performed to investigate the effective-ness of an atrium smoke exhaust system and predicted results for a two-zone model. It is shown that, for the cases investi-gated in this study, the results of the zone model compare well with the experimental data.
For small to medium heat release rates, the interface heights determined using the temperature profiles have no significant difference from those using the concentration profiles. For the larger heat release rate, the CO2 concentration profiles give considerably higher interface heights. Longer duct extension into the room results in higher hot layer temper-ature rise and, for most cases, higher hot layer CO2 concen-tration and lower interface height.
For the larger heat release rates, the predicted concentra-tion is considerably higher than the experimental data if the temperature profile is used to determine the interface height. But if the CO2 concentration profile is used, then much better
agreement is obtained.
Temperature was found to be the parameter with the best agreement to the experimental data.
REFERENCES
Chow, W.K., and K.W. Lau. 1995. Field tests on atrium smoke control systems. ASHRAE Transactions 101(1): 461-469.
Cooper, L.Y. 1982. Heat transfer from a buoyant plume to an unconfined ceiling. ASME Journal of Heat Transfer 104: 446.
Cooper, L.Y. 1995. Compartment fire-generated environ-ment and smoke filling. SFPE Handbook of Fire
Protec-tion Engineering, Quincy, Mass.: NaProtec-tional Fire
Protection Association, pp. 2-116-2-138.
Cox, G. 1994. The challenge of fire modeling. Fire Safety
Journal 23: 123.
Friedman, R. 1992. An international survey of computer models for fire and smoke. Journal of Fire Protection
Engineering 4: 81.
Fu, Z., and W. Fan. 1996. A zone-type model for a building fire and its sensitivity analysis. Fire and Materials 20: 21.
Fu, Z., and G. Hadjisophocleous. 2000. A two-zone fire growth and smoke movement model for multi-compart-ment buildings. Fire Safety Journal 34: 257.
Heskestad, G. 1995. Fire plumes. The SFPE Handbook of
Fire Protection Engineering, Quincy, Mass.: National
Fire Protection Association, p. 2-9.
Klote, J.H., and J.A. Milke. 1992. Design of smoke
manage-ment systems. Atlanta: American Society of Heating,
Refrigerating and Air-Conditioning Engineers, Inc. Lougheed, G., and G. Hadjisophocleous. 1997. Investigation
of Atrium Smoke Exhaust Effectiveness. ASHRAE
Transactions 103(2): 519-533.
McCaffrey, B.J. 1983. Momentum implications for buoyant diffusion flames. Combustion and Flame 52: 149. Milke, J.A. 1990. Smoke management for covered malls and
atria. Fire Technology, August.
Milke, J.A., and F.W. Mowrer. 1994. Computer-aided design for smoke management in atria and covered malls.
ASHRAE Transactions 100(2): 448-456.
Motevalli, Y., and C. Ricciuti. 1992. Characterization of the confined ceiling jet in the presence of an upper layer in transient and steady-state conditions. NIST-GCR-92-613. Gaithersburg, Md.: National Institute of Science and Technology.
Tanaka, T., and T. Yamada. 1985. Smoke control in large scale spaces (Part 1: Analytic theories for simple smoke control problems). Fire Science and Technology 5: 31-40.
Yamada, T., and T. Tanaka. 1985. Smoke control in large scale spaces (Part 2: Smoke control experiments in a large scale space). Fire Science and Technology 5: 41-54.
DISCUSSION
Duncan Phillips, Senior Specialist, RWDI: The model
appears to perform well for the experimental domain studied. Complicated building geometry and converging make-up air tend to disturb plumes. How would you adjust your model to reflect this in order to make it applicable for typical atria being designed today?
George Hadjisophocleous: The model used for this study is
based on the two zone concept and uses plume correlations, which do not account for the effect of obstructions in the plume. The model is not suitable for the applications referred to in the questions, although it can still be used to get a rough estimate of the hot layer height and rate of exhaust.