READ THESE TERMS AND CONDITIONS CAREFULLY BEFORE USING THIS WEBSITE. https://nrc-publications.canada.ca/eng/copyright
Vous avez des questions? Nous pouvons vous aider. Pour communiquer directement avec un auteur, consultez la
première page de la revue dans laquelle son article a été publié afin de trouver ses coordonnées. Si vous n’arrivez pas à les repérer, communiquez avec nous à PublicationsArchive-ArchivesPublications@nrc-cnrc.gc.ca.
Questions? Contact the NRC Publications Archive team at
PublicationsArchive-ArchivesPublications@nrc-cnrc.gc.ca. If you wish to email the authors directly, please see the first page of the publication for their contact information.
NRC Publications Archive
Archives des publications du CNRC
This publication could be one of several versions: author’s original, accepted manuscript or the publisher’s version. / La version de cette publication peut être l’une des suivantes : la version prépublication de l’auteur, la version acceptée du manuscrit ou la version de l’éditeur.
Access and use of this website and the material on it are subject to the Terms and Conditions set forth at
The Impact of ECM furnace motors on natural gas use and overall energy use during the heating season at CCHT research facility
Gusdorf, J.; Swinton, M. C.; Entchev, E.; Simpson, C.; Castellan, B.
https://publications-cnrc.canada.ca/fra/droits
L’accès à ce site Web et l’utilisation de son contenu sont assujettis aux conditions présentées dans le site LISEZ CES CONDITIONS ATTENTIVEMENT AVANT D’UTILISER CE SITE WEB.
NRC Publications Record / Notice d'Archives des publications de CNRC:
https://nrc-publications.canada.ca/eng/view/object/?id=97997ac4-834d-44ff-a5ec-fd4a3f890d39 https://publications-cnrc.canada.ca/fra/voir/objet/?id=97997ac4-834d-44ff-a5ec-fd4a3f890d39
Canadian
Centre
Centre
canadien
des
for Housing Technology
technologies résidentielles
The impact of ECM furnace motors on natural gas use and overall energy use during the heating season of CCHT research facility
Gusdorf, J.; Swinton, M.C.; Entchev, E.; Simpson, C.; Castellan, B.
NRCC-38443
A version of this document is published in / Une version de ce document se trouve dans: Gas Technology Institute’s First Natural Gas Technologies Conference and Exhibition, Orlando,
The Canadian Centre for Housing Technology (CCHT)
Built in 1998, the Canadian Centre for Housing Technology (CCHT) is jointly operated by the National Research Council, Natural Resources Canada, and Canada Mortgage and Housing Corporation. CCHT's mission is to accelerate the development of new technologies and their acceptance in the marketplace.
The Canadian Centre for Housing Technology features twin research houses to evaluate the whole-house performance of new technologies in side-by-side testing. The twin houses offer an intensively monitored real-world environment with simulated occupancy to assess the performance of the residential energy technologies in secure premises. This facility was designed to provide a stepping-stone for manufacturers and developers to test innovative technologies prior to full field trials in occupied houses.
As well, CCHT has an information centre, the InfoCentre, which features a showroom, high-tech meeting room, and the CMHC award winning FlexHouse™ design, shown at CCHT as a demo home. The InfoCentre also features functioning state-of-the art equipment, and demo solar photovoltaic panels. There are over 50 meetings and tours at CCHT annually, with presentations and visits occurring with national and international visitors on a regular basis.
The Impact of ECM Furnace Motors on
Natural Gas Use and Overall Energy Use During the
Heating Season at CCHT Research Facility
For presentation at the GTI Meeting
Orlando, Florida
Sept –Oct 2002
by
John Gusdorf, Natural Resources Canada,
Mike Swinton, National Research Council,
Evgueniy Entchev, Natural Resources Canada,
Craig Simpson, Enbridge Consumers Gas, and
Executive Summary
An evaluation of the impact of Electronically Commutated Motors* (ECMs) has been carried out in a special research facility in Ottawa, Canada. The purpose was to not only demonstrate the ability of the high efficiency ECM motor technology to save large amounts of electrical energy in moving air in forced air heating systems, but to also quantify the amount of any extra natural gas that would be required during the heating season in a climate that is typical of the Canadian winter heating season.
The results have clearly demonstrated that ECMs can offer a unique gas load building opportunity to gas utilities, can save the typical homeowner money on overall energy costs, and offer substantial benefits to the environment through significant reductions in GHGs (green house gases).
1.0 Introduction
Electronically Commutated Motors (ECMs) are significantly more efficient than the Permanent Split Capacitor (PSC) motors used in most residential furnaces today. The efficiency improvement is especially evident in applications that utilize reduced circulating air flow rates, as is often done in systems with continuous fan operation. Thus, using a natural gas furnace with an ECM instead of a PSC motor should reduce electrical consumption. In turn, the decreased electrical consumption should increase the amount of natural gas required to heat the house, since much of the electricity used by the motor ends up as space heat, and the more efficient motor produces less heat. The net effects should be to save the homeowner money – since natural gas is less expensive than electricity, and to reduce greenhouse gas emissions. Natural Resources Canada (NRCan), Enbridge Consumers Gas, and the Canadian Centre for Housing Technology (CCHT) measured these effects by installing an ECM in a furnace in one of the identical CCHT houses while leaving the PSC motor installed in the furnace in the other identical house. In both cases the CCHT houses are inhabited by “virtual families” and experience all typical energy uses for homes of modern construction in the climate of Ottawa, Canada.
1.1 Reasons for testing an ECM
At lower speeds ECMs can save over 60% of the electricity used by PSC motors. For example, in low speed circulation a typical PSC furnace motor will use 350 to 500 Watts while an ECM will use 75 - 125 W. Further, ECMs are adjustable over a larger range, so if the lowest flow possible with a PSC motor is higher than required for continuous circulation, the ECM could be set to a lower rate, thus saving even more electricity. In a modern, airtight house in which the furnace motor runs at low speed continuously for fresh air circulation, the electrical savings should be significant. During the heating season, increased use of natural gas would negate part of these savings, but since natural gas is less expensive than electricity, the homeowner's savings would still be substantial. If the house is air conditioned, then the ECM will reduce the amount of energy used by the air conditioner, resulting in even more savings. Reducing the use of electricity should result in a net decrease in greenhouse gas emissions.
1.2 Reasons for Using the CCHT Houses
The Canadian Centre for Housing Technology (CCHT) is a facility designed for doing controlled experiments on residential technologies. It includes two highly instrumented, identical, unoccupied houses. Occupancy is simulated by computer-controlled operation of lights and appliances, use of hot water, and generation of heat to simulate the presence of occupants. Repeated testing under identical conditions
(benchmarking) has shown that the two houses use almost exactly the same amounts of energy for space heating, air conditioning, hot water and utilities. Information on the CCHT is available on its web site, www.ccht-cctr.gc.
The identical houses at the CCHT were ideal locations for the ECM test for two reasons. First, having two identical houses allows the effects of a relatively small change
in one of them to be clearly shown in the collected data, rather than based on an analysis of space heat loads derived from outdoor temperatures, wind speeds and solar radiation. Second, using the CCHT avoids problems of furnace certification and liability. In
general, replacement of a furnace fan motor with a different type of motor is not common practice because changes in the airflow over the heat exchanger can result, with adverse consequences to the performance and longevity of the product (overheating or corrosion). Therefore, the furnace certification would be voided if the fan motor were replaced with a different type from that included in the original certification test report. Because the CCHT research facility is located on Federally owned land and is unoccupied, furnace certification was not an issue. Even though it was not an issue for this project, the authors of this report do not advocate the switching of fan motors, unless the furnace appliance has been re-certification with the different motor.
2.0 House Preparation and Benchmarking
Thermocouple grids were made and installed in the furnace supply and return ducts in each house. These grids consist of several thermocouples connected together so that they measure the average temperature of several points, thus accounting for variations in air temperature that can occur in furnace ducts. The grids were connected to one of the existing data loggers, which were programmed to bin the temperatures (and other variables) according to whether a furnace was in heating or circulation mode. This allowed for continuous, precise monitoring of the furnace return and supply air, and for measurement of heat gains due to the motors. Exterior-mounted, white plastic shades were installed on two of the south-facing windows of each of the houses. Testing in previous years has shown that these shades reduce solar gains and increase heating requirements, thus allowing furnaces to operate over a wider range of loads.
2.1 Installation of Data Loggers
The permanent CCHT data collection system was used throughout this project. In addition, NRCan’s Advanced Combustion Laboratory (ACT) installed a Campbell Scientific CR10X in each house with the following sensors:
Furnace Return Air Temperature, Single Thermocouple Furnace Return Air Temperature, Thermocouple Grid Furnace Supply Air Temperature, Single Thermocouple Furnace Supply Air Temperature, Thermocouple Grid
Motor Temperature
Motor Consumption
Air Flow
Flow times ∆T
RPM of the Furnace Motor
2.2 Background on Benchmarking
Benchmarking consists of running both of the CCHT houses under identical conditions for several days to verify that they are using the same amounts of energy. Conditions that are kept identical in the two houses include thermostat set-points (and resulting indoor temperatures), balanced ventilation rates through heat recovery ventilators, furnace flow rates on heating and continuous modes, hot water use, and internal gains from lights, appliances and simulated occupancy. Once benchmarking has shown that the consumptions of two houses are nearly identical, then an experiment can be conducted by making a change in the Test House while leaving the Reference House unchanged. Benchmarking was done for a total of seventeen days, including eleven days before the first installation of the ECM, and six days between tests with the ECM. All benchmarking and testing was done using the KeepRite Model NTC7075 BFA3 mid-efficiency natural gas furnaces in both houses.
2.3 Testing a PSC Motor and ECM in the Fan Test Rig
In addition to the testing at CCHT, a KeepRite blower-assembly was tested in the Fan Test Rig at NRCan's Advanced Combustion Laboratory (ACT). The assembly was tested with the factory supplied PSC motor and with an ECM programmed to run at various rates. The Fan Test Rig can measure air flows and temperatures more precisely than they can be measured at the CCHT, so that the heat gains from the two motors in their various speeds can be determined precisely. This testing also allowed the efficiency of the motor-blower combinations to be determined.
2.4 Installing an ECM in the Test House Furnace
A new motor bracket was purchased and attached to the ECM to facilitate motor switching. Switching between the PSC motor and the ECM involves physically switching the motors, providing AC power to the ECM, connecting thermostat leads to the ECM, and changing the thermostat fan switch from Auto to On. Motor switching can now be accomplished in about half-an-hour.
2.5 Measuring Duct Air flows and Programming an ECM
With the PSC motor in circulation speed, the air flows from thirteen supply ducts were measured using the CMHC bag inflation test and a heated-thermistor anemometer. The ECM motor was programmed for several circulation airflow rates, and the lowest rate that still provided adequate ventilation to all rooms was used. The air flow rates used in this project were:
Circulation: PSC: 454 L/s, ECM: 204 L/s Heating: PSC: 622 L/s, ECM: 595 L/s.
The intent was to have the heating mode flows of the two motors equal. The 4.5% difference between them is due to the fact that the ECM is adjusted in steps, and is probably within the level of accuracy of the airflow measurements. Air flow was measured with a Eldridge Products mass flow meter. Flow was measured at nine points representing equal areas in a 16" x 16" (406 mm x 406 mm) duct. Ten measurements were averaged at each of the nine points, and then the nine averages were averaged to get the flow.
2.6 Measuring Motor Wattage and Heat Gains from the Motors
The wattage used by each motor in each speed was measured with a Nanovip meter. The thermocouple grids (Section 2.0) were used to measure temperature rise due to the motors in each speed. Wattages and airflows were combined to get theoretical
temperature rises, temperature rises and airflows were combined to give measured temperature rises, and the two were compared.
2.7 Benchmarking for this Project
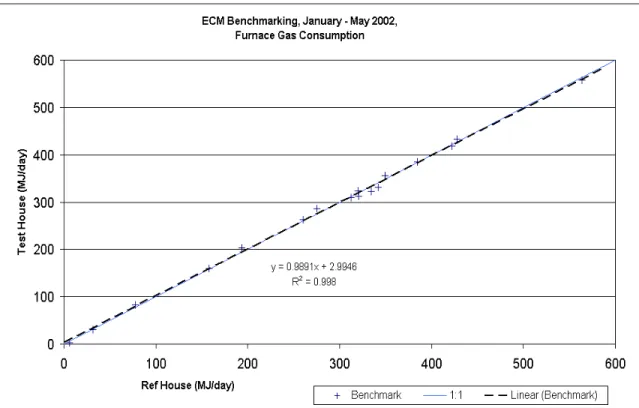
Figure 1 shows the results of the benchmarking that was done specifically for this project, using the graphing technique for side-by-side testing (developed by Mike Swinton, NRCan). The coordinates of each point are the furnace gas consumption in each of the two houses for one calendar day. If the consumption in both houses were exactly the same each day, then all points would fall exactly on the 1:1 (45Ε) line, the slope and intercept of their linear regression would be exactly one and zero, and the correlation coefficient (r2) would be one. Any significant deviations from these values indicate that the houses are not operating identically.
The seventeen benchmark points were collected on January 19th through 29th, March 27th, and May 2nd through 6th, 2002. The Reference House gas consumption varies by almost one hundred, from 6 to 564 MJ/day, and the Test House consumption varies from 4 to 558 MJ/day. The furnace capacity is 1709 MJ/day (67,500 Btu/h), so the benchmark goes from almost no furnace use to 33% of full furnace capacity, which is close to the range that would be used in most heating seasons. The results are a slope of 0.9891, and intercept of 2.99 MJ/day, and an r2 of 0.998. Daily differences in gas
consumption range from -10.93 to +11.78 MJ or -46.1 to +6.9%. When the two days with less than 50 MJ consumption in the Reference House are excluded (See Sections 4.3 and 4.4), then the differences range from -3.5% to +6.9%. The average consumptions are 281.16 MJ in the Reference House and 281.10 MJ in the Test House, a difference of less than 0.1%. Thus, benchmarking gas consumption varied significant from day to day,
Figure 1 – Benchmarking Results
especially at low values where one or two furnace firings a day can make a large difference. But, on average the quantities are not significantly different. These results are considered excellent, and show that the operation of the two houses was almost identical, so that any differences during ECM testing are due to the ECM.
3.0 Effects of the ECM on Electrical Consumption
This section and the following one describe the results of the tests with the ECM in the Test House furnace, and the PSC motor in the Reference House furnace. Tests with identical conditions, and with some gas consumption in both houses, occurred on the following 29 days in the year 2002:
15 - 17 February 3 and 5 March 20 - 25 March 21 - 30 April 14 - 18 May 21, 22 and 25 May
There were also three days in which the Reference House furnace used no gas, but the Test House furnace did. These days were the 23rd, 26th, and 27th of May, 2002, and they are analysed separately. During the first four days of June 2002, the ECM’s
circulation speed was increased so as to be equal to that of the PSC motor, and these days are also analysed separately. All results described below are for the 29 days between February 15th and May 25th unless otherwise noted.
3.1 Motor & Furnace Electricity Consumption
The power use of the ECM and the PSC motor were measured in one-time tests using a Nanovip power meter. The ECM used 16.5 Watts in circulation speed and 284 W in heating speed, while the PSC motor used 350 W in circulation and 490 W in heating. Thus, the ECM used 58% as much as the PSC motor in heating speed, but only 5% as much in circulation. The ECM’s flow rate was almost identical to the PSC’s in heating speed, and was 47% of the PSC’s in circulation speed. As shown in Table 1, the ECM is over one-and-a-half times as efficient as the PSC in heating speed, and is almost ten times as efficient in circulation mode, where efficiency is measured as airflow over motor power.
Mode Motor Power (W) Air Flow (L/s) Flow/Power (L/s≅W)
ECM PSC Diff ECM PSC Diff ECM PSC Diff
Heating 284 490 58% 573 622 92% 2.02 1.27 159%
Circulation 16.5 350 4.7% 211 454 47% 12.8 1.30 985%
Table 1. Comparison of ECM & PSC Power and Air Flow Rates.
A CCHT electrical meter in each house measures the consumption of the furnace, which includes the controls and draft-inducing fans as well as the motor. Daily results from these meters show that on average the furnace with the PSC motor uses 9.29 kWh/day, and the furnace with the ECM uses 2.38 kwh/day, or 26% as much. The difference in kWh/day is relatively constant, averaging 6.91 and varying from 6.49 to 7.32. The Test house consumption as a percentage of the Reference House’s ranges from 12 to 38%, being highest when the furnace spends the greatest amount of time in heating mode. Since the difference between power for heating and for circulation is bigger in the ECM than for the PSC, the ECM’s energy use grows more quickly as the furnace spends more time in heating. Therefore, the ECM’s energy as a percentage of the PSC’s
increases with furnace on-time.
4.0 Effects of the ECM on Natural Gas Consumption
The results described below are for the same 29 days between February 15th and May 25th, as those in the last subsection, unless otherwise noted. During these days, furnace gas consumption in the Reference House varied by a factor of 65, from 6.8 to 440.3 MJ/day. In the Test House, it varied by a factor of 17, from 27.8 to 474.0 MJ/day.
Thus, the data represents a wide range of space heat loads, including loads that are probably close to the maximum for the houses.
Figure 2 – Difference between gas use in test and reference houses as function of gas use in reference house.
4.1 Furnace Gas Differences
The average furnace gas consumption in the Reference House was 213.7 MJ/day, while in the Test House it was 243.4 MJ/day. Thus, the lower electrical consumption of the ECM resulted in an average increased gas consumption of 29.71 MJ/day or 13.9%. The difference varied from 11.83 to 51.75 MJ/day or from 3.6% to 311.7%. The difference in MJ/day show no relationship with Reference House consumption, but the percentage difference, defined as (Test-Ref)/Ref, is greatest when gas use is least, as would be expected since at lower space heat loads the extra heat from the PSC motor constitutes a higher percentage of the total load. Figure 2 shows a strong power law relationship between the two.
4.2 Graph of Benchmarks & Results
Figure 3 compares daily values of furnace gas consumption of both houses during benchmarking and ECM tests. It includes the benchmark points shown in Figure 1, and the results of the ECM testing. Testing results include the 29 days between February 15th and May 25th, when there was furnace gas consumption in both houses. They are shown as X’s, and are included in the correlation of the results. They constitute the results of testing under normal conditions. Theoretically, they should lie on a straight line above the 1:1 line, and with a slope of less than one. This line is above the 1:1 line because the lower electricity use of the ECM causes gas consumption in the Test House to be higher. The slope is less than one because the difference between the PSC and ECM electrical use is higher when the furnace spends less time in heating mode. Figure 3 also includes three points with no furnace gas consumption in the Reference House (two are
indistinguishable), shown as diamonds (∀) on the Y-axis. They constitute a separate series that should lie on the Y-axis between the intercept of the normal condition points and the origin.
The linear correlation for the normal condition points has a slope of 0.992 and a intercept of 31.37 MJ/day. Its correlation coefficient (r2) is 0.994. The intercept is slightly larger than the average difference in gas consumption (29.71 MJ/day), as would be expected since the slope is less than one. The benchmark and results lines are clearly distinct. Both have r2's of over 0.99, and no individual point of one line crosses the correlation line of the other. Thus, the increased furnace gas use due to the ECM is clearly shown in the results.
4.3 Low Furnace Gas Use and Confirmation of the Sander/Barakat effect
As furnace gas consumption in the Reference House gets small, one would expect the relationship between Reference and Test gas consumption to depart from linearity. This is because not all of the extra heat given off by the PSC motor will still be utilizable internal gains. That is, some of this heat will cause the temperature in the Reference House to go above its set-point, and will be lost from the house before the next call for space heating. Since less of the extra heat from the PSC motor is utilizable in the Reference House, less extra gas is required in the Test House. The phenomena of non-utilizable internal (and solar) gains is called the Sander/Barakat effect.
ECM Benchmarking & Results, January - May 2002, Furnace Gas Consumption
y = 0.9922x + 31.372 R2 = 0.9938 y = 0.9891x + 2.9946 R2 = 0.998 0 100 200 300 400 500 600 0 100 200 300 400 500 600
Ref House (MJ/day)
T e s t H o u s e ( M J /d a y )
Benchmark 1:1 Results Results, Y-axis Linear (Results) Linear (Benchmark)
Figure 3 - ECM Benchmarking and Results for Normal Conditions
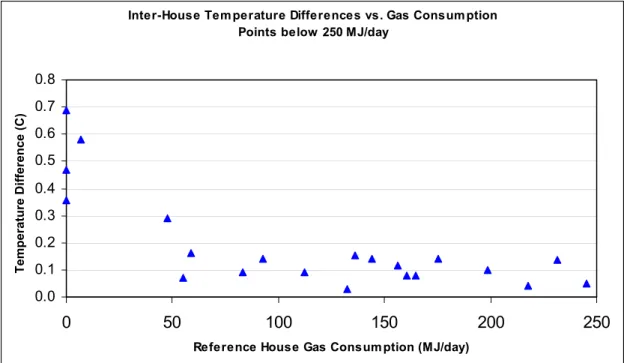
Of the six normal condition points in Figure 3 that represent Reference House consumption of less than 100 MJ/day, four are below the correlation line and one is right on the line. Of the two points representing less than 50 MJ/day, both are well below the line. This would seem to confirm that the Sander/Barakat effect is occurring, i.e., that less extra gas is required in the Test House when gas use in the Reference House is low. This being true, one might expect the non-utilizable gains to result in higher temperatures in the Reference House on days with low gas use. This is confirmed by Figure 4, which shows that the difference between house temperatures gets large as Reference House furnace gas consumption goes below 50 MJ/day. The daily average temperature of each house is found by averaging the 24 hourly values from the thermocouple nearest to the thermostat. The temperature difference is then the average for the Reference House minus that of the Test House. For Reference House gas use above 50 MJ/day, the differences are all 0.1 ΕC ±0.07, which is close to the accuracy of the thermocouples. Below 50 MJ/day, the difference rises rapidly to 0.69 ΕC.
These results suggest that below 50 MJ/day of Reference House furnace gas consumption, the relationship between the furnace gas consumption in the two houses departs from linearity, and should be analysed separately. The 50 MJ/day cut-off makes sense in terms of the relationship between gas and electric heat from the furnace. At that level, over 40% of the total furnace heat of the Reference House comes from the PSC motor in circulation mode, i.e., during times when there is no demand for space heat.
Inter-House Tem perature Differences vs. Gas Consum ption Points below 250 MJ/day
0.0 0.1 0.2 0.3 0.4 0.5 0.6 0.7 0.8 0 50 100 150 200 250
Reference House Gas Consum ption (MJ/day)
Temperature Difference (C)
Figure 4. Inter-House Temperature Difference vs. Reference House Gas Consumption.
4.4 Results with Gas Use less than 50 MJ/DAY
Based on the last sub-section, points with Reference House gas consumption of less than 50 MJ/day should be excluded from the analysis. The results of excluding these two normal condition points are shown in Table 3. The slope decreases from 0.9922 to 0.9777, the intercept increases from 31.372 to 35.584 MJ/day, and r2 decreases
insignificantly from 0.9938 to 0.9934. Compared with theoretical values, the slope with all 29 normal condition points is slightly closer, but the intercept with the two points excluded is significantly closer. Thus, excluding the points with Reference House consumption less than 50 MJ/day provides a better fit with the theoretical values.
Slope Intercept r2
All 29 points 0.9922 31.372 0.9938
Ref House > 50 MJ/day 0.9777 35.584 0.9934
Theoretical line 0.9864 34.093 1
5.0 House Temperatures & Air Circulation
On May 28 2002, the ECM as reprogrammed to have a circulation mode airflow rate as close as possible to that of the PSC motor. The PSC circulation rate was 454 L/s, and the ECM was changed to 463 L/s. Thus, the two flows were within 2%, i.e., within the accuracy of airflow measurements and ECM adjustability. Only five days of data with space heat demand in at least one of the houses could be collected before the end of the time allotted for the ECM project. (Further extending the project would have made little or no difference because there were few if any days with space heat demand left in the season). One of these days had zero furnace gas consumption in the Reference House, and two had consumption between zero and 50 MJ/day. Table 4 compares the results with ECM circulation flows lower than and equal to the PSC motor circulation flows.
Number of days Slope Intercept r2 Circulation: ECM < PSC
All normal points 29 0.9922 31.372 0.9938
Ref House > 50 MJ/day 27 0.9777 35.584 0.9934
Theoretical N/A 0.9864 34.093 1
Circulation: ECM = PSC
All normal points 4 1.1906 18.411 0.7685
Ref House > 50 MJ/day 2 1.171 16.951 1
Theoretical N/A .9919 24.673 1
Table 4. Comparison of Results with ECM Circulation Flows less than and equal to PSC Motor Circulation Flows.
With the two circulation flows equal, there are far too few points to draw any firm conclusions, but the slope and intercept do change in the directions predicted by the theory. That is, the slope increases, and the intercept decreases when the circulation flows become equal. However, the slope becomes significantly greater than one while it should remain less than one, and the intercept becomes significantly less than its
theoretical value. With only two points, the correlation coefficient will necessarily equal one, since any two points lie on a straight line.
In order to investigate whether reduced circulation airflow with the ECM results in inadequate circulation, temperatures in a number of points in the two houses were compared. If differences at specific points were larger during the ECM testing than during benchmarking, this could be considered evidence that the ECM’s circulation
airflow was not adequate, while a lack of such differences would indicate that the ECM’s airflow is adequate. Three five-day periods during which there were significant
temperature variations within each house were selected. Two were ECM test periods and the third was benchmarking. Temperature comparisons were made at eight points on the main floors – including floor-level, mid-height and ceiling points, and the basement.
The temperature difference between a given point in the in the Test House and the same point in the Reference House is called the inter-house temperature difference. These differences ranged from -0.73 to +1.08 ΕC on the main floors, and from -1.19 to +0.36 ΕC in the basement, and occur during both ECM testing and benchmarking. In order to determine whether these differences are greater during ECM testing, temperature deviations – the absolute differences between the inter-house differences were calculated. The largest deviation was 0.46 ΕC and occurred in the basement, while the largest on the main floor was 0.40 ΕC. The great majority or points have deviations of less than 0.2 ΕC, which is close to the level of accuracy of the thermocouples. Deviations are slightly higher in the basement, possibly due to the lack of a return duct there. Thus, this
investigation of temperature differences does not produce any evidence of inadequate ECM airflow.
6.0 Conclusions
Electronically commutated motors (ECMs) are significantly more efficient than the permanently split capacitor (PSC) motors use in most residential furnaces. This is especially true at the lower speeds used for continuous circulation in many new houses. In order to quantify the effects of an ECM on electricity and gas consumption, we installed an ECM in one of the two identical houses of the Canadian Centre for Housing Technology (CCHT), and observed the amounts of furnace natural gas, furnace
electricity, and all internal electricity in the two houses.
Prior to installing the ECM, the two houses were benchmarked, i.e., run under the same conditions with the original PSC furnace motors in both. This confirmed that the daily electricity and gas consumption of the two houses was nearly identical. Furnace air flows, and supply flows to each room of the house, were measured in both the Test and Reference House. The ECM was installed in the Test House and programmed to have the same heating air flow, and a smaller circulation air flow, than the PSC motor that
remained in the Reference House. The ECM was programmed to a lower circulation flow in order to take advantage of its wider range, and the fact that its electrical
consumption continues to drop significantly at lower flows. Air flows to each room were measured at the lower circulation flow, and found to be adequate.
With the ECM and PSC motors operating side by side, the differences in both electrical and natural gas consumption were clear. The ECM reduced the average furnace electrical consumption from 9.29 to 2.38 kWh/day, a 74% saving. Electrical
consumption for the entire house was reduced from 25.9 to 19.1 kWh/day, which is a 26% saving in a house with a typical electrical load. Reducing the use of electricity by
the furnace motor reduces the amount of heat it adds to the house, and thus increases the use of natural gas for heating. This increase was from an average of 213.7 to 243.4 MJ/day, or 14%. As shown in Figures 2 and 3, this secondary effect is very clear, i.e., the plots of daily gas consumption during ECM testing and during benchmarking are quite distinct.
The characteristics of the types of ECM and PSC motors, and of the furnace blower, used at the CCHT were studied in more detail at the Advanced Combustion Technology Lab (ACT). Their fan test rig was used to measure electricity use, air flow, and
aerodynamic efficiency of the motor-blowers across their ranges, and confirmed the fact that ECMs are more efficient, especially at low flow rates. The ACT results also indicate that there is a large potential for savings from better designed motor-blower assemblies. The results from the CCHT were compared with theoretical results and found to be in close agreement. An examination of deviations from the theoretical results at low gas use confirms the Sander/Barakat effect, i.e., the occurrence of non-utilizable internal gains in the house with the PSC motor.
Additional studies that translate these results to other situations have also been carried out using the HOT2000 house energy simulation model. These results are not included here in total but will be available in a report, which will be issued, in electronic form in the near future. Briefly the CCHT results were utilized to project a complete heating season, and also to combinations of other houses, furnaces and climates. For a complete heating season at the CCHT, the projection shows a saving of 1,802 kWh (15 % of total use for the house), and increased natural gas use of 188 m3 (7% of the house total, including use for domestic hot water). The net savings on both electricity and natural gas would be $70 per year, and the net reduction in greenhouse gas emissions would be 1,629 kg of CO2 equivalent. The other projections show similar benefits over a wide range of conditions.
Thus, this project demonstrated two important results. The first is the ability of the CCHT to accurately measure secondary and tertiary effects of a relatively small change in one of the houses. The secondary effect was the difference in natural gas use due to reduced internal gains, and the tertiary effect was the difference in house temperatures due to the Sander/Barakat effect. The second result is the potential benefits of the use of ECMs as furnace fan motors. From the point of view of a natural gas utility promoting ECMs as a demand-side management program, the benefits would include increased gas sales, but at reduced energy cost for the homeowner. From the consumer’s point a view, they include net savings on utility bills, and from a wider perspective, they include significant reductions in greenhouse gas emissions from houses.
This first phase is currently being followed up with a summer air conditioning phase to determine the total electrical savings in the AC season.