Publisher’s version / Version de l'éditeur:
Vous avez des questions? Nous pouvons vous aider. Pour communiquer directement avec un auteur, consultez la
première page de la revue dans laquelle son article a été publié afin de trouver ses coordonnées. Si vous n’arrivez
Questions? Contact the NRC Publications Archive team at
[email protected]. If you wish to email the authors directly, please see the first page of the publication for their contact information.
https://publications-cnrc.canada.ca/fra/droits
L’accès à ce site Web et l’utilisation de son contenu sont assujettis aux conditions présentées dans le site LISEZ CES CONDITIONS ATTENTIVEMENT AVANT D’UTILISER CE SITE WEB.
Technical Report (National Research Council of Canada. Institute for Marine Dynamics); no. TR-2000-07, 2002
READ THESE TERMS AND CONDITIONS CAREFULLY BEFORE USING THIS WEBSITE. https://nrc-publications.canada.ca/eng/copyright
NRC Publications Archive Record / Notice des Archives des publications du CNRC : https://nrc-publications.canada.ca/eng/view/object/?id=d262ab0f-5673-4e64-b4bf-1d4b2f5c1c83 https://publications-cnrc.canada.ca/fra/voir/objet/?id=d262ab0f-5673-4e64-b4bf-1d4b2f5c1c83
For the publisher’s version, please access the DOI link below./ Pour consulter la version de l’éditeur, utilisez le lien DOI ci-dessous.
https://doi.org/10.4224/8896241
Access and use of this website and the material on it are subject to the Terms and Conditions set forth at
FPSO evacuation system performance in a range of environmental conditions
FPSO E
VACUATIONS
YSTEMP
ERFORMANCE IN AR
ANGE OFE
NVIRONMENTALC
ONDITIONSTR-2000-07
Prepared for:
Institute for Marine Dynamics
By
The National Research Council Canada Institute for Marine Dynamics
A. Simões Ré B. Veitch M. Sullivan D. B. Colbourne
SUMMARY
This report describes the results of a physical model study aimed at establishing a baseline performance profile of lifeboat evacuation capability as a function of environmental conditions.
The lifeboat evacuation experiments were performed from a Model Floating Production Storage and Offloading (FPSO) vessel, at the Institute for Marine Dynamics (IMD), Offshore Engineering Basin (OEB) during the month of February 2000.
A twin falls davit evacuation system was used to deploy a Totally Enclosed Motor Propelled Survival Craft (TEMPSC) from the FPSO into wave and wind conditions ranging from calm to Beaufort Scale 8. The system was of the straight fall double wire category with the TEMPSC stowed and launched parallel to the hull. A total of 120 deployments were originally projected for the twin falls davit system. The test program was expanded to include a flexible boom assisted launch arrangement. This brought the total number of deployments to over 180.
The FPSO was tested in its ballast, intact condition and was arranged such that it had a 20° heading to the waves and a 57° heading to the wind. The TEMPSC was deployed to the windward side. The model TEMPSC (100% load condition) was launched at random positions with respect to incident waves, and propulsion power was available when the boat hit the water.
Motions of the FPSO had a major effect on the launch and made it difficult to determine the specific effects of weather conditions on launch performance. Since it is evacuation system performance and the effects of configuration parameters, such as height of launch, clearance of TEMPSC at launch, orientation of the TEMPSC at launch, direction of the weather relative to launch, launch point on waves, and others that can be usefully evaluated by systematic model test series, a second phase of testing consisting of launches from a fixed platform are being considered.
Transport Canada, Canada-Newfoundland Offshore Petroleum Board, Offshore Safety and Survival Centre and other provincial government representatives witnessed a small but representative portion of the experiments.
TABLE OF CONTENTS
Page
SUMMARY ii
TABLE OF CONTENTS iv
List of Tables vi
List of Figures vii
1.0 INTRODUCTION 1
2.0 PROJECT OBJECTIVES 2
3.0 PROJECT EVALUATION CRITERIA 2
4.0 PHYSICAL MODELS 3
4.1 Floating Production Storage and Offloading (FPSO) 3
4.2 Totally Enclosed Motor Propelled Survival Craft (TEMPSC) 7
4.3 Deployment System 9
4.1.1 Twin Fall Davit 9
4.1.2 Flexible Boom 10 5.0 ENVIRONMENTAL MODELS 14 5.1 Regular Waves 14 5.2 Wind 16 6.0 INSTRUMENTATION 16 6.1 Data Acquisition 17 6.2 Co-Ordinate System 18 6.3 Measurement Error 17 7.0 QUALIFICATION TESTS 18
7.2 Decay Test 19 7.3 Verification Test 19 8.0 TEST PROGRAM 20 8.1 Test Methodology 20 8.2 Test Matrix 22 9.0 RESULTS 23
9.1 Data Analysis and Techniques 23
9.1.1 Statistical Analysis 24
9.1.2 Zero-Crossing Analysis 24
9.1.3 Response Amplitude Operators 24
9.1.4 Deployment Analysis 24
9.1.5 Event Analysis 25
10.0 DISCUSSION AND RESULTS 25
10.1 Systems Calibration (200 Series) 26
10.2 FPSO Motion Verification (300 Series) 27
10.3 TEMPSC Deployment from FPSO - TWIN FALLS DAVIT SYSTEM
(Series 400, 500,525,550,600,625) 32
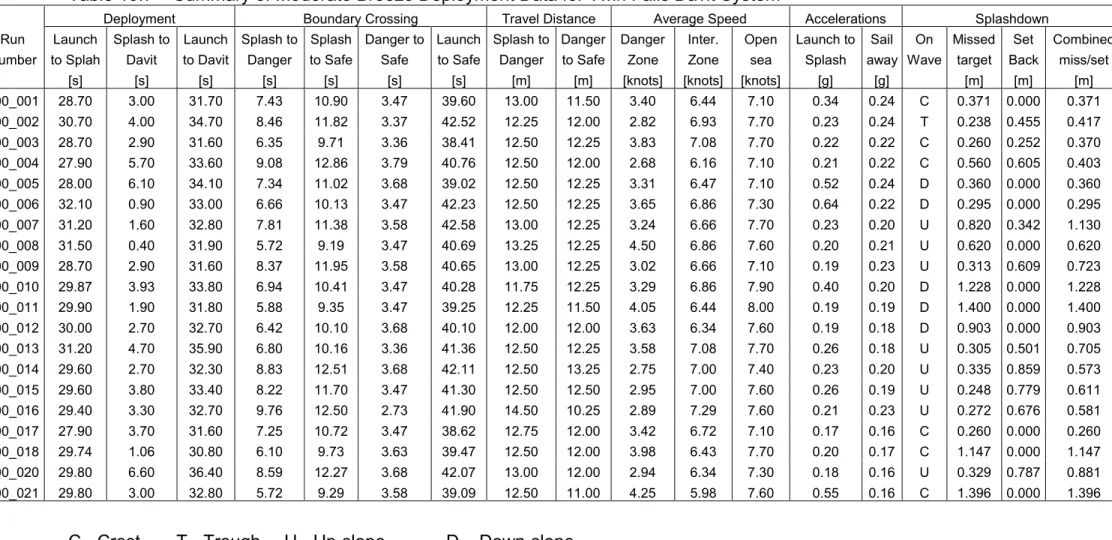
10.3.1 Series 400 – Calm Water 32
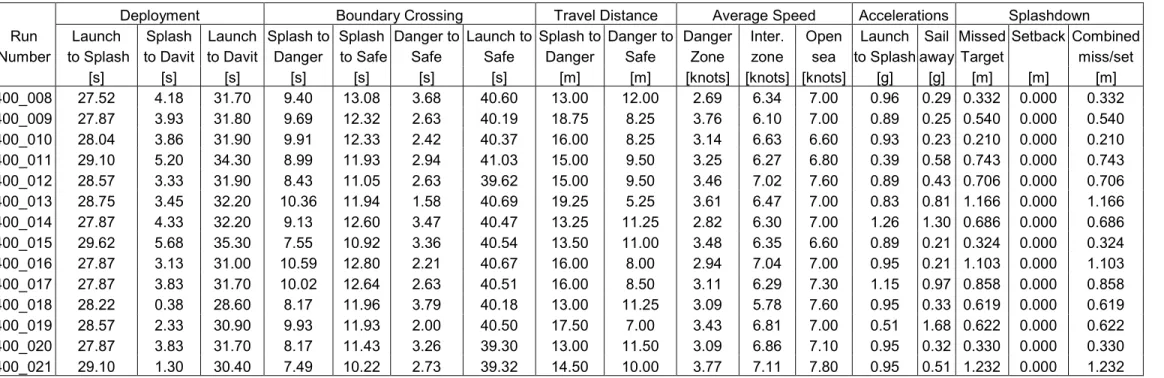
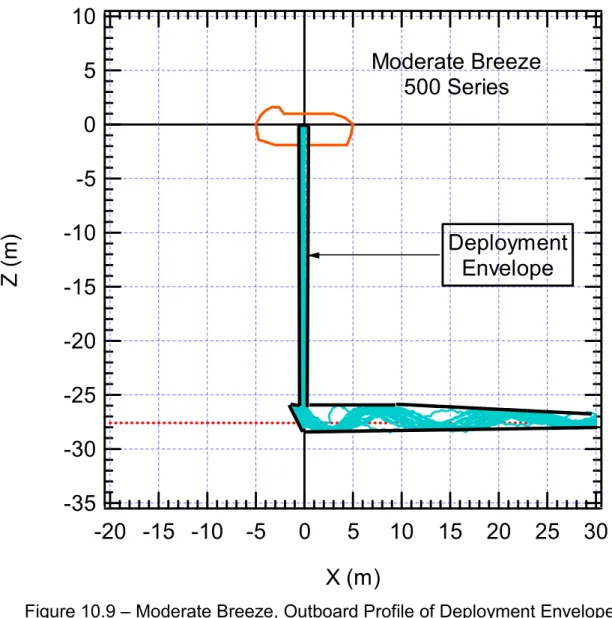
10.3.2 Series 500 – Moderate Breeze 38
10.3.3 Series 525 – Fresh Breeze 41
10.3.4 Series 550 – Strong Breeze 44
10.3.5 Series 600 – Moderate Gale 47
10.3.6 Series 625 – Fresh Gale 50
10.4 TEMPSC Deployment from FPSO – FLEXIBLE BOOM SYSTEM
10.4.1 Series 700 – Calm Water 53
10.4.2 Series 725 – Fresh Breeze 57
10.4.3 Series 800 – Fresh Gale 61
11.0 Conclusions 64
12.0 ACKNOWLEDGMENTS 72
13.0 REFERENCES 73
Appendix 1 General Layout of the Offshore Engineering Basin Appendix 2 FPSO Drawings, Hydrostatics and Mass Properties Appendix 3 TEMPSC Drawings, Hydrostatics, Mass Properties Appendix 4 Horizontal Mooring Configuration
Appendix 5 Flexible Boom System and Associated Equipment Appendix 6 Environment Calibrations
Appendix 7 Calibrated Sensors
Appendix 8 Qualification, Decay and Verification Tests
Appendix 9 Analyzed Test Results for Individual Experiments Appendix 10 Video Log
List of Tables
Table 4.1 FPSO Hydrostatics and Mass Properties
Table 4.2 Summary of Natural Periods for Free-floating and Moored FPSO Table 4.3 TEMPSC Hydrostatic and Mass Properties
Table 4.4 Flexible Boom Tip Deflections and Servo Motor Extension with Load Table 5.1 Environmental Conditions
Table 5.2 Summary of all Wave Files Table 6.1 Approximate Measuring Errors Table 8.1 Test Program
Table 8.2 Verification Test Matrix
Table 8.3 Offshore Evacuation System Test Matrix
Table 10.1 Comparison of Natural Periods for Free-floating and Moored FPSO Table 10.2 Comparison of Natural Periods for FPSO and Similar Vessels Table 10.3 Comparison of Metacentric Heights
Table 10.4 Comparison of Non-dimensional LCG and VCG Table 10.5 Response Amplitude Operators Comparison
Table 10.6 Summary of Calm Water Deployment Data for Twin Falls Davit System
Table 10.7 Summary of Moderate Breeze Deployment Data for Twin Falls Davit System
Table 10.8 Summary of Fresh Breeze Deployment Data for Twin Falls Davit System
Table 10.9 Summary of Strong Breeze Deployment Data for Twin Falls Davit System
Table 10.10 Summary of Moderate Gale Deployment Data for Twin Falls Davit System
Table 10.11 Summary of Fresh Gale Deployment Data for Twin Falls Davit System
Table 10.12 Summary of Calm Water Deployment Data for Flexible Boom System Table 10.13 Summary of Fresh Breeze Deployment Data for Flexible Boom
System
List of Figures
Figure 4.1 FPSO Model
Figure 4.2 FPSO Model Mooring System Figure 4.3 FPSO Mooring Data Comparison Figure 4.4 TEMPSC Canopy and Hull
Figure 4.5 Side View of TEMPSC Model Figure 4.6 Twin Falls Davit System Setup
Figure 4.7 Flexible Boom Deployment system Setup Figure 4.8 Flexible Boom Tip Deflections
Figure 4.9 Servo Motor Extension with Applied Load Figure 10.1 Surge, Sway and Heave RAO Comparison Figure 10.2 Yaw, Pitch and Roll RAO Comparison Figure 10.3 Plan View of the Deployment
Figure 10.4 View along the Centre Line of the TEMPSC Figure 10.5 Outboard Profile of the Deployment
Figure 10.6 Calm Water Plan View of Deployment Envelope
Figure 10.7 Calm Water Outboard Profile of Deployment Envelope Figure 10.8 Moderate Breeze Plan View of Deployment Envelope
Figure 10.9 Moderate Breeze Outboard Profile of Deployment Envelope Figure 10.10 Fresh Breeze Plan View of Deployment Envelope
Figure 10.11 Fresh Breeze Outboard Profile of Deployment Envelope Figure 10.12 Strong Breeze Plan View of Deployment Envelope Figure 10.13 Strong Outboard Profile of Deployment Envelope Figure 10.14 Moderate Gale Plan View of Deployment Envelope
Figure 10.15 Moderate Gale Outboard Profile of Deployment Envelope Figure 10.16 Fresh Gale Plan View of Deployment Envelope
Figure 10.17 Fresh Gale Outboard Profile of Deployment Envelope
Figure 10.18 Calm Water Plan View of Deployment Envelope Flexible Boom System
Figure 10.19 Calm Water Outboard Profile of Deployment Envelope Flexible Boom System
Figure 10.20 Fresh Breeze Plan View of Deployment Envelope Flexible Boom System
Figure 10.21 Fresh Breeze Outboard Profile of Deployment Envelope Flexible Boom System
Figure 10.22 Fresh Gale Plan View of Deployment Envelope Flexible Boom System
Figure 10.23 Fresh Gale Outboard Profile of Deployment Envelope Flexible Boom System
Figure 11.1 Missed Target in Different Environments
Figure 11.2 Mean Time from Start of Launch to Splashdown Figure 11.3 Time from Splashdown to Davit Release
Figure 11.4 Time from Splashdown to Safety Zone
Figure 11.5 TEMPSC Path Length from Splashdown to Safety Boundary Zone Figure 11.6 TEMPSC Path Length from Danger to Safety Zone
Figure 11.7 Missed Target + Setback
Figure 11.8 Lateral Accelerations during Sail-away Figure 11.7 Missed Target + Setback
Figure 11.8 Lateral Accelerations during Sail-away Figure 11.9 Oscillation Angles during TEMPSC Lowering
Figure 11.10 Path Envelopes in Sail-away phase (plan view at top) and Lowering and Sail-away phase (outboard profile)
1.0 INTRODUCTION
This report covers a series of model scale experiments performed on a generic Floating Production and Offloading (FPSO) vessel fitted with a conventional twin fall davit evacuation system. The experiments were aimed at evaluating the performance capability of evacuation system as a function of environmental conditions.
As the offshore oil and gas industry and its regulators move increasingly toward performance, or goal based standards, rather than prescriptive rules, clearly defined performance measures and the means to quantify them become a necessity for assessing and managing safety.
Risk assessment is a design imperative and a regulatory requirement in many jurisdictions, but published quantitative data on lifeboat evacuation are sparse (Spouge 1999), which hampers the design process and attaches uncertainty to any regulatory goals. The results presented in this report help to close the knowledge gap.
Evacuation of an offshore petroleum installation, or ship, can occur under a range of situations, from a routine training exercise, to a precautionary partial evacuation, to an emergency. The degree of stress and related human factors, and the degree of physical impairment of the installation and personnel will be related to the type of situation. An evacuation of healthy personnel carried out with well maintained equipment during a training exercise in good weather is likely to be more successful than an emergency evacuation of distressed and possibly injured personnel in foul weather with equipment that might be damaged by the event that caused the emergency.
These experiments focused on evacuation by lifeboats during emergencies, which must necessarily be done in prevailing weather conditions. Current regulations do not require operators, or duty holders, to demonstrate the capability of evacuation system performance as a function of weather conditions. Apart from their relevance to an overall safety assessment then, the results quantify performance at "the interface between a realised event and its consequences" (MacFarlane 1994) that is, when it is actually needed. Systematic physical model experiments allow us to investigate evacuation performance and generate statistically reliable data that would otherwise be prohibitively dangerous to collect, if done with full scale manned equipment under controlled conditions, or relatively uncertain, due to the low frequency of occurrence of actual installation evacuations, which are not controlled in the experimental sense (Royal Society Study Group 1992, pp.19-20).
The experiments were conducted at the Institute for Marine Dynamics (IMD), Offshore Engineering Basin (OEB) during the month of February 2000. The experimental work reported here deals only with the evacuation phase of the Escape-Evacuation-Rescue (EER) process.
release, were not modelled. However, every reasonable avenue was explored to model the mechanical components of evacuation systems so that they perform in a physically accurate way.
Model launch failures attributed to launch equipment failure are not included in the results as this class of failure is not necessarily statistically representative of full scale.
2.0 PROJECT OBJECTIVES
The main objectives of the test program were quantification of evacuation system performance degradation as a function of environmental conditions and determination of the effect of evacuation system design variation on system performance. The objectives were met by a combination of individual experiments, evacuation scenario and component modeling:
1. Development of a physical model test program that uses waves and wind direction for a particular FPSO condition as program variables
2. Verification tests aimed at determining that the FPSO vessel motions were representative of similar vessels in similar environmental conditions.
3. Environmental conditions representative of East Coast of Canada.
4. FPSO and TEMPSC condition representative of a possible evacuation scenario. 5. Modeling of the complete twin falls davit system, associated TEMPSC and
pay-out speed as well as the flexible boom system with regards to boom deflection characteristics
6. All these features are incorporated into the physical model experiments of the lowering, splashdown and sail-away of the TEMPSC.
The benefits of conducting these experiments were:
A. The quantification of evacuation system performance degradation as a function of environmental conditions.
B. Determination of the effect of evacuation system design variation on system performance.
C. Development of information that may be used by offshore platform managers in emergency evacuation situations.
D. Establishment of a non-proprietary database on evacuation system baseline performance that may be used by designers, operators and regulators to make rational decisions.
3.0 PROJECT EVALUATION CRITERIA
In order to evaluate the evacuation process, several parameters such as time from launch start to splashdown, time from splashdown to open sea, path length from splashdown to danger zone boundary, path length from danger zone boundary to safety zone boundary, distance from target to drop point, setback after splashdown,
accelerations during lowering and sail-away, oscillations during lowering and collisions were directly measured and/or derived. Evaluation criteria are as follows for both the experiments and the actual measurements:
EXPERIMENTS
Twin falls davit deployments from the FPSO at 20o heading to the waves and 57o to the wind floating in an intact condition at the ballast draft and for six different environment conditions. Additional experiments for the modified evacuation system fitted with a flexible boom. All the experiments were performed from the windward side.
MEASUREMENTS
Deployment Phase (from start of lowering to splashdown)
X-Y-Z position of the TEMPSC, lateral acceleration of the TEMPSC, davit payout speed, flexible boom position and load, collisions
Sail away Phase (from splashdown to outside the safe boundary zone)
X-Y-Z position of the TEMPSC, relative position of the TEMPSC with the FPSO, time to cross danger and safe boundary zones, average sail away speed, lateral accelerations of the TEMPSC
4.0 PHYSICAL MODELS
Adequate physical models (i.e. models that accurately predict one or more characteristics of the prototype but not all the characteristics) of the FPSO vessel, TEMPSC and the flexible boom system and its components were designed and manufactured according to Froude scaling laws at a scale of 27.65. In the following sections a description of the vessel and the system is presented. Selected photographs of the different physical models and their components are incorporated in Appendix 11.
4.1 Floating Production Storage and Offloading (FPSO) Vessel
The FPSO hull included flat plate bilge keels, forecastle, bulwarks, and accommodation module and an enclosed main deck for water integrity. Remaining topside structures such as the process equipment module, helideck, flare tower, cranes and other above structures were left off. Provision for port and starboard TEMPSC launching systems were made but only the starboard side was used during the testing. It was determined that this would represent the worst-case scenario, since this was the windward side. Also from test program efficiency, observation and video recording considerations, deployment from one side was more advantageous.
Figure 4.1- FPSO Model
The model was further modified to carry an under-water rotatable mooring that was fitted at the centre of the moonpool and extended 310 mm below the cover of the moonpool. The moonpool cover was fitted at the same level as the bottom of the FPSO.
The model mooring was located below the FPSO bottom and was designed to have the modeled stiffness characteristics of full-scale mooring lines. Detailed drawings of the model mooring are located in Appendix 4. The mooring system consisted of a mooring post attached to the model. At the bottom end of the post a 200 mm turntable was mounted to which three mooring lines were attached in a 120 degrees radial spacing and extending under water to spring support posts on the side of the basin. The springs were tri-rated and provided an equivalent mooring line restoring force. Figure 4.3, compares the tri-rate springs linearized mooring characteristics to those of a typical FPSO non-linear single group mooring characteristics. The linearized spring system is a good representation of the actual mooring system but differences occur in large excursions. These are non-linear systems that in these tests were modeled linearly.
3500 3000 2500 2000 1500 1000 500 0 H o riz o nt al Forc e ( M T) -30 -20 -10 0 10 20 30 Offset (m) IMD Linearization Typical FPSO Mooring Data
Single Group Mooring Characteristic Curve
Figure 4.3 – FPSO Mooring Data Comparison
The model hull was constructed of Styrofoam, wood and glass reinforced plastic (GRP). The model's internal structure consisted of a plywood box supported by transverse and longitudinal frames. Foam strips roughly 100 mm wide and 51 mm thick were glued to the box and reinforced with RenShape (a high density foam) at the aft and forward thruster locations and in the moonpool area. The Institute’s computer controlled milling machine milled the model FPSO hull shape with a ball-nose cutter. The tool paths compensated for the thickness of the fiberglass, gelcoat and paint. The model was hand finished, covered with two layers of 340 g/m2 fiberglass cloth and epoxy resin and a layer of gelcoat that was faired smooth. The
model hull surface was painted yellow; the accommodation module and deck covers were painted white.
Draft marks for the full and ballast loads were marked on both sides at stations 1, 2, 10, 19, 20 and at the longitudinal centre of the moonpool. A grid with its origin at the intersection of the midpoint between the davit arms and the keel of the TEMPSC in its launching position was marked on the side of the FPSO hull. The grid's x-increments were half the TEMPSC's overall length (5.1m)and the z-increments were the TEMPSC's overall height (3.5m).
The FPSO model was tested for the intact ballast load. The hydrostatics for the ballast load condition were calculated and the results are presented for both the model and full scale vessels in Appendix 2. The empty FPSO model was weighed and swung using a large steel frame in order to measure the model’s radii of gyration. The inertia of the ballast weights, the accommodation module, and deck covers were included by calculation. An inclining experiment was performed to determine the transverse metacentric height (GM) of the free-floating model. Weights located on either side of midships at deck level were used as trimming weights. The weights were moved port and starboard equal distances for the inclining experiment.
A summary of the hydrostatics and the mass properties is presented in Table 4.1. below.
Table 4.1 – FPSO Hydrostatics & Mass Properties
Floating Production Storage Offloading (FPSO) Vessel
Condition BL Ballast
Length Between Perpendiculars LPP m 277.0
Length on Water Line LWP m 273.5
Beam B m 44.7
Draft at After Perpendicular TAP m 12.81
Draft at Forward Perpendicular TFP m 11.87
Equivalent Level Keel Draft TMEAN m 12.37
Trim by stern deg. 0.19
Displacement ∆ tonnes 122159
Centre Gravity Above baseline CG m 18.0
Transverse Metacentric Height GMT m 3.34
The natural periods in heave, pitch and roll of the free-floating (unmoored) FPSO were measured. The natural surge, heave, pitch and roll periods of the moored model were also measured. All the natural periods were measured using the Qualisys Optical Tracking System (QOTS). The natural periods for the free-floating
and moored FPSO model are summarized in Table 4.2. Appendix 8, Qualification and Decay Tests, contains the graphical presentation of the FPSO surge, heave, pitch and roll characteristics.
Table 4.2 – Summary of Natural Periods for Free-Floating and Moored FPSO FPSO Condition Natural Period Free-Floating Moored BL Heave 9.56
*
BL Pitch 9.08 9.48 BL Roll 23.72 22.20 BL Surge - 105.3 Note:*
No valid data collected during testing.4.2 Totally Enclosed Motor Propelled Survival Craft (TEMPSC)
The model TEMPSC was representative of a typical 80-person craft. The model was fitted with two mechanical releases for the twin falls. For the modified system, a hook was added to the forward davit release block for attachment of the tagline ring.
The TEMPSC model was fabricated in two halves (hull and canopy) from glass reinforced plastic (GRP). The hull and canopy mated along the gunwale line. A rubberized gasket was used between the two to prevent water ingress. The model hull was fitted with a working rudder, rudder servo, 18mm three bladed propeller, shaft, DC motor, motor controller, receiver unit, rechargeable battery pack, accelerometer, and simulated hydrostatic interlock release unit. The hydrostatic release unit was modeled by inserting four brass pins (bow, stern, port and starboard at midships) at an equivalent full scale height above base line of approximately 0.5m. In order for the TEMPSC blocks to be given the open command, an electronic circuit had to sense that at least three of the pins were submerged. The circuit also activated a light positioned on the TEMPSC canopy that served as a visual trigger for the operator to open the block. This arrangement ensured that no accidental opening of the blocks was possible and modeled an “On-Load” system with hydrostatic interlock. The TEMPSC was tested in the equivalent full load condition. No attempt was made to model fenders and other associated equipment. The accelerometer was mounted on the keel and oriented such it recorded lateral accelerations. The canopy was fitted with a servomotor that activated the forward and aft falls release mechanism and opened the flexible boom hook safety.
Figure 4.4 – TEMPSC Canopy and Hull
Figure 4.5 – Side View of the TEMPSC Model
Reflective tape was attached to the canopy at several locations for use with the QOTS. The instrumentation on the hull portion of the TEMPSC was used for the steering, propulsion and acceleration, while the instrumentation on the canopy was used to activate the flexible boom hook and release mechanisms. The complete systems are explained in detail in Appendix 3.
The TEMPSC speed was determined by averaging the time required by the model to travel a distance of 20m. The TEMPSC model speed trials were conducted in the
towing tank in calm water with the model in its test configuration and load condition. An average speed of 5.94 knots (full scale) was achieved, which is slightly below the target of 6 knots that is required by international regulations (IMO 1997a). For repeatability purposes the calm water speed tests were repeated twice. The overall TEMPSC forward speed was programmed into the controller.
The hydrostatic properties and hull data are summarized in Appendix 3. The vertical centre of gravity (VCG) and radii of gyration were obtained by swinging the TEMPSC model hull on a frame in air. Results of the swinging are presented in Appendix 3. Table 4.3 – TEMPSC Hydrostatics & Mass Properties
Tottaly Enclosed Motor Propoelled Survival Craft
Condition FL 100%
Length Overall LOA m 9.80
Length on Water Line LWP m 9.80
Beam B m 3.30
Trim by stern deg. 0.78
Displacement ∆ tonnes 11.0
Centre Gravity Above baseline CG m 1.37
Transverse Metacentric Height GMT m 0.71
4.3 Deployment System
The deployment system for the FPSO is classified as a semi-wet evacuation system and is characterized by two main components, namely, the evacuation craft and the system that launches it. Modifications were made to the launch system consisting of the addition of a flexible boom. Details of the modified system are described below. 4.3.1 Twin Fall Davit
The twin falls davit system was of the straight fall double wire category with a totally enclosed motor propelled survival craft (TEMPSC) stowed and launched parallel to the hull. The basic test setup is shown in Figure 4.6.
The deployment clearance of the TEMPSC from the FPSO was 1.5 times the breadth of the TEMPSC, ≈5.5m full-scale; the launch height was ≈27.0 m above the still water surface. All tests were done with the TEMPSC its 100% load condition. The davit system main components are the winch drum for the cable storage, the winch brake for controlling the speed of descent, and the cables themselves. Cable properties, such as diameter, breaking strength, stiffness etc. were not modeled, however, cable length was.
Figure 4.6 – Twin Falls Davit System Setup
The rate of descent of the TEMPSC by programming the DC motor controller to spool out cable from the winch drums at a full-scale rate of 53.6m⋅min-1. The
lowering speed was obtained from the following formula:
S= 0.4+ 0.02H (1)
Where, S is the lowering speed in meters per second and H is the height in meters from the davit head to the still water line at the lightest seagoing condition (IMO 1997b, Regulation 41, General requirements for lifeboats, Lifeboat propulsion, page 342).
Swivels were attached to the TEMPSC end of the davit cables. These were in turn fitted into the pins of the release blocks located at the bow and stern of the TEMPSC model. The pins of the release blocks were linked to a servomotor fitted in the TEMPSC canopy and activated from the side of the tank by a radio controller. Release of the forward and aft cables was simultaneous: no problems were encountered with the system.
4.3.2 Flexible Boom System
The modified launch system consisted of a flexible boom held by a saddle support and a set of hinges attached to a base plate. The modified test setup is shown below in Figure 4.7.
Figure 4.7 – Flexible Boom Deployment System Setup
The base plate was mounted approximately 2.5×TEMPSC height (316.5mm) below the embarkation deck, ⅛×TEMPSC length (45.6mm) forward of the forward davit arm, and ½×TEMPSC beam (66.5mm) from the bulwarks. The hinges had a horizontal axis, allowing the boom to move in a vertical plane with a swing of about 75°. The boom length (≈868mm) was about the same as the vertical distance from the TEMPSC launching position to the calm water surface for the FPSO at the ballast draft. The boom support was provided by an electronic spring controlled by a feedback loop of ram extension versus load. The boom was parked at an angle of 40° with respect to the baseline. A fixed length of line, or tagline, was attached at one end to the tip of the boom and at the other end to a metal ring. The ring fitted over the boom hook attached at the bow of the TEMPSC forward of the davit release block. The length of the tagline was set at about the same length as the boom itself. In a deployment, as the TEMPSC is lowered by the davit falls, tension is generated on the tagline, causing the boom to rotate at the base and bend throughout its length until the falls are released. The TEMPSC is then pulled through the water by the tagline away from the FPSO and as it passes under the boom tip the tagline releases. The pulling motion is generated by the hydraulic pressure build-up in the hydraulic cylinder attached to the saddle. In the model version, this was accomplished via a controlled servo-motor that was calibrated to behave in the same fashion as the full-scale system. The hydraulic cylinder pulls the boom upwards
causing the TEMPSC to be pulled in an outward direction away from the FPSO. During deployment and prior to the release of the TEMPSC from the davit falls, the tagline changes the heading of the TEMPSC away from the FPSO and stabilizes the TEMPSC as it is being lowered to the water surface. The stabilization of the TEMPSC reduces the pendulum effect observed in traditional twin davit falls systems.
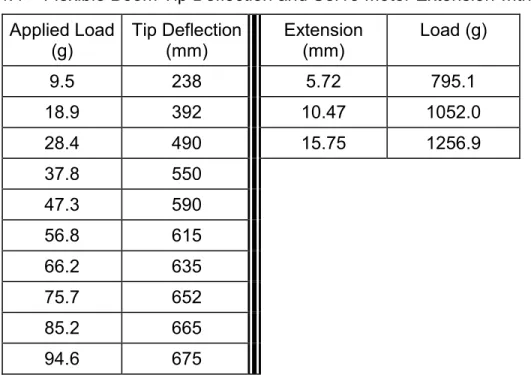
Adequate scaling of the boom components was achieved. Boom tip deflection as well as ram extension and load were scaled according to information obtained from full scale. Tables 4.4 boom tip deflection, electronic spring extension versus load together with Figures 4.8 and 4.9 below show the modeled results. Boom deflection experiments were carried out with the boom in a horizontal position with loads applied at the 734.2 mm mark.
Table 4.4 – Flexible Boom Tip Deflection and Servo Motor Extension with Load Applied Load
(g) Tip Deflection (mm) Extension (mm) Load (g)
9.5 238 5.72 795.1 18.9 392 10.47 1052.0 28.4 490 15.75 1256.9 37.8 550 47.3 590 56.8 615 66.2 635 75.7 652 85.2 665 94.6 675
All the cables associated with the system (i.e. falls and tagline) did not have their properties such as stiffness, diameter, etc. scaled; however, the cable and tagline lengths were scaled.
1000 900 800 700 600 500 400 300 200 100 0 Tip Def lect ion ( m m ) 100 90 80 70 60 50 40 30 20 10 0 Applied Load (g) Flexible Boom Deflection
Figure 4.8– Flexible Boom Tip Deflection
1500 1250 1000 750 500 M easur ed Loa d (g) 20 15 10 5 0
Servo Motor Extension (mm) Measured Load
5.0 ENVIRONMENTAL MODELS
The Institute for Marine Dynamics (IMD) Offshore Engineering Basin (OEB) has a nominal working area of 65x26 m with a working depth of 3 m. The OEB is fitted with 168 individual wavemaker segments, hydraulically activated and distributed in an “L” shape around its perimeter. The wavemakers are capable of generating multi-directional irregular waves of 0.5 m significant wave height. A general layout of the OEB is presented in Appendix 1.
A layout of the basin showing the direction of the waves, wind and the positioning of the FPSO is also presented in Appendix 1.
This series of experiments required the generation of different environments consisting of waves and wind. The wave modeling concentrated on the matching of the wave height and period while the wind concentrated matching a mean wind speed. The wave matching is performed without the model in the basin, while for the wind speed calibration the FPSO model was on its moorings. The required quantities are adjusted by iteration to the desired settings and the control signals recorded for playback during the test.
Table 5.1 below summarized the full-scale environmental conditions for the waves and wind. Appendix 6 contains the details and results of the environmental calibrations. The sections that follow discuss specific aspects of each environmental element.
Table 5.1 – Environmental Conditions
WAVES WIND
Environment Beaufort Scale H (m) T (s) Direction (Degrees) Velocity (m/s) Direction (Degrees) A (0) Calm Water 0.00 0.00 200 0.00 143 B (4) Moderate Breeze 1.01 5.6 200 7.20 143 C (5) Fresh Breeze 2.10 7.70 200 9.77 143 D (6) Strong Breeze 3.96 9.90 200 12.60 143 E (7) Moderate Gale 6.71 12.10 200 15.43 143 F (8) Fresh Gale 11.28 14.90 200 19.03 143 5.1 Regular Waves
Wave simulation at IMD is provided by a multi-segmented hydraulically powered paddle type wavemaker. Regular waves can be generated as well as short crested or long crested waves. Wave direction can be varied from zero to 90 degrees in the basin.
The test programme required the generation of five regular waves. The waves were initially matched on wave height and period without the FPSO model in the basin. For each matched wave, a segment of 20 cycles was chosen to evaluate the wave parameters. The 20-cycle segment was selected by windowing through the entire time trace.
The following criteria were applied to each segment selected:
A. DeviationfromHeightTarget
(
)
arg argH
H
H
et T et T Avg− =<
5%B. WaveHeight Stability
(
H
Max)
H
H
Avg Min − =<
5%C. WaveCrest Stability
(
C
Max)
C
C
Avg Min − =<
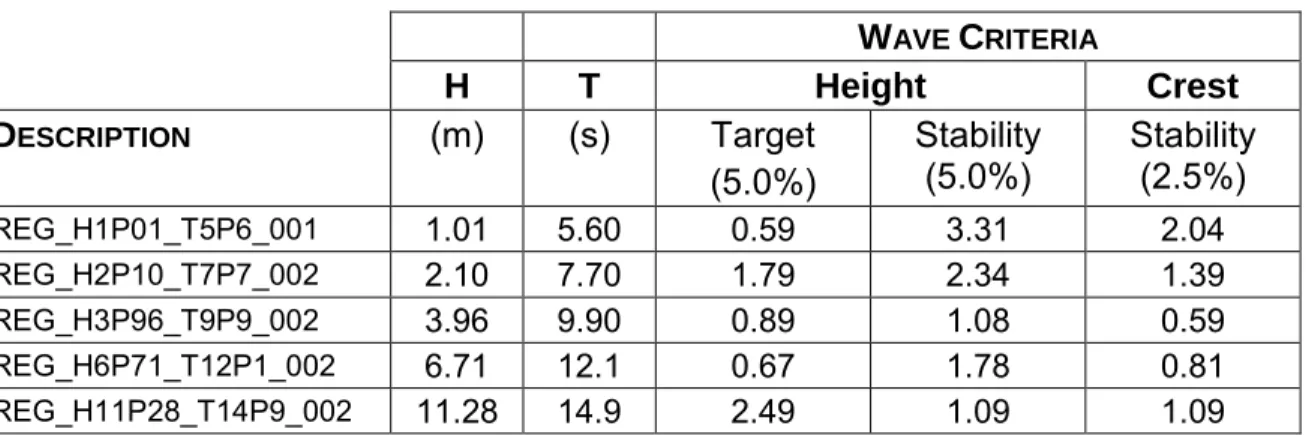
2.5%The selected segments were examined to ensure they were within the target tolerances. All five waves used in the test programme met the three criteria.
During testing the wave signal is also recorded but due to reflections from the model, this may not exactly mimic the calibrated wave.
The waves were regular waves run with the basin in flume mode and with a 1600 direction (180o -- head seas). The files were defined using the following naming convention:
REG_HαPα_TβPβ_00δ
Where:
REG - indicates regular waves H - denotes wave height T - denotes wave period P - defines the decimal place
α - define the significant wave height in metres
β - defines the wave period in seconds
δ - defines the incremental matching attempt number
For example, the run designated:
“REG_H3P96_T9P90_002”
Defines a regular wave with a wave height of 3.96 metres, a period of 9.90 seconds and a matching attempt number of 2. The entire wave matching for the test series is contained in Appendix 6.
Table 5.2 – Summary of All Wave Files WAVE CRITERIA H T Height Crest DESCRIPTION (m) (s) Target (5.0%) Stability (5.0%) Stability (2.5%) REG_H1P01_T5P6_001 1.01 5.60 0.59 3.31 2.04 REG_H2P10_T7P7_002 2.10 7.70 1.79 2.34 1.39 REG_H3P96_T9P9_002 3.96 9.90 0.89 1.08 0.59 REG_H6P71_T12P1_002 6.71 12.1 0.67 1.78 0.81 REG_H11P28_T14P9_002 11.28 14.9 2.49 1.09 1.09 5.2 Wind
Wind was simulated using a horizontal array of 12 analog-controlled fans mounted on support frames. The fans were positioned such that the wind direction was 37o to the FPSO heading and at a distance of 7.70m from the FPSO turret centre. Each fan, with a blade diameter of 530 mm, was powered by a DC motor, capable of rotating at speeds of up to 5000 rpm. The wind generator can produce a turbulent wind spectrum with a mean wind speed of 12 m/s. For installation and operating procedures refer to (Fudge & McKay 1995).
The wind speed was modeled in terms of mean speed and was calibrated prior to the test program with the FPSO model installed. The fans were run at a steady speed and adjusted so that at a distance of 7.70m, the mean wind speed was the one specified in the test program.
The accommodation module adjacent to the deployment zone was an accurate representation of a prototype, however the structures aft of this module were not modeled. The wind loading on these superstructures would not affect the TEMPSC deployment.
6.0 INSTRUMENTATION
Instrumentation for the models consisted of the following:
•
Qualisys Optical tracking system (QOTS) to provide six degrees of freedom motions of the FPSO model with respect to the earth fixed coordinate system (see Section 6.2)•
One anemometer to provide information on wind speed in the area of TEMPSC deployment,•
A second QOTS to provide TEMPSC X-Y-Z motion during deployment and sail-away,•
A miniature load cell to provide feedback on the modeled hydraulic system load versus extension,•
A motor controller to provide accurate davit pay-out rates•
An electronic switch identifying the davit release time.•
Two capacitance wave probes (one upstream and one beam of the FPSO) to give feedback on the wave environment,A summary of the instrumentation calibration used throughout the tests is presented in Appendix 7.
Video records of the tests were recorded with four fixed video cameras and a hand held one. Still photographs were taken with a 35 mm and digital cameras. The fixed video cameras were located in the following locations:
•
One black and white camera mounted on the FPSO capturing the start of TEMPSC descent, splashdown and sail-away•
A ceiling mounted camera providing a birds-eye view of the entire process•
One camera mounted on the side of the basin providing a beam view of the tests•
One camera mounted on the wind machine looking into the FPSO and providing a view of the evacuation zone.The Qualisys Optical Tracking System (QOTS) tracked an irregular array of reflective spheres mounted on a vertical support at the bow of the FPSO model to measure the six-degrees of freedom motions of the model with respect to an inertial coordinate system. An anemometer was mounted just aft of the davit arms to provide wind speed information in the area of the TEMPSC location. Four video cameras were used to track the TEMPSC from start of descent to splashdown and sail-away.
6.1 Data Acquisition
Data acquisition was made through three different systems, namely, Neff620-500, telemetry and video and at two sampling frequencies. The Neff and telemetry data were sampled at 50 Hz. The video data was sampled at normal recording speed of 30 frames per second. The Neff system was shore based, while the telemetry was installed on the FPSO. The video was both FPSO and shore based.
The video acquisition system consisted of four VHS and SVHS video cameras. The cameras were installed at the locations stated in Section 6.0. All the cameras except the one on board of the FPSO were attached to pan and tilt mechanisms controlled from the observation tower. These cameras had remotely controlled zoom and focusing. The camera on the board of the FPSO was mounted on a tripod that provided for some degree of adjustment and any modifications to the focus had to be done manually. The video format of all the cameras was NTSC.
6.2 Co-Ordinate System
The coordinate systems used in the analysis of this series of experiments can be define as follows:
•
Basin Coordinate SystemGlobal right-handed system with the origin at the centre of the turret at the main deck level at its rest position in calm water. The X-axis is defined as up the basin in the direction of the west wall wavemakers, Y-axis is defined to port and the Z-axis upwards. Wave probe locations and wind machine locations are referenced to this system.
•
FPSO Coordinate SystemsFPSO fixed with origin at the turret centre. This coordinate right-handed system is fixed to the FPSO and moves with it. It defines location of instruments on the FPSO, embarkation zone, flexible boom and davits locations, electronic spring load, and pay out.
•
TEMPSC Coordinate SystemsTEMPSC fixed with origin at the centre of gravity. This coordinate right-handed system is fixed to the TEMPSC and moves with it. It defines the location of the release mechanisms and other instruments, and lateral accelerations.
6.3 Measurement Error
Approximate measuring errors in model and full scale-scale units are summarized as follows:
Table 6.1 – Approximate Measuring Errors
DESCRIPTION MODEL SCALE FULL SCALE
Qualisys Linear Motions FPSO and TEMPSC ± 5 mm ±138.5 mm Qualisys Angular Motions FPSO ± 0.5 degrees ± 0.5 degrees Flexible boom electronic spring Load ± 0.05 N ± 1.06 kN
Lateral Accelerations ± 0.1 m/s2 ± 0.1 m/s2
7.0 QUALIFICATION TESTS
Qualification tests consisted of instrumentation calibration, post-test calibrations, and decay tests in which the models were offset and allowed to oscillate in still water to determine the natural oscillation periods and the damping of the free-floating and moored FPSO. Also included in this section are the verification tests conducted to ensure that the conditions the evacuation system was being used was representative of similar hulls in similar environmental conditions.
7.1 Calibrations
All analog sensors were calibrated before the start of the experiments. The response of the sensor to a set of exciting loads was measured and a straight line fitted through the data points by means of a least squares technique.
The line is defined by two constants A and B, which relate the integer analog-to-digital (A/D) converter reading (counts) to the physical quantities being measured according to the following linear transformation:
( )
k(
M-B( )
k)
A
X= ×
Where:
X = physical value in physical units, M = integer A/D converter reading,
A(k) = sensitivity of the sensor connected to the A/D channel k in physical units per count, and
B(k) = Zero offset of the sensor connected to A/D channel k in counts.
The purpose of the calculation is to calculate the constants A(k) and B(k), ensure that the sensor functions properly and has a linear response. The constant A(k) also represents the digital resolution of the measurement. The calibrated sensors are presented in Appendix 7.
7.2 Decay Tests
Decay tests were conducted for the free-floating (unmoored) and moored FPSO model. Heave, pitch and roll tests were conducted for the free-floating FPSO. The same tests plus surge decay were conducted on the moored FPSO. These experiments were performed prior to the start of the individual runs and were necessary to ensure that the respective periods for the FPSO vessel (i.e. roll, pitch, and surge) were realistic. A discussion of all the decay test results is presented in section 10.1 while the individual results are contained in Appendix 8.
7.3 Verification Tests
Verification tests were conducted on FPSO model to ensure that the motions with the simplified mooring configuration setup were representative of an FPSO. The FPSO model was run through the five environments specified in section 5.1. With the waves, the aim was to match the wave height and period. Wind was matched for a specified mean speed at a nominal distance of 7.70m model scale (i.e. distance between the wind machine and the turret centre).
The verification experiments were conducted for the FPSO in its test configuration prior to the start of the evacuation system assessment. Results of the individual tests are contained in Appendix 8.
8.0 TEST PROGRAM
The experiment program consisted of nine series of tests. The basic twin falls davit launched system was used in the first six series; a flexible boom was used in the last three series. All of the launch configurations started with the TEMPSC parallel to the platform. The only variable in the test program was the environmental condition (i.e. waves & wind). Table 8.1 shows the nominal description of the environmental conditions, from calm water to fresh gale, and the planned and actual (full scale) mean wave heights and wind speed.
As one of the aims of the tests was to evaluate the use of model tests and experimental methods themselves, each type of test was to be repeated 20 times. In actuality this number varied from 14 to 20. This provides an indication of the variability of the tests, which may help interpret the importance of particular random variables, such as the splashdown point on the wave (e.g. crest, trough).
Table 8.1 - Test program. SERIES
LABEL
NUMBER OF RUNS
BEAUFORT
DESCRIPTION MEAN WAVE (m/s)
MEAN WIND (m/s) Plan Actual Plan Actual Plan Actual
CONVENTIONAL TWIN FALLS DAVIT CONFIGURATION
400 20 14 (0) Calm water 0.00 0.00 0.00 0.00 500 20 20 (4) Moderate breeze 1.01 0.88 7.2 6.27 525 20 19 (5) Fresh breeze 2.10 2.05 9.77 8.11 550 20 15 (6) Strong breeze 3.96 3.90 12.6 10.13 600 20 14 (7) Moderate gale 6.71 6.16 15.43 12.20 625 20 14 (8) Fresh gale 11.28 10.76 19.03 15.34
FLEXIBLE BOOM CONFIGURATION
700 20 20 (0) Calm water 0.00 0.00 0.00 0.00 725 20 19 (5) Fresh breeze 2.10 1.93 9.77 8.32 800 20 19 (8) Fresh gale 11.28 10.84 19.03 16.15
8.1 Test Methodology
The methodology used throughout the nine different tests series can be summarized as follows:
Verification Tests
•
Ballast the FPSO to the required load condition•
Perform heave, pitch and roll decay experiments on the free-floating FPSO•
Attach the FPSO to the horizontal mooring•
Perform surge, heave, pitch and roll decay experiments on the moored FPSO•
Perform a check run, followed by the activation of the current.•
Start the data acquisition system followed by the wavemakers and the wind machine. Activate the video recording system. Run wind and waves continuously for 2-3 minutes.•
Stop the data acquisition, the waves, the wind and the video recording system. Offshore Evacuation System TestsThese experiments were conducted after the verification tests, which meant that the FPSO load condition was set and the only variant was environment, and the TEMPSC deployment system.
•
The moored and tethered FPSO was set according to the test matrix.•
The davit twin fall lines were winched-up to the bulwark deck level•
The TEMPSC was attached to the davit twin-falls. For the experiments with the flexible boom the tagline was attached to the TEMPSC flexible boom hook.•
The TEMPSC was winched-up to the proper launching height. This was accomplished by installing a limit switch that cut power to the winch when it was contacted by the TEMPSC.•
The member of the project team in charge of the TEMPSC setup, moved away from the test area to the north side of the basin•
The data acquisition was started, followed by the wavemakers, the video and the wind machine. After approximately 10-15 wave cycles passed the FPSO the command to start deployment was given. The basin operator tried to keep deployments as random as possible.•
After the signal was received, the deployment started. Half way between the TEMPSC launching rest position and the water surface the TEMPSC propulsion system was started remotely.•
After splashdown the davit releases were activated. For experiments using the flexible boom, the TEMPSC hook safety open and after tagline release the TEMPSC was sailed away from the FPSO. The rudder control was not activated during the TEMPSC sail away to the safe zone.•
The wavemakers, video and wind were stopped and the run considered terminated. At this time the TEMPSC was manoeuvred back to the FPSO for pickup.•
After a few minutes the members of the project team started preparation for the next run. The time between test runs was set to 10 minutes.Successful runs were defined as those for which a release of both davit-lines and flexible boom tagline released and the TEMPSC sailed away from the FPSO. Deployments were such that splashdown occurred on different portions of the wave, i.e. wave trough, crest, up and down slope.
8.2 Test Matrix
The test program was conducted as per plan with last minute modifications as the tests proceeded. The tables below detail the tests conducted for the verification test series and the offshore evacuation systems test series.
The verification tests series was conducted on FPSO model to ensure that the motions with the simplified mooring configuration setup were representative of similar hull forms on a mooring. The experiments took place prior to the start of the evacuation system assessment. The test matrix is presented in Table 8.2 below: Table 8.2 – Verification Tests Matrix
FPSO WAVE CONDITION
Condition Test Name H(m) T (s) Direction (deg.) BL T913_300_001 1.10 5.60 200 BL T913_301_001 2.10 7.70 200 BL T913_302_001 3.96 9.90 200 BL T913_303_001 6.71 12.10 200 BL T913_304_001 11.28 14.90 200
The test matrix for the evacuation system assessment was broken down into two major components. The first consisted of six test series for the basic twin falls davit launched system while the second consisted of three test series for the flexible boom. All of the launch configurations started with the TEMPSC parallel to the platform and the only variable was the environmental condition. Table 8.3 below presents the test matrix:
Table 8.3 – Offshore Evacuation System Test Matrix
FPSO TEMPSC SYSTEM WAVE CONDITION WIND DESCRIPTION Condition Condition H(m) T
(s) Veloc. (m/s)
Series Number & Name
No. Tests
BL, I, B20 W, P Davit 0.00 0.00 0.00 400, Calm Water 20
BL, I, B20 W, P Davit 1.01 5.60 7.20 500, Moderate Breeze 20
BL, I, B20 W, P Davit 2.10 7.70 9.77 525, Fresh Breeze 20
BL, I, B20 W, P Davit 3.96 9.90 12.60 550, Strong Breeze 20
BL, I, B20 W, P Davit 6.71 12.1 15.43 600, Moderate Gale 20
BL, I, B20 W, P Davit 11.28 14.9 19.03 625, Fresh Gale 20
BL, I, B20 W, P Boom 0.00 0.00 0.00 700, Calm Water 20
BL, I, B20 W, P Boom 2.10 7.70 9.77 725, Fresh Breeze 20
BL, I, B20 W, P Boom 11.28 14.9 19.03 800, Fresh Gale 20 Definitions:
BL – Ballast Load, I – Intact
B20 – 200 FPSO heading, P – TEMPSC power
W – Windward deployment
Davit – Twin falls davit system Boom – Flexible boom system
9.0 RESULTS
Results from each test were recorded in model scale units and checked at the time of testing. Some basic analysis was performed with statistics generated for each channel. These results were treated as preliminary results.
Results presented in this report have been translated to full-scale values for salt water and have been re-analyzed to provide event statistics for the FPSO motions, the TEMPSC deployment, falls and tagline release. Results of the verification experiments in addition to being translated to salt water and full-scale values were also re-analyzed to provide both detailed statistical results and response amplitude operators (RAO). The RAO’s were obtained from the double amplitude of motion divided by the wave height.
Detailed results are presented in Appendix 9 for individual experiments. The individual tests contain the FPSO motions, TEMPSC deployment, falls and tagline release event statistics followed by detailed statistical and RAO results for the verification experiments. Throughout this Appendix tables are presented before figures.
9.1 Data Analysis and Techniques
The following section describes the techniques used to analyze the test data. In some cases packaged software was used, while in others, task specific software
9.1.1 Statistical Analysis
For each measured and calculated time series the following parameters are calculated and output:
• Mean value of the time series:
∑
= = N i i X N x 1 1 • Minimum value • Maximum value • Standard Deviation:
∑
= − − = N i i x X N 1 2 1 1 ) ( σ • Variance: σ2.where: N is the total number of samples in the time series, XI is a discrete sample of the time series,
9.1.2 Zero-Crossing Analysis
A zero-crossing analysis is performed on the time series data, using a GEDAP program, “ZCA”. The software checks the time spacing of the signal to ensure that the sampling rate is high enough to accurate perform zero crossing analysis. The software is designed primarily for wave elevation records but it may be used to analyze other types of data such motions and forces. The ZCA performs both zero up and down-crossings and calculates parameters that are defined for each individual cycle in the record as well as parameters that apply to the entire record. 9.1.3 Response Amplitude Operator
The FPSO motions are presented as Response Amplitude Operators (RAO’s) for the six-degrees-of-freedom. The average values of surge, sway, heave, yaw, pitch and roll are divided by the average wave height and the results plotted as functions of the respective wave period. In the case of the linear motions the RAO has units of
m
m while for the angular motions the units are deg . m 9.1.4 Deployment Analysis
This type of analysis was performed during the test program to ensure that the instrumentation was working properly. Data products produced by this type of analysis constituted time series and statistical summaries for the entire launching window as well as the following intervals: (a) start of deployment to splashdown (b) splashdown to davit release/tagline release and (c) davit/tagline release to open sea. Environment data (i.e. wind and waves), FPSO motion data, electronic spring load, boom position, davit payout, TEMPSC release, lateral acceleration and X-Y-Z position data were analyzed. In the time series plots, the davit release along with the
tagline release were clearly marked and used to determine the local conditions at the time of release. FPSO motions, wave conditions, TEMPSC X-Y-Z were extracted at the above referred times. Synchronization between the acquisition systems, the shifting due to condition changes, etc. were handled during this analysis. Synchronization between the FPSO motion channels (data collected on the NEFF) and flexible boom load, davit payout, etc. (data collected on Telemetry) was accomplished through synchronization channels, one on each system. The synchronization between the TEMPSC X-Y-Z data and the other data was accomplished with software and manual manipulation.
9.1.5 Event Analysis
This type of analysis as the name indicates, was used to determine the sequence of events from lowering, splashdown and sail-away phases of individual experiments. The data is transformed from an earth-fixed coordinate system to a FPSO fixed coordinate system with its origin at the center of gravity of the TEMPSC canopy. Generally speaking the data is presented in plan view, view along the centerline of the TEMPSC and an outboard profile view. In each view the path taken by the TEMPSC is shown as an uneven line.
In the plan view, the outline of the TEMPSC is shown in its deployed position prior to lowering, which is used as a reference position. A pair of axes is centred at its midpoint. The waterline of the FPSO hull is also shown. Outboard of the FPSO the water surface is divided into 3 regions: a danger zone, an intermediate zone, and a safe zone. The danger zone is the area bounded by a 12.5m radius from the TEMPSC’s reference position and extending 6.6m outboard from the FPSO’s waterline. The region outside a 25m radius is the safe zone, and the circular band between the danger and safe zones is the intermediate zone.
These boundaries have been drawn somewhat arbitrarily but represent areas for which TEMPSC target drop point, davit falls release, flexible boom tagline release, sail away and others have measurable values.
This type of analysis allows for the estimation of TEMPSC lowering, sail track with respect to the FPSO and get-away time.
10.0 DISCUSSION AND RESULTS
This series of model experiments conducted on the evacuation systems installed on the FPSO, measured the motions of the FPSO, the X-Y-Z position of the TEMPSC and its relative position to the FPSO. In addition measurements of the TEMPSC lateral accelerations, flexible boom load, davit release, payout were made together with measurements of wave and wind.
Results from this test program are contained in the appendices and are grouped according to the following:
•
FPSO motion verification tests (series 300),•
TEMPSC deployment from FPSO in intact ballast load condition at 20o headingto the waves and 57o to the wind using the twin falls davit system (series 400, 500, 525, 550, 600,625)
•
TEMPSC deployment from FPSO in intact ballast load condition at 20o heading to the waves and 57o to the wind using the flexible boom deployment system (series 700, 725, 800)For each of the above test series the only variable was the environment. FPSO, TEMPSC and deployment conditions were kept constant. This section is structured to address general observations on the different types of experiments performed on the overall test program.
10.1 Systems Calibration (200 Series)
This series of tests were aimed at establishing the natural periods of the FPSO model in the free-floating and moored configurations. Inclining experiments for the FPSO in the ballast load condition as well as TEMPSC speed tests were also included in this series. The natural periods for the free-floating and moored FPSO are summarized in the table below.
Table 10.1 – Comparison of Natural Periods for Free-Floating and Moored FPSO FPSO Condition Natural Period (s) Free-Floating Moored BL Surge - 105.3 BL Heave 9.56 - BL Pitch 9.08 9.48 BL Roll 23.72 22.20
The only periods for which a comparison can be made are the pitch and roll. They show that by mooring the vessel the pitch period increases slightly and the roll period decreases. The slight increase in pitch is an unexpected result, however, the values are close and the possibility of error in the decay analysis is large given that the values are attained from one or two cycles. A comparison is also made in the table below between the values attained for the FPSO used in this test programs and other similar vessels.
Table 10.2 – Comparison of Natural Periods for FPSO and Similar Vessels Natural
Period (s)
Generic FPSO
FSO FPSO Tanker Surge 105.3 - 285.0 -
Heave 9.56 13.0 11.0 -
Pitch 9.08 12.0 10.0 8.3
The above values show that the generic FPSO used in the experiments had heave and pitch periods similar to other hulls, however, it is clear that the both the surge and roll periods are quite different. TEMPSC deployments are not expected to be adversely affected by the differences in either surge and roll natural periods.
The results of the inclining experiments for the generic FPSO used in the tests are compared to other GM values obtained from similar vessels. The results from the two FPSO’s are comparable but the results from both the FSO and tanker are quite different. This may be explained by the difference in the types of operation and also from the fact that many of the current FSO’s are in essence tankers converted. This is explains the similarity in the FSO and tanker metacentric height values.
Table 10.3 – Comparison of Metacentric Heights (GMT)
IMD FPSO
FSO FPSO Tanker
GMT (m) 3.34 8.84 3.90 7.83
The TEMPSC speed calibration consisted of multiple runs in calm water over a 20 m distance (model scale). Once the proper speed was attained, a set point was established on the controller for speed repeatability purposes.
The vertical and longitudinal centre of gravity of the TEMPSC used throughout the tests series was estimated by swinging it in air. The TEMPSC was attached to the swinging beam at the location of the longitudinal centre of gravity and weights adjusted until it balanced in the forward and aft directions. This started the process to determine the VCG. The restoring moment and mass moment of inertia of the beam, TEMPSC and weight were determined and the VCG estimated. The TEMPSC displacement was approximately 100% of loaded condition. In table 10.4 below the values attained by swinging are compared to values from comparable designs. The TEMPSC and swinging beam are shown in Appendix 3.
Table 10.4 – Comparison of Non-Dimensional Longitudinal and Vertical Centre of Gravity TEMPSC IMD TEMPSC RIT TEMPSC Conventional TEMPSC Freefall LCG 0.42 0.48 0.42 0.49 VCG 0.39 0.35 0.36 0.34
Note: IMD – Institute for Marine Dynamics RTI – Royal Institute of Technology 10.2 FPSO MOTION VERIFICATION (300 SERIES)
FPSO motion verification tests were aimed at comparing the results of the FPSO model hull design and its setup used in this set of experiments to results of similar
produced realistic FPSO motions in the different environmental conditions for the evaluation of the offshore evacuation system.
Tests were conducted in five environments made up of waves and wind and for the FPSO in its ballast loading condition and with heading to the waves of 20o and 57o to the wind. The environments corresponded to those proposed for the test series. The results from the small environment produce little or no motions on the FPSO. Also some of the data collected for this environment was very noisy which made analysis difficult and very unreliable. A decision was made to omit this environment from the comparisons. The fresh and strong breeze along with the moderate and fresh gales environments will be used for the comparison of the resulting motions of the FPSO in the current setup.
The parameters for comparison will be the FPSO linear and angular motions. The average values of all the motions together with the average wave height of the matched wave will be used in the comparison. The RAO’s were calculated by dividing the average of the motions by the average of the wave height.
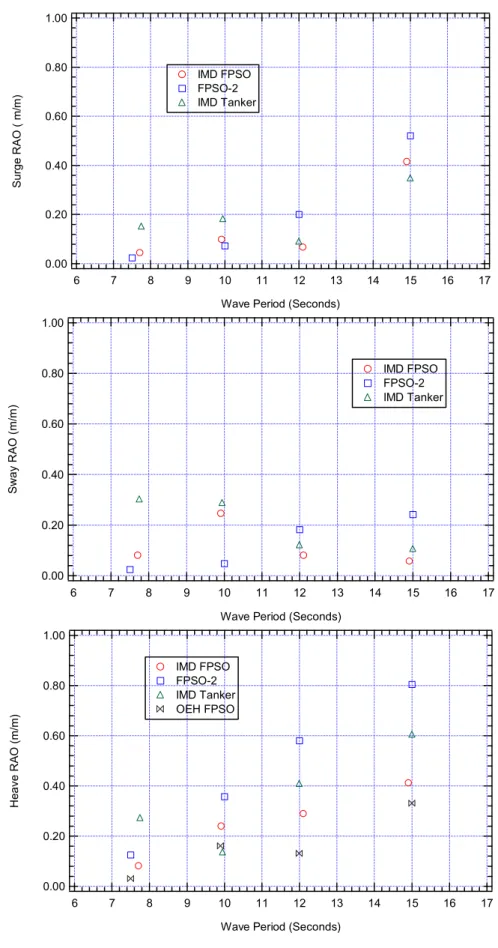
The comparison is made with results from the Offshore Engineering Handbook, OEH, FPSO-2 and IMD tanker. The results are tabulated below, (Table 10.5) and presented in Figures 10.1 and 10. 2. The OHE results are only for heave and pitch and there was no reference to the FPSO heading. The data for both the FPSO-2 and IMD tanker are for the same heading to the waves as the current tests but no reference is made of the wind direction. The comparison must therefore be made with the understanding that not all the parameters were the same, however, one can get a sense of the FPSO overall performance.
Table 10.5 – Response Amplitude Operators Comparison
ENVIRONMENT 1 RESPONSE AMPLITUDE OPERATOR
Vessel T (s) Surge (m/m) Sway (m/m) Heave (m/m) Yaw (deg/m) Pitch (deg/m) Roll (deg/m) FPSO 7.71 0.045 0.081 0.082 0.027 0.028 0.043 OEH FPSO 7.50 0.030 0.030 FPSO-2 7.50 0.024 0.024 0.125 0.024 0.060 0.054 IMD Tanker 7.75 0.152 0.303 0.273 0.042 0.026 0.048
ENVIRONMENT 2 RESPONSE AMPLITUDE OPERATOR
Vessel T (s) Surge (m/m) Sway (m/m) Heave (m/m) Yaw (deg/m) Pitch (deg/m) Roll (deg/m) FPSO 9.91 0.099 0.246 0.240 0.076 0.252 0.101 OEH FPSO 9.90 0.160 0.170 FPSO-2 10.0 0.073 0.048 0.357 0.050 0.120 0.107 IMD Tanker 9.95 0.182 0.288 0.136 0.048 0.324 0.133
ENVIRONMENT 3 RESPONSE AMPLITUDE OPERATOR
Vessel T (s) Surge (m/m) Sway (m/m) Heave (m/m) Yaw (deg/m) Pitch (deg/m) Roll (deg/m) FPSO 12.10 0.067 0.081 0.289 0.118 0.486 0.225 OEH FPSO 12.00 0.130 0.220 FPSO-2 12.00 0.20 0.182 0.580 0.170 0.430 0.134 IMD Tanker 12.00 0.091 0.121 0.409 0.164 0.618 0.333
ENVIRONMENT 4 RESPONSE AMPLITUDE OPERATOR
Vessel T (s) Surge (m/m) Sway (m/m) Heave (m/m) Yaw (deg/m) Pitch (deg/m) Roll (deg/m) FPSO 14.91 0.415 0.058 0.412 0.182 0.597 0.197 OEH FPSO 15.00 0.330 0.440 FPSO-2 15.00 0.521 0.242 0.804 0.206 0.600 0.161 IMD Tanker 15.00 0.348 0.106 0.606 0.267 0.647 0.204
1.00 0.80 0.60 0.40 0.20 0.00 Surge R A O ( m /m ) 17 16 15 14 13 12 11 10 9 8 7 6
Wave Period (Seconds) IMD FPSO FPSO-2 IMD Tanker 1.00 0.80 0.60 0.40 0.20 0.00 Sw a y R A O ( m /m ) 17 16 15 14 13 12 11 10 9 8 7 6
Wave Period (Seconds)
IMD FPSO FPSO-2 IMD Tanker 1.00 0.80 0.60 0.40 0.20 0.00 H eav e R A O ( m /m ) 17 16 15 14 13 12 11 10 9 8 7 6
Wave Period (Seconds) IMD FPSO
FPSO-2 IMD Tanker OEH FPSO
1.00 0.80 0.60 0.40 0.20 0.00 Y aw R A O (deg/ m) 17 16 15 14 13 12 11 10 9 8 7 6
Wave Period (Seconds) IMD FPSO FPSO-2 IMD Tanker 1.0 0.8 0.6 0.4 0.2 0.0 Pit ch R A O ( de g /m) 17 16 15 14 13 12 11 10 9 8 7 6
Wave Period (Seconds) IMD FPSO FPSO-2 IMD Tanker OEH FPSO 1.00 0.80 0.60 0.40 0.20 0.00 Rol l RA O (de g /m ) 17 16 15 14 13 12 11 10 9 8 7 6
Wave Period (Seconds) IMD FPSO FPSO-2 IMD Tanker
The results of the verification test indicate that the linear and angular motions of the FPSO are within the limits of similar hull forms. The IMD FPSO follows the same trends and in all the cases the recorded values are within the upper and lower limits presented for the other hull forms. This demonstrates that the FPSO hull form selected to conduct the offshore evacuation series of experiments is a valid platform representative of industry trends.
10.3 TEMPSC Deployment from FPSO - TWIN FALLS DAVIT SYSTEM
(SERIES 400, 500, 525, 550, 600,625)
TEMPSC deployment from the FPSO with the twin falls davit evacuation system was one of the main objectives of the test program. Data collected for the FPSO, TEMPSC, evacuation system and environment conditions will be used to evaluate the overall performance of the system. The different series refer to TEMPSC deployments in:
400 series -- Calm Water, 14 runs 500 series -- Moderate Breeze, 20 runs 525 series -- Fresh Breeze, 19 runs 550 series – Strong Breeze, 15 runs 600 series – Moderate Gale, 14 runs 625 series – Fresh Gale, 14 runs
The test program for the TEMPSC twin falls davit deployment has a total of 96 runs analyzed of a projected total of 120. The 24 runs that were not analyzed represent runs for which data quality was poor, data channels failed to work, or mechanical failures due to low battery power occur.
The individual runs data for FPSO motions, TEMPSC location, wind and waves together with the detailed video analysis are presented in Appendix 9
10.3.1 400 Series -- CALM WATER
TWIN FALLS DAVIT SYSTEM TEMPSC DEPLOYMENT
The 400 series – calm water -- deployments were performed for the FPSO in the intact condition. A total of 21 deployments were performed, however, the first seven were omitted from the presentation and analysis because the operator used excessive rudder angle. For these experiments no rudder angle data was collected so the radio controller was calibrated such that different notches on the controller corresponded to different rudder angles. This way the operator could consistently provide similar input to the rudder controller.
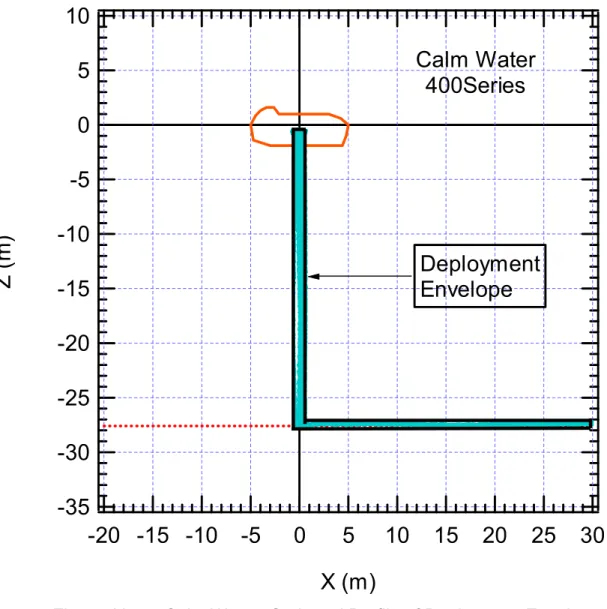
All of the tests were similar and can be described with reference to Figures 10.3 to 10.5, which illustrate the lowering, splashdown, and sail-away phases of a test in calm water. Figure 10.3 shows a plan view, Figure 10.4 is a view along the centreline of the TEMPSC, and the Figure 10.5 shows an outboard profile. In each
view the path of the TEMPSC is shown as an uneven line.
In the plan view, the outline of the TEMPSC is shown in its deployed position prior to lowering, which is used as a reference position. A pair of axes is centred at its midpoint. The waterline of the FPSO hull is also shown. Outboard of the FPSO the water surface is divided into 3 regions: a danger zone, an intermediate zone, and a safe zone. The danger zone is the area bounded by a 12.5m radius from the
TEMPSC's reference position and extending 6.6m outboard from the FPSO's waterline. The region outside a 25m radius is the safe zone, and the circular band between the danger and safe zones is the intermediate zone.
During the calm water deployments the path of the TEMPSC is simple: it goes straight down during lowering, as indicated in Figures 10.4 and 10.5; upon splashdown into the danger zone it sails straight ahead through the intermediate zone to safety, as illustrated in the Figure 10.3.
35 30 25 20 15 10 5 0 -5 -10 -15 -20 -25 -30 X ( m ) 40 35 30 25 20 15 10 5 0 -5 -10 -15 -20 -25 Y (m) Calm Water 400_008 Danger Zone Boundary Safe Zone Boundary FPSO