Publisher’s version / Version de l'éditeur:
Vous avez des questions? Nous pouvons vous aider. Pour communiquer directement avec un auteur, consultez la première page de la revue dans laquelle son article a été publié afin de trouver ses coordonnées. Si vous n’arrivez pas à les repérer, communiquez avec nous à [email protected].
Questions? Contact the NRC Publications Archive team at
[email protected]. If you wish to email the authors directly, please see the first page of the publication for their contact information.
https://publications-cnrc.canada.ca/fra/droits
L’accès à ce site Web et l’utilisation de son contenu sont assujettis aux conditions présentées dans le site LISEZ CES CONDITIONS ATTENTIVEMENT AVANT D’UTILISER CE SITE WEB.
3rd Structures in Fire Conference [Proceedings], pp. 1-11, 2004-05-01
READ THESE TERMS AND CONDITIONS CAREFULLY BEFORE USING THIS WEBSITE.
https://nrc-publications.canada.ca/eng/copyright
NRC Publications Archive Record / Notice des Archives des publications du CNRC : https://nrc-publications.canada.ca/eng/view/object/?id=1604a5dd-ce93-4fdd-9f99-899fd7305e36 https://publications-cnrc.canada.ca/fra/voir/objet/?id=1604a5dd-ce93-4fdd-9f99-899fd7305e36
Archives des publications du CNRC
This publication could be one of several versions: author’s original, accepted manuscript or the publisher’s version. / La version de cette publication peut être l’une des suivantes : la version prépublication de l’auteur, la version acceptée du manuscrit ou la version de l’éditeur.
Access and use of this website and the material on it are subject to the Terms and Conditions set forth at Temperature field modeling of the first Cardington test
Temperature field modeling of the first Cardington test
Alfawakhiri, F.; Kodur, V.K.R.; Frater, G.
NRCC-46898
A version of this document is published in / Une version de ce document se trouve dans : Structures in Fire, Proceedings of the 3rd International Workshop,
Ottawa, Ontario, May 10-11, 2004, pp. 1-11
TEMPERATURE FIELD MODELING OF THE
FIRST CARDINGTON TEST
Farid ALFAWAKHIRI
American Institute of Steel Construction, Chicago, IL, USA [email protected]
Venkatesh K. R. KODUR
National Research Council Canada, Ottawa, Ontario, Canada [email protected]
George FRATER
Canadian Steel Construction Council, Toronto, Ontario, Canada [email protected]
ABSTRACT
Results of heat transfer numerical simulations, using SAFIR program, for the composite floor beam of the first Cardington fire test in the eight-story steel-framed building are presented. For steel beam temperature predictions, the 2D mesh model was simplified by neglecting the presence of the steel deck and averaging the concrete slab thickness. This model was sufficient to yield a satisfactory match of predicted and measured temperatures in the steel beam. The predictions show that the unprotected bottom flange and web temperatures follow closely the temperature of the fire gas environment.
For temperature predictions in the ribbed concrete slab, a more detailed 2D model was generated with certain nodes to match the experimental measurement locations. Large number of SAFIR simulations was conducted to investigate the sensitivity of the output to various heat transfer parameters. The results confirm to the trends observed in earlier studies that used different software. The numerical predictions were compared with the experimental data, and the predicted temperatures in the concrete always exceeded temperatures measured in the test. Possible reasons for this over-conservativeness of predictions are briefly discussed.
INTRODUCTION
Building code requirements for structural fire protection have traditionally based on the prescription of fire resistance ratings achieved in standard tests (ASTM E119). While being somewhat convenient to the regulatory process, such an approach is grossly simplified because standard test ratings do not reflect the actual time that a real structural member would endure in a real fire. Columns, beams and floors tested in specific idealized standard test conditions behave differently when forming a part of a building frame in a realistic fire scenario.
Multi-story steel framed buildings have a good fire performance record in North America and all around the world. On the other hand, there have been numerous incidents of steel framed buildings surviving severe uncontrolled long-duration fires with compete burnout of contents on several floors (Dexter and Lu 2000). This superior performance has been attributed in part to the fact that typical natural fire characteristics and actual gravity load intensities are often less severe than in standard tests. It has also been well recognized that continuity and redundancy of steel frames provide multiple alternative load paths in the heated structure to maintain its stability (Gewain and Troup 2001). Such redundant behavior is especially notable in steel framed buildings with composite reinforced concrete floor slabs. Recent six large-scale fire tests conducted in Cardington, UK, in a steel framed building with completely unprotected steel beams and steel floor units clearly demonstrated that composite steel concrete floors can survive complete burnout of office occupancy contents without any sprayed fire proofing (Behaviour 1999). No collapse occurred in any of the tests despite relatively large deflections of beams and floor slabs.
Following these tests numerous research initiatives in many parts of the world are underway to analyze the extensive amount of generated experimental data. These studies has already brought a better understanding of the observed phenomena that will lead to more rational fire resistance design practices (Wang and Kodur 2000). Under one such initiative a numerical analysis was carried out as part of a "collaborative steel fellowship project" between the National Research Council Canada and the Canadian Steel Construction Council. Results of heat transfer numerical simulations of the composite floor beam of the first Cardington fire test on an eight-story steel-framed building are presented in this paper.
SAFIR PROGRAM
SAFIR is a special-purpose finite element program (Franssen et al, 2000) for thermal and structural analysis of building elements and frames exposed to fire. Recently added pre- and post-processors make the program more efficient and user-friendly. SAFIR accommodates several element types and material models for various idealizations and calculation procedures. The thermal analysis generates the temperature field in construction elements. The eventual presence of insulating materials, moisture content and temperature-dependent thermal properties can be considered in the analysis. Standard or user-defined natural fire exposure can be specified. The temperature field from the thermal analysis is then used as input for the structural analysis stage, where the mechanical behavior of the heated structure is simulated. Thermal strains and large displacements are considered in the structural analysis. Various stress-strain
relationships, implicitly accounting for thermal creep, are built into the program. SAFIR is a useful research tool to investigate the behavior of heated structures and conduct relevant parametric studies. The program has been validated and used in several case studies carried out in the past (Nwosu and Kodur 1998).
THE FIRST CARDINGTON TEST
An analytical study is currently underway at NRC to process the experimental data from Cardington tests and conduct retrospective numerical simulations of these tests using SAFIR program. The overall approach taken is to use several modeling techniques and compare the predicted temperatures, deflections and strains with measured values. Outcome of sensitivity to various input parameters and material models is also studied in the process. At this stage the study is focusing on the thermal and structural simulations of the first Cardington test. This “Retrained Beam” test was carried out by heating an 8×3 m portion of a composite steel concrete floor along the supporting steel beam spanning 9 meters (Kirby 1998). Although the steel beam and the surrounding steel deck were left completely unprotected, being exposed to furnace temperatures approaching 900°C, the floor maintained its stability and integrity for the duration of the test and beyond. The mid-span deflection of the beam reached the maximum of 232 mm during the test and recovered to 113 mm once the beam cooled back to ambient temperature.
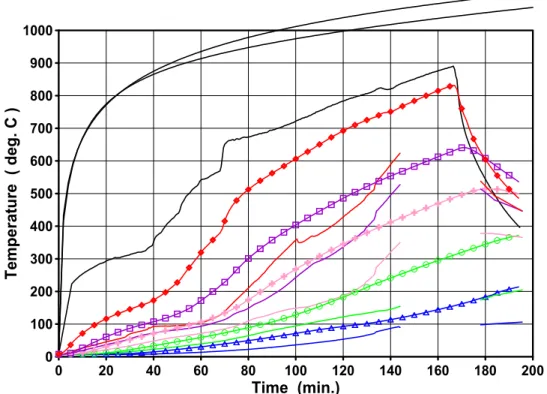
Numerous locations in the test setup were instrumented with thermocouples to obtain an accurate record of temperatures in the furnace, steel beam and the concrete slab. The records indicate insignificant scatter in the measured furnace and steel beam temperatures. Figure 2 illustrates the average temperature histories in the furnace, top flange (TF) and bottom flange (BF) of the beam.
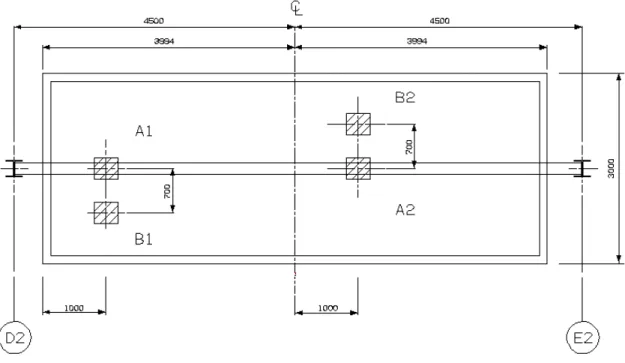
The thermocouple measurement points across the thickness of the ribbed concrete slab are shown in Figure 4. Temperatures measurements in the concrete slab were conducted at 4 sections, as shown in Figure 5. However, only records from sections B1 and B2 were used for the purposes of this study – Figures 6 and 7 illustrate the relevant average temperature histories for thermocouple points through the depth of the flute and the rib, respectively. It should be noted that the scatter of individual temperature histories for comparable measurement points was more pronounced in the flute than in the rib. Therefore, it was judged that rib temperature histories from Figure 7 were the most suitable for comparison with numerical simulations. NUMERICAL SIMULATIONS
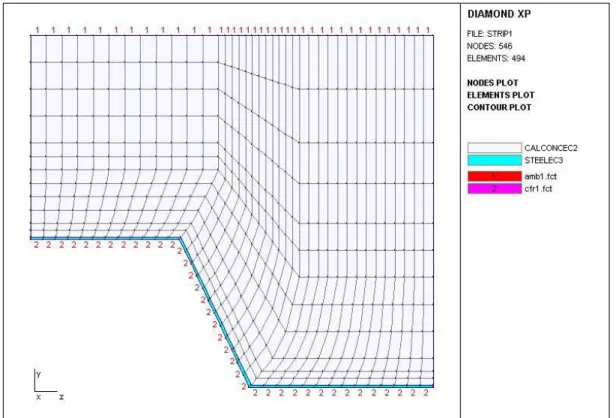
For steel beam temperature predictions, the 2D mesh model was simplified by neglecting the presence of the steel deck and by averaging the concrete slab thickness to 100 mm, as shown in Figure 1. This model was sufficiently accurate to yield a satisfactory match of predicted and measured temperatures in the steel beam, as shown in Figure 2. As it could be expected, unprotected bottom flange and web temperatures closely follow the temperature of the fire gas environment. The top flange temperature is somewhat lower (by about 100ºC) due to the “cooling” effect of the concrete slab. The simulated temperature histories in Figure 2 were generated with EC3 thermal steel properties, EC2 normal weight concrete thermal properties, effective emissivity coefficient of 0.8 and the convection coefficient of 25 W/m2K for
fire-exposed surfaces. For the unfire-exposed side of the concrete slab in this simulation, the emissivity coefficient was 0.6 and the convection coefficient was 5 W/m2K. Other simulations with different values of thermal parameters and properties indicated that the temperature output for exposed steel beam was not very sensitive to moderate deviations from the common values above.
For temperature predictions in the ribbed concrete slab, the 2D model shown in Figure 3 was generated. Certain mesh nodes (comparative nodes) match the points of temperature measurements in the ribbed slab (Figure 4). Again, large number of simulations was conducted to investigate the sensitivity of the temperature output to thermal parameters and concrete thermal properties. Figure 8 illustrates the typical isotherm zones in the output of SAFIR simulations. In all simulations the experimental temperatures at the bottom of the slab were significantly lower than those generated by heat transfer simulation.
As an example, Figures 9 illustrates the output for slab rib temperatures based on the common thermal parameters and properties listed above and 4 % moisture content in the concrete. This simulation over-estimates the temperatures at all comparative nodes. Where the moisture content is increased to 12 %, as shown in Figure 10, good agreement of predicted and measured temperatures is observed only at the unexposed top surface of the slab. However, for other comparative nodes close to the fire, the predicted temperatures still exceed measured temperatures.
As another example, Figure 11 illustrates the output of simulations using concrete properties suggested by Lamont et al (2001) for lightweight concrete – density 1850 kg/m3, thermal conductivity 0.7 W/m K, specific heat 700 J/kg K, moisture content 5%. In this simulation, as suggested by Lamont et al, the effective emissivity coefficients of 0.7 and 0.6 were used for the fire-exposed and ambient sides, respectively; the convection coefficients were of 15 W/m2K for fire-exposed surfaces and 10 W/m2K on the unexposed side. Again, except for the unexposed surface point, all predicted temperatures exceed the measured temperatures.
DISCUSSION
The probable reasons to explain higher predicted temperatures are:
• The steel deck separates from the concrete slab creating a cavity that slows heat transfer. Spalling concrete particles could further fill this cavity forming an effective insulating layer.
• The model assumes uniform moisture content throughout the concrete slab. It is likely that the moisture content s higher at the bottom of the slab, because the steel deck essentially seals the concrete surface slowing the drying process.
More trivial probable causes for low experimental temperatures could also be inaccurate position of the thermocouples and thicker than specified concrete slab.
SUMMARY AND CONCLUSIONS
The paper demonstrates the application of SAFIR computer program to temperature field modeling of composite steel/concrete floors exposed to fire.
Exposed steel beam temperatures are predicted very accurately, and these predictions are not very sensitive to the choice of thermal heat transfer parameters or material thermal properties. The use of common heat transfer parameters and EC2 thermal properties for concrete results in conservative predictions of temperatures in the slab. Traditional heat transfer simulations cannot explain the very low concrete temperatures at the bottom of the slab in this test. Possible high moisture content at the bottom of the slab or other phenomena could have been responsible for the slow development of temperatures in the slab.
REFERENCES
ASTM (1995). “Standard test methods for fire tests of building construction and materials”, E119-95a, West Conshohochen, PA.
The behaviour of multi-storey steel framed buildings in fire (1999), British Steel Plc, Swinden Technology Center, Rotherham, UK.
Dexter, R. J., and Lu, L. (2000). “The effects of a severe fire on the steel frame of an office building”, Proceedings of the North American Steel Construction Conference, Las Vegas, NV, May, American Institute of Steel Construction, Chicago, IL.
Gewain, R. G., and Troup E. W. J. (2001), “Restrained fire resistance ratings in structural steel buildings”, Engineering Journal, 2nd Quarter, 78-89.
Franssen, J. M., Kodur, V.K.R., and Mason, J. (2000). User’s manual for SAFIR2001: a computer program for analysis of structures submitted to the fire, University of Liege, Belgium.
Kirby, B. R. (1998). “The behaviour of a multi-storey steel framed building subjected to fire attack, Experimental data”, Swinden Technology Center, British Steel plc., UK.
Nwosu, D., and Kodur, V. K. R. (1998). “Behaviour of steel frames under fire conditions”, Canadian Journal of Civil Engineering, 26, 156-167.
Sanad, A. M., Rotter, J. M., Usmani, A. S., and O’Connor, M. A. (2000). “Composite beams in large buildings under fire – numerical modelling and structural behaviour”, Fire Safety Journal, 35, 165-188.
Wang, Y. C., and Kodur, V. K. R. (2000). “Research toward use of unprotected steel structures”, Journal of Structural Engineering, 126(12), 1442-1450.
Lamont, S., Usmani, A. S., and Drysdale, D. D. (2001). “Heat Transfer Analysis of Composite Slab in the Cardington Frame Fire Tests”, Fire Safety Journal, 36, 815-839.
Figure 1. The simplified mesh model for temperature predictions in the steel beam. 0 20 40 60 80 100 120 140 160 180 200 Time (min.) 0 100 200 300 400 500 600 700 800 900 1000 Temp erature ( deg. C )
ISO 834 ASTM E-119
Furnace
TF BF
Figure 3. The mesh model for the ribbed concrete slab on fluted steel deck. CS3 CS4 C13 C14 C15 R6=C16 C17 C18 MD11 MD12 R5 CONCRETE
Figure 5. Temperature measurement locations B1 & B2 0 20 40 60 80 100 120 140 160 180 200 Time (min.) 0 100 200 300 400 500 600 700 800 900 1000 Temp erature ( deg. C ) Unexposed surface 20 mm 40 mm 55 mm Furnace
ISO 834 ASTM E-119
75 mm
0 20 40 60 80 100 120 140 160 180 200 Time (min.) 0 100 200 300 400 500 600 700 800 900 1000 T e mperature ( deg. C ) Unexposed surface 90 mm 110 mm 55 mm Furnace
ISO 834 ASTM E-119
130 mm
Figure 7. Temperatures measured in the slab rib (average B1 & B2)
0 20 40 60 80 100 120 140 160 180 200 Time (min.) 0 100 200 300 400 500 600 700 800 900 1000 Temp erature ( deg. C )
Figure 9. Temperature predictions in the slab rib compared to measured temperatures (EC2 normal weight concrete properties, 4 % moisture content)
0 20 40 60 80 100 120 140 160 180 200 Time (min.) 0 100 200 300 400 500 600 700 800 900 1000 Temp erature ( deg. C )
Figure 10. Temperature predictions in the slab rib compared to measured temperatures (EC2 normal weight concrete properties, 12 % moisture content)
0 20 40 60 80 100 120 140 160 180 200 Time (min.) 0 100 200 300 400 500 600 700 800 900 1000 Temp erature ( deg. C )
Figure 11. Temperature predictions in the slab rib compared to measured temperatures, light weight concrete properties and heat transfer parameters suggested by Lamont et al (2001)