Characteristics of successful risk management in product design
The MIT Faculty has made this article openly available. Please share
how this access benefits you. Your story matters.
Citation
Olechowski, A., J. Oehmen, W. Seering, and M. Ben-Daya.
"Characteristics of successful risk management in product design."
Proceedings of the 12th International Design Conference – DESIGN
2012, pp. 269-278, Dubrovnik, Croatia. May 2012.
As Published
http://www.designsociety.org/publication/31994/
characteristics_of_successful_risk_management_in_product_design
Version
Author's final manuscript
Citable link
http://hdl.handle.net/1721.1/78918
Terms of Use
Creative Commons Attribution-Noncommercial-Share Alike 3.0
Final Manuscript
Characteristics of successful risk management in product design
A. Olechowski, J. Oehmen, W. Seering and M. Ben-Daya
This is the final manuscript of the paper published as: Olechowski, A., Oehmen, J., Seering, W.
and Ben-Daya, M.: Characteristics of successful risk management in product design. pp.
269-278. Proceedings of the 12th International Design Conference – DESIGN 2012, pp. 269-278,
Dubrovnik, Croatia. May 2012
Abstract: The paper reports results of one of the largest empirical studies to-date on the
impact of design risk management practices on product design success. Through a survey
of 224 practices, 38 (in 7 categories) where found to be statistically significant for at least 3
out of 4 performance metrics. The categories are: 1. Organizational Design Experience; 2.
Risk Management Personnel and Resources; 3. Tailoring and Integration of Risk
Management Process; 4. Risk-Based Decision Making; 5. Specific Mitigation Actions; 6.
Monitoring and Review; and 7. Other ISO Risk Management Principles.
Keywords: risk management, product design, success factors
1. The importance of risk management in product design
Risks have been shown to have a very significant impact on design of complex systems. Various root causes are discussed in the literature. For large US defense-related development programs, technology risks have been identified as one major root cause for cost overruns of 45% and schedule overruns of 22 months [GAO, 2009, GAO, 2010]. The cost overrun for transportation infrastructure is put at an average of 30%-50%, with stakeholder engagement (in particular changing requirements due to political reasons) cited as the main cause [Cantarelli et al., 2010]. In examples from the civil aerospace sector, risks in the development and production supply chain have been identified as main drivers of cost and schedule overruns [Tang and Zimmerman, 2009].
The sheer scale of the problem – a cost overrun in current US defense development of $300 billion alone – illustrates the importance of improving our current risk management practices. While there exists research on a number of specific risk management practices that will be discussed briefly in the next section, there is no clear understanding of what the key characteristics of successful risk management are. This paper reports findings of a survey among industry professionals that elicited the current state of the art in product design risk management.
Of the 224 risk management variables of the survey, 38 survey variables were identified which showed a statistically significant difference between low and high performing projects in at least three of the four dimensions of performance. We summarize and discuss these variables in seven categories: I. Organizational Design Experience; II. Risk Management Personnel and Resources; III. Tailoring and Integration of Risk Management Process; IV. Risk-Based Decision Making; V. Specific Mitigation Actions; VI. Monitoring and Review; and VII. Other ISO Risk Management Principles. These results constitute the first large-scale empirical evaluation of the impact of specific risk management practices on product development success.
2. Context and literature review
2.1 Risk management processesFinal Manuscript
For the purpose of this paper, we define risk as the “effect of uncertainty on objectives” [ISO, 2009a]. There exists a significant literature base on specific risk management practices [see for example Oehmen et al., 2010 for an overview], focusing mostly on the identification and quantification of design-related risks.
There is also no scarcity of recommended risk management processes, with various organizations proposing overlapping process standards, for example NASA [Dezfuli et al., 2010], INCOSE [2007], the US Department of Defense [DoD, 2006] and the Project Management Institute [PMI, 2008].
Recently, the International Organization for Standardization (ISO) published the first risk management process that claims universal applicability with the ISO 31000 and accompanying documents [ISO, 2009a, 2009b, 2009c]. This standard is particularly noteworthy, as a common risk management framework would resolve many interface issues not only within core product design risk management activities, but especially with boundary-spanning activities to other business functions (e.g. supply chain management, marketing, production) and other levels of the hierarchy (e.g. project, business unit and corporate risk management). The authors have shown previously that the ISO 31000 is a useful framework to discuss product design risk management [Oehmen et al., 2010]. The content of the ISO 31000 is summarized in Table 1.
Table 1: Overview of ISO 31000 [ISO, 2009a]
Risk management principles Risk management process Implementation framework
Creates value
Integral part of organizational processes
Part of decision making
Explicitly addresses uncertainty
Systematic, structured and timely
Based on the best available information
Tailored
Takes human and cultural factors into account
Transparent and inclusive
Dynamic, iterative and responsive to change
Facilitates continual improvement and enhancement of the organization
Communication and consultation
Establishing the context
Risk identification
Risk analysis
Risk evaluation
Risk treatment
Monitoring and review
Mandate and commitment
Design of framework for managing risk
Implementing risk management
Monitoring and review of the framework
Continual improvement of the framework
2.2 Empirical risk management literature
While all of the risk management methods and process frameworks put forward by various organizations might make intuitive sense (or not), there is a significant lack of empirical testing of the actual success rates of various types of risk management or the application of different guiding principles. Among the few publications touching on this issue, an empirical study based on over 100 projects in various industries was reported in [Raz et al., 2002]. The study examined the extent of usage of some risk management practices such as risk identification, probabilistic risk analysis, planning for uncertainty, the difference in application across different types of projects, and their impact on various project success dimensions. Although a limited number of projects used any kind of risk management practices, projects using risk management better met time and budget goals. In [Mu et al., 2009], the authors propose a risk management framework for new product development. The framework was empirically tested using survey data from Chinese firms. The results show that risk management strategies aimed at technological, organizational, and marketing risk factors contribute both individually and interactively to the performance of new product development. The relationship between risk and success has been explored in information system (IS) development projects. In a survey of 86 IS project managers [Jiang and Klein, 2000] the relationship between risk and success is explored. Four IS success measures were found to relate to different risk factors. Using data collected from software projects developed in Korea, [Na et al., 2007] investigated the impacts
Final Manuscript
of specific risk management strategies and residual performance risk on objective performance measures such as cost and schedule overrun. The results show that cost and schedule overrun are positively associated with residual performance risk.
This paper makes a contribution to addressing the literature gap on evaluating the impact of risk management practices on program performance.
3. Survey design and methods for statistical analysis
3.1 Survey design and respondentsThe results reported in this paper are based on a survey that was administered to industry professionals involved in different aspects of large-scale design and development programs (see Table 2).
Table 2: Overview of survey respondents
Categorization of respondents Number valid responses Percentage (rounded) by industry sector 255 100% Defense 69 27% Government-sponsored aerospace 33 13% Commercial aerospace 29 11%
Oil, gas and process industry 18 7%
Other government-sponsored 18 7%
Utilities 13 5%
Other (below 5% each) 75 29%
by total program development and engineering budget 214 100%
Less than $1 million 39 18%
$1m - $10m 50 24%
$10 - $100m 52 24%
$100m - $1 billion 43 20%
More than $1 billion 30 14%
by product type 252 100%
Mechanical: Components, materials, assemblies 33 13%
Software 64 25%
Integrated electronics and software 34 14%
Integrated mechatronics (mechanical, electronics, software) 73 29%
Service (consulting, process development) 19 8%
Other (below 5% each) 29 12%
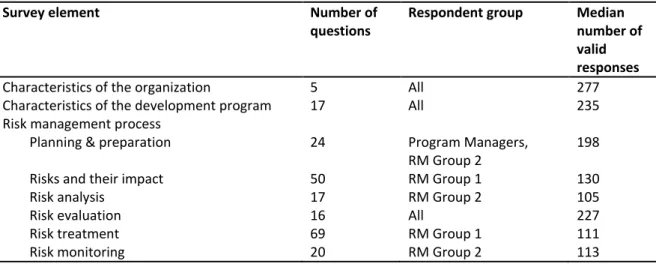
Table 3: Structure of the survey
Survey element Number of
questions
Respondent group Median number of valid responses
Characteristics of the organization 5 All 277
Characteristics of the development program 17 All 235
Risk management process
Planning & preparation 24 Program Managers,
RM Group 2
198
Risks and their impact 50 RM Group 1 130
Risk analysis 17 RM Group 2 105
Risk evaluation 16 All 227
Risk treatment 69 RM Group 1 111
Final Manuscript
Risk management performance 22 All 213
The survey was developed and tested over a period of six months with a focus group consisting of twelve individuals from three academic institutions, one risk management consultancy from the aerospace sector, and six companies from the aerospace and defense sector, all based in the US. The development of the survey focused on pre-filtering the questions as much as possible to only include risk management characteristics and practices, as well as risks and mitigation actions, that were agreed on as being “best practice” or of significant impact on the risk management process by general expert and practitioner consensus. The pertinent literature was taken into account to the best of our knowledge.
This resulted in a survey with a total of 240 questions in four main categories (see Table 3), 16 of which were not analysed for this paper. The total time needed to complete the survey was approximately 45-60 minutes. Two strategies were applied to maximize the number of respondents: The survey was distributed through the risk management organization of a number of large aerospace and defense companies as part of a benchmarking process. This way, 90 complete datasets of the survey were collected. To allow distribution to a wider circle of recipients via professional organizations and mailing lists, the survey was broken down into three sub-parts: Part 1 with questions relevant for general program managers (i.e. respondents not working in a dedicated risk management role), and parts 2 and 3 with questions relevant for respondents directly involved in risk management. Respondents were assigned to one of the survey parts based on their function in the development program. The respondents that were binned into the ‘risk manager’ category were randomly assigned to one of the two risk management parts, with a 50/50 distribution.
In total, 277 responses were recorded over a period of six months. Exact response rates are difficult to ascertain, as recipients were encouraged to forward the invitations to colleagues within their organization.
3.2 Statistical data analysis
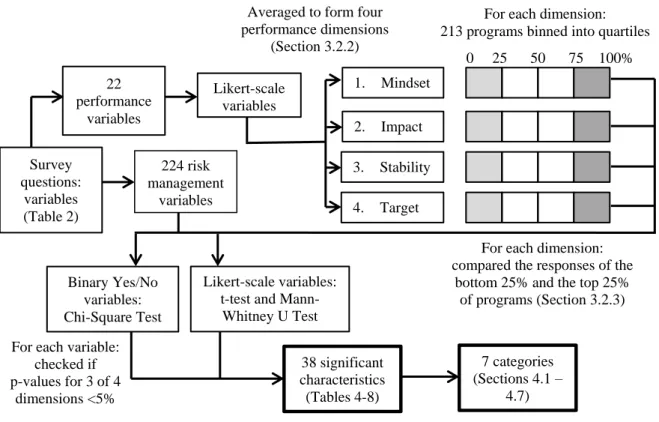
An overview of the data analysis process is presented below in Figure 1. To identify those characteristics that set successful and unsuccessful risk management apart, we binned all cases into top and bottom quartiles along four dimensions of risk management performance (last section of the survey, see Table 3). For each performance dimension, we identified those variables throughout the survey that were significantly different between the top and bottom set: For Likert-scaled variables, the mean and mean rank were analysed, for binary (yes/no) questions, a Chi-Square analysis was performed. If a variable showed a significant difference in at least three of the four dimensions, it was included as a characteristic of successful risk management in Tables 4 - 8.
Final Manuscript
Figure 1: Overview of data analysis process
3.2.1 Binning of cases in top and bottom performing quartiles for four success dimensions
All survey respondents answered a series of 22 Likert questions (scaled 1-5) about risk management performance. These outcome questions were grouped into four performance categories and averaged, resulting in four corresponding performance dimensions. A non-answered question was left out of the average (not treated as a zero).
The four performance dimensions are:
1. Acceptance of the risk management process in the organization (Mindset): e.g. program/project managers support risk management activities. 2. Perceived influence of risk management on program success (Impact):
e.g. satisfaction of organization with risk management system. 3. Stability of the development program (Stability):
e.g. we spent little time on “firefighting” i.e. continuously chasing and fixing problems. 4. Overall target achievement (Target) of the development program:
e.g. cost, technical performance, schedule and overall customer satisfaction targets.
These four dimensions are ordered in decreasing degree of “proximity” to risk management execution and process. In other words, the first dimension (Acceptance of the risk management process in the organization) is most dependent on risk management while the last dimension (Overall target achievement) is dependent on a larger number of factors, the risk management aspects captured in the survey being only part of them.
For each of the four dimensions, the 213 valid cases were binned into quartiles. Those programs in the highest quartile (top 25%) were then grouped as the high performing programs, and those in the lowest quartile (bottom 25%) were taken as the low performing projects. This created two samples - high performing and low performing programs - for each outcome dimension. The two middle quartiles (between 25% and 75%) were not used in this analysis.
We then identified which of the 224 risk management variables were significantly different between high and low performing programs.
1. Mindset 2. Impact
4. Target 3. Stability
0 25 50 75 100% For each dimension: 213 programs binned into quartiles
Likert-scale variables: t-test and
Mann-Whitney U Test Binary Yes/No
variables: Chi-Square Test
Averaged to form four performance dimensions (Section 3.2.2) Likert-scale variables 38 significant characteristics (Tables 4-8) For each variable:
checked if p-values for 3 of 4 dimensions <5% 7 categories (Sections 4.1 – 4.7) 22 performance variables Survey questions: variables (Table 2) 224 risk management variables
For each dimension: compared the responses of the
bottom 25% and the top 25% of programs (Section 3.2.3)
Final Manuscript
3.2.2 Identification of significant risk management practices
Two different types of survey questions were analysed; 110 Likert questions (on a 5-point scale) and 114 Yes/No questions. The Pearson Chi-square test was used to compare frequencies of Yes/No between the high performing and low performing samples. The test assumes that the expected value for each frequency is at least 5, which was met for all cases in this analysis.
The Likert-scale questions were analysed with both the t-test (considering the Likert-scale an interval scale) and Mann-Whitney U Test (treating the Likert-scale as an ordinal scale).
For the t-test, the Likert-scale questions were analysed using the two independent samples t-test. It tests whether the means of two normally distributed groups of interval data are equal. Additionally the Levene’s test for Equality of variances was performed in order to determine whether the variances of the two samples were equal, and thus which 2-tailed significance statistic was suitable. An alternative to the t-test is the non-parametric Mann-Whitney U test which treats the dependent variables as ordinal data. In this test, the mean rank of the data is compared between the two groups. Some statisticians prefer this method of analysis with Likert-scales since the 5-point scale results are discrete and not truly normally distributed. However, the t-test is typically appropriate for samples so long as their distribution is generally mound-shaped, as this Likert-scale data is.
To avoid misinterpretation of the statistical results, we performed both tests and compare their results.
4. Results
38 variables were identified as significant given a 2-sided p-value smaller than or equal to 5% in at least three of the four dimensions of performance. Tables 4 - 8 below present the difference of means for the 36 significant variables in all four performance dimensions, based on the t-test results. As characteristic 11 and 25 are Yes/No questions and thus analysed with the Chi-square test, no difference of means can be reported in Tables 5 and 6.
The t-test and Mann-Whitney U test results differed for only three variables (characteristics 1, 2 and 24); these differences were found to be statistically significant by the Mann-Whitney U test but not the t-test. For completeness these variables have been included in the list of significant variables. The significant variables were re-grouped in seven new categories: I. Organizational Design Experience, II. Risk Management Personnel and Resources, III. Tailoring and Integration of RM Process, IV. Risk-Based Decision Making, V. Specific Mitigation Actions, VI. Monitoring and Review and VII. Remaining ISO Risk Management Principles.
The survey included questions on the 11 ISO 31000 risk management principles (see Table 1). To denote them in the following tables, the suffix “(ISO)” was added to their short title. Where appropriate, these principles were grouped within the first 6 categories, and those that did not fit were summarized in category VII.
4.1 Organizational Design Experience (I)
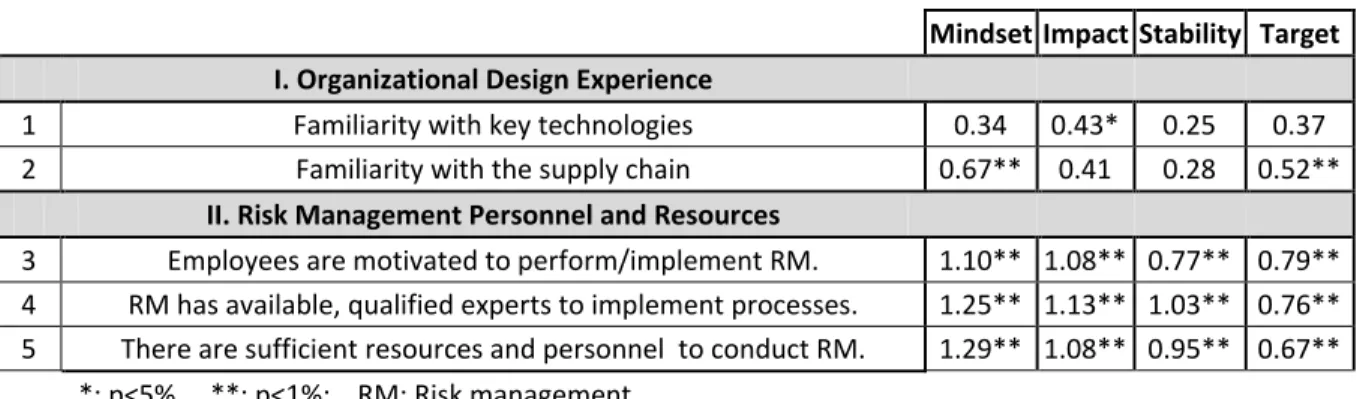
Organizational Design Experience (I) (Table 4) reflects the prior experience of the design team in the subject area and the availability of experts in the organization. The survey asked about experience/familiarity and complexity in five areas: technology, customer, company-internal process and skills, supply chain and market. Of those, only these two characteristics (experience with key technologies and experience with supply chain) were found to be significantly different between the high and low-performing programs. Overall, the differences of means in this category are smaller than in other categories.
Final Manuscript
Table 4: Significant differences of means: Experience (I) and Resources (II)
Mindset Impact Stability Target
I. Organizational Design Experience
1 Familiarity with key technologies 0.34 0.43* 0.25 0.37
2 Familiarity with the supply chain 0.67** 0.41 0.28 0.52**
II. Risk Management Personnel and Resources 3 Employees are motivated to perform/implement RM. 1.10** 1.08** 0.77** 0.79** 4 RM has available, qualified experts to implement processes. 1.25** 1.13** 1.03** 0.76** 5 There are sufficient resources and personnel to conduct RM. 1.29** 1.08** 0.95** 0.67**
*: p<5% , **: p<1%; RM: Risk management
4.2 Risk Management Personnel and Resources (II)
Risk Management Personnel and Resources (II) (Table 4) includes those characteristics related to the risk management function’s access to resources and qualified personnel. P-values smaller than 1% were calculated across all four dimensions for all of the characteristics in this category, suggesting a strong difference between the high and low performing projects. The differences of means generally decrease from the Mindset dimension to the Target dimension.
4.3 Tailoring and Integration of the Risk Management Process (III)
Tailoring and Integration of the Risk Management Process (III) (Table 5) is a collection of the characteristics related to tailoring (aligning the risk management process to the specific organization and program/project) and integrating (risk management is not a stand-alone or modular process, but a part of all design activities and processes, levels of the organization and functions). Characteristics 6, 9, 12 and 13 show p-values smaller than 1% across all dimensions. Characteristic 12 (RM is transparent and inclusive towards all stakeholders) shows the largest difference in means in the Target dimension of any characteristic analysed (1.03 for a 5-point Likert-scale question).
Table 5: Significant differences of means: Tailoring and Integration (III)
Mindset Impact Stability Target
III. Tailoring and Integration of the Risk Management Process 6 RM is tailored to specific program/project needs. (ISO) 1.14** 0.90** 0.95** 0.59** 7
We coordinate and integrate RM activities of different functions and across the hierarchy.
1.08** 1.00** 0.81** 0.31 8 RM is integrated with higher-level risk management process. 1.03** 0.78** 0.67* 0.55* 9
The RM process is effectively integrated with other project/program management processes.
1.32** 1.07** 0.94** 0.80** 10 RM teams are cross-functional and cross-organizational. 1.16** 0.94** 0.56* 0.46 11 Risks and RM activities are communicated to stakeholders. * ** ** 12 RM is transparent and inclusive towards all stakeholders. (ISO) 1.34** 1.34** 0.96** 1.03** 13 RM is an integral part of all organizational processes. (ISO) 0.96** 1.10** 0.72** 0.58**
*: p<5% , **: p<1%; RM: Risk management
4.4 Risk-Based Decision Making (IV)
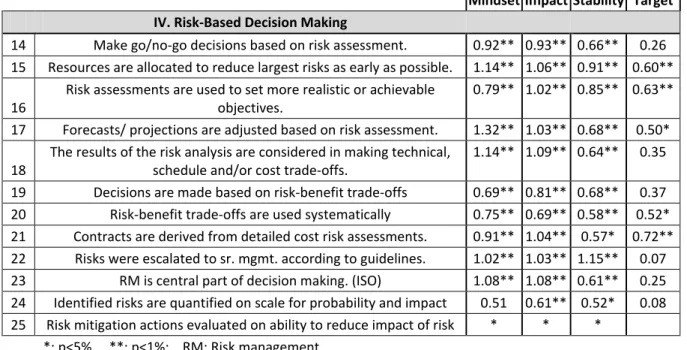
Risk-Based Decision Making (IV) (Table 6) represents the way in which design and development decisions are informed and influenced by risk management. All characteristics but the last two in this category have a p-value smaller than 1% for the Mindset and Impact dimensions. Characteristic 22
Final Manuscript
has a p-value smaller than 1% and relatively large difference of means for the first three dimensions, but did not show a statistically significant difference of means for the Target dimension.
Table 6: Significant differences of means: Decision Making (IV)
Mindset Impact Stability Target
IV. Risk-Based Decision Making
14 Make go/no-go decisions based on risk assessment. 0.92** 0.93** 0.66** 0.26 15 Resources are allocated to reduce largest risks as early as possible. 1.14** 1.06** 0.91** 0.60** 16
Risk assessments are used to set more realistic or achievable objectives.
0.79** 1.02** 0.85** 0.63** 17 Forecasts/ projections are adjusted based on risk assessment. 1.32** 1.03** 0.68** 0.50* 18
The results of the risk analysis are considered in making technical, schedule and/or cost trade-offs.
1.14** 1.09** 0.64** 0.35 19 Decisions are made based on risk-benefit trade-offs 0.69** 0.81** 0.68** 0.37 20 Risk-benefit trade-offs are used systematically 0.75** 0.69** 0.58** 0.52* 21 Contracts are derived from detailed cost risk assessments. 0.91** 1.04** 0.57* 0.72** 22 Risks were escalated to sr. mgmt. according to guidelines. 1.02** 1.03** 1.15** 0.07 23 RM is central part of decision making. (ISO) 1.08** 1.08** 0.61** 0.25 24 Identified risks are quantified on scale for probability and impact 0.51 0.61** 0.52* 0.08 25 Risk mitigation actions evaluated on ability to reduce impact of risk * * *
*: p<5% , **: p<1%; RM: Risk management
4.5 Specific Mitigation Actions (V)
Specific Mitigation Actions (V) (Table 7) includes the risk treatments where the degree of risk reduction achieved corresponded to a significant difference between the high and low performing projects/programs. Of the 32 different mitigation actions included in the survey, only two were found to be statistically significant.
Table 7: Significant differences of means: Mitigation (V) and Monitoring (VI)
Mindset Impact Stability Target
V. Specific Mitigation Actions
2 6
Self-assessments, continuous improvement and implementation of best practices were used.
1.31** 0.98* 1.07** 0.33 2
7
Standard work/processes were defined to increase process reliability.
0.88* 1.12** 0.91* 0.59
VI. Monitoring and Review
2
8 Risks were regularly re-assessed according to guidelines.
1.30** 1.14** 0.69** 0.21 2
9 The RM process was regularly reviewed and improved.
1.67** 1.64** 1.14** 0.52 3
0 RM is dynamic, iterative and responsive to change. (ISO)
1.63** 1.28** 1.28** 0.53* 3
1
A formal feedback system was used to monitor the execution of risk mitigation actions.
1.56** 1.27** 1.04** 0.15 3
2
An early warning system was used to track critical risks and decide on activating mitigation measures.
1.26** 1.15** 0.97** -0.13 *: p<5% , **: p<1%; RM: Risk management
Final Manuscript
4.6 Monitoring and Review (VI)
Monitoring and Review (VI) (Table 7) is a collection of those characteristics related to the monitoring and review of risks, execution of the risk management process, and the risk management process itself. Of all characteristics analysed, numbers 29 and 30 showed the largest difference of means for the Impact dimension (1.64) and Stability dimension (1.28), respectively. Characteristic 30 has p-values smaller than 5% in all four performance dimensions with relatively large differences of means. Both of these characteristics describe continuous improvement and adaptation of the risk management process.
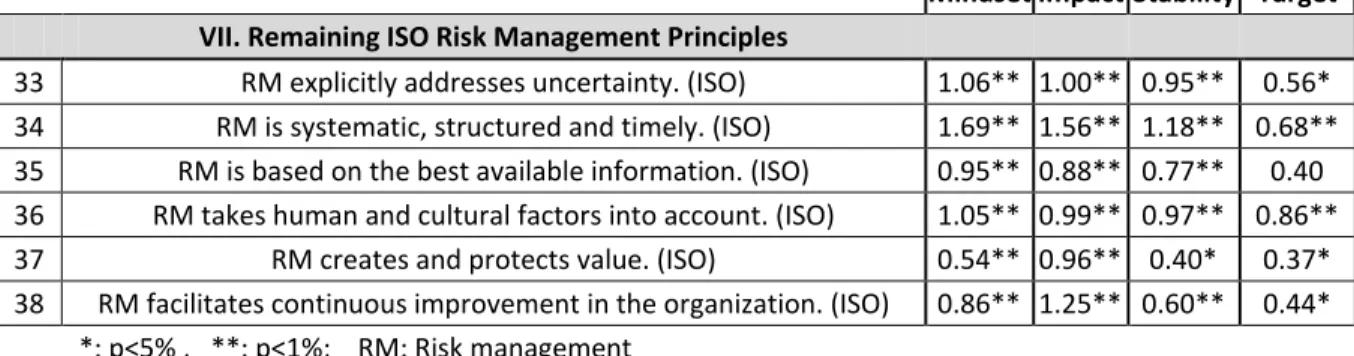
4.7 Remaining ISO Risk Management Principles (VII)
The 11 ISO 31000 Risk Management Principles (see Table 1) were included as Likert-scale questions in the survey. Characteristics 6, 12, 13, 23 and 30 are five of the eleven principles and were included in appropriate previous categories, and were discussed above. The remaining six principles are summarized in category VII: Remaining ISO Risk Management Principles (Table 8). P-values for all 11 principles are smaller than 5% across all dimensions except for characteristics 23 and 35 which did not have significant differences in the Target dimension. Of all characteristics analysed, number 34 showed the largest difference of means for the Mindset (1.69) dimension.
Table 8: Significant differences of means: ISO 31000 Principles (VII)
Mindset Impact Stability Target
VII. Remaining ISO Risk Management Principles 33 RM explicitly addresses uncertainty. (ISO) 1.06** 1.00** 0.95** 0.56* 34 RM is systematic, structured and timely. (ISO) 1.69** 1.56** 1.18** 0.68** 35 RM is based on the best available information. (ISO) 0.95** 0.88** 0.77** 0.40 36 RM takes human and cultural factors into account. (ISO) 1.05** 0.99** 0.97** 0.86** 37 RM creates and protects value. (ISO) 0.54** 0.96** 0.40* 0.37* 38 RM facilitates continuous improvement in the organization. (ISO) 0.86** 1.25** 0.60** 0.44*
*: p<5% , **: p<1%; RM: Risk management
5. Interpretation
Product design is a complex and intensely coupled process. It is not a surprise that the statistical analysis identified general features, philosophies, and attitudes which set apart low and high performing programs, rather than individual activities or methods for product design risk management.
5.1 Trends in Performance Dimensions
The statistical results indicate that there is a strong relationship between effective risk management and overall program performance. The trend of decreasing differences of means from dimension 1 to dimension 4 was expected since the four dimensions were ordered from that most dependent on risk management (“Mindset”) to the least dependent on risk management (“Target”). Overall program success is dependent on far more factors than were possible to capture in the survey. Nevertheless, many of the characteristics presented above are significant in the “Target” dimension, indicating that risk management has a direct impact on overall program performance.
Final Manuscript
The analysis indicates that in high performing projects, decisions are much more likely to be made based on the results of risk management analysis (IV Risk-Based Decision Making, Table 6). Decisions about forecasts, projections, contracts and other project decisions should be based on transparent risk trade-off information. Whether it is a fundamental idea of risk management (15: Resources are allocated to reduce the largest risks as early as possible) or more sophisticated decision method (21: Contracts are derived from detailed cost risk assessments), integrating risk management into the decision making process is a key factor in program performance.
The results of category II (RM Personnel and Resources) indicate the need for motivated, qualified personnel on the risk management team, and sufficient resources to conduct risk management. The significance of category III (Tailoring and Integration of the RM Process) clearly shows the importance of a customized and well-integrated risk management process throughout all functions, levels and processes in the organization. Successful risk management includes the internal and external stakeholders of the program in its processes and in on-going communication about the project. Risk management is not an external add-on function in the organization, nor is it a one-size-fits-all process. It must be tailored to the specific program environment and its stakeholders.
The risk management process and its execution must be regularly monitored and reviewed, as suggested by the strong significance of the characteristics in category VI (Monitoring and Review). This is important not only to the acceptance and impact of risk management throughout the organization, but to the stability of the program. Together with the characteristics in the preceding categories, this clearly shows that successful risk management is an on-going journey of tailoring, adaptation, integration and improvement, not a static process state.
5.3 Significance of All 11 ISO 31000 Principles
Finally, the statistical significance of all 11 ISO 31000 Risk Management Principles indicates that the fundamental philosophies on which the standard is based are indeed applicable to product design. The standard states that “for risk management to be effective, an organization should at all levels comply with the principles” [ISO, 2009a] and the results in this paper strongly support this statement. The 11 principles each have impact not only on effective risk management but also on the stability of the program and the overall achievement of cost, schedule, performance and customer satisfaction targets.
5.4 Agreement with Relevant Previous Studies
These results agree with previous studies (discussed in section 2.2) on the positive impact of risk management activities on product development outcomes. As was found in both [Raz et al., 2002] and [Mu et al., 2009], a positive relationship between risk management and the target achievement performance dimension was found for a number of categories and characteristics in this study. This paper goes beyond the previous studies by a) incorporating a much larger sample; b) addressing specific risk management practices instead of evaluating risk management as a whole; and c) differentiating the impact of risk management along four different outcome variables.
6. Conclusion
This paper reported the findings of a survey among industry professionals with regards to product design risk management. Four dimensions of success in product design risk management were identified. 38 survey variables were identified which showed a significant difference between low and high performing projects in at least three of the four dimensions of performance. These 38 characteristics were sorted into seven categories and presented as key factors of successful risk management in product design: I. Organizational Design Experience; II. Risk Management Personnel and Resources; III. Tailoring and Integration of RM Process; IV. Risk-Based Decision Making; V. Specific Mitigation Actions, VI. Monitoring and Review; and VII. Remaining ISO Risk Management Principles. All seven categories show strong evidence not only for successful risk management
Final Manuscript
practices, but also evidence that these practices positively affect overall program stability and the achievement of the program cost, schedule, performance and customer satisfaction targets. These results not only inform current practitioners on where to focus risk management efforts, but also contribute a first large-scale empirical evaluation of the impact of specific risk management practices on product development success.
The following limitations are important to consider when interpreting results. The survey is taken post-program and so accurate recollection of program details may be difficult. The analysis relies on self-reported outcomes which could be biased by the experience of the respondent. The survey was self-administered online; to address potential misinterpretation of the questions, clear descriptions and examples were included throughout the survey and opportunities were given to comment on individual questions. There is the potential for self-selection bias, where those who chose to respond to the survey did so because of an already strong opinion about risk management. A preliminary check to avoid a bias in the analysis due to various factors (e.g. industries, roles, project size) was performed for this analysis; extensive statistical analysis to control for these variables was not yet performed.
Acknowledgements
The authors would like to thank the King Fahd University of Petroleum and Minerals in Dhahran, Saudi Arabia, for funding the research reported in this paper through the Center for Clean Water and Clean Energy at MIT and KFUPM under R11-DMN-09. The authors gratefully acknowledge further funding support through the Lean Advancement Initiative and the MIT-SUTD International Design Center. We are also very grateful to the members of our industry focus group, benchmarking partners, professional organizations and academic partners that helped us develop, test and disseminate the survey, most notably AFIT, Futron, INCOSE and NDIA.
References
Cantarelli, C. C., Flyvbjerg, B., Molin, E. J. E. & van Wee, B. (2010) Cost Overruns in Large-scale Transportation Infrastructure Projects: Explanations and Their Theoretical Embeddedness. European Journal of Transport and Infrastructure Research, 10, 5-18.
Dezfuli, H., Stamatelatos, M., Maggio, G., Everett, C. & Youngblood, R. (2010) Risk-Informed Decision Making (NASA/SP-2010-576), Office of Safety and Mission Assurance, NASA Headquarters.
DoD (2006) Risk Management Guide for DoD Acquisition, Washington, D.C., United States Department of Defense, Office of the Secretary of Defense.
GAO (2009) Defense Acquisitions - Assessment of Selected Weapon Programs (GAO-09-326SP), Washington, D.C., United States Government Accountability Office.
GAO (2010) Defense Acquisitions - Managing Risk to Achieve Better Outcomes (GAO-10-374T), Washington, D.C., United States Government Accountability Office.
INCOSE (2007) Systems Engineering Handbook v3.1, Seattle, International Council on System Engineering. ISO (2009a) ISO 31000:2009(E) - Risk management - Principles and guidelines, Geneva, International
Organization for Standardization.
ISO (2009b) ISO Guide 73:2009 - Risk management - Vocabulary, Geneva, International Organization for Standardization.
ISO (2009c) ISO/IEC 31010: Risk management - Risk assessment techniques, Geneva, International Organization for Standardization & International Electrotechnical Commission.
Jiang, J. & Klein, G. (2000) Software development risks to project effectiveness. Journal of Systems and Software, 52, 3-10.
Mu, J., Peng, G. & MacLachlan, D. L. (2009) Effect of risk management strategy on NPD performance. Technovation, 29, 170-180.
Na, K.-S., Simpson, J. T., Li, X., Singh, T. & Kim, K.-Y. (2007) Software development risk and project performance measurement: Evidence in Korea. Journal of Systems and Software, 80, 596-605.
Oehmen, J., Ben-Daya, M., Seering, W. & Al-Salamah, M. (2010) Risk Management in Product Design: Current State, Conceptual Model and Future Research. Proceedings of the ASME 2010 International Design
Final Manuscript
Engineering Technical Conferences & Computers and Information in Engineering Conference IDETC/CIE 2010
PMI (2008) A guide to the project management body of knowledge (PMBOK guide), Drexel Hill, PA, Project Management Institute.
Raz, T., Shenhar, A. J. & Dvir, D. (2002) Risk Management, project success, and technological uncertainty. R&D Management, 32, 101-109.
Tang, C. S. & Zimmerman, J. D. (2009) Managing New Product Development and Supply Chain Risks: The Boeing 787 Case. Supply Chain Forum: An International Journal, 10, 74-85.
Dr. Josef Oehmen Research Scientist
Massachusetts Institute of Technology, Department of Mechanical Engineering 77 Massachusetts Avenue, Room 3-471, Cambridge, MA 02139, USA
Telephone: +1-617-452-2604 oehmen@mit.edu
![Table 1: Overview of ISO 31000 [ISO, 2009a]](https://thumb-eu.123doks.com/thumbv2/123doknet/14232038.485641/3.893.107.777.469.741/table-overview-iso-iso-a.webp)