READ THESE TERMS AND CONDITIONS CAREFULLY BEFORE USING THIS WEBSITE.
https://nrc-publications.canada.ca/eng/copyright
Vous avez des questions? Nous pouvons vous aider. Pour communiquer directement avec un auteur, consultez la
première page de la revue dans laquelle son article a été publié afin de trouver ses coordonnées. Si vous n’arrivez pas à les repérer, communiquez avec nous à [email protected].
Questions? Contact the NRC Publications Archive team at
[email protected]. If you wish to email the authors directly, please see the first page of the publication for their contact information.
NRC Publications Archive
Archives des publications du CNRC
This publication could be one of several versions: author’s original, accepted manuscript or the publisher’s version. / La version de cette publication peut être l’une des suivantes : la version prépublication de l’auteur, la version acceptée du manuscrit ou la version de l’éditeur.
Access and use of this website and the material on it are subject to the Terms and Conditions set forth at
Towards the Visualization and Understanding of Diagnoses in a Physical System
Abu-Hakima, Suhayya
https://publications-cnrc.canada.ca/fra/droits
L’accès à ce site Web et l’utilisation de son contenu sont assujettis aux conditions présentées dans le site LISEZ CES CONDITIONS ATTENTIVEMENT AVANT D’UTILISER CE SITE WEB.
NRC Publications Record / Notice d'Archives des publications de CNRC:
https://nrc-publications.canada.ca/eng/view/object/?id=f4c57e19-43a6-48fe-8dbf-05d13531d269 https://publications-cnrc.canada.ca/fra/voir/objet/?id=f4c57e19-43a6-48fe-8dbf-05d13531d269
Towards the Visualization and Understanding of Diagnoses in a Physical System1
Suhayya Abu-Hakima Knowledge Systems Laboratory Institute for Information Technology
National Research Council Ottawa, Canada email: [email protected]
tel: (613) 993-8551
Summary
Diagnosis of physical systems such as car or aircraft engines tends to be a com-plex activity. Technicians combine textual manuals with schematics and some anal-ysis of measured data to diagnose and repair engines. Knowledge-based system designers have added heuristics to hypermedia (mostly text and graphic) represen-tations of manuals to simplify the tasks of the technicians as in JETA [Halasz91]. Knowledge browsers for such systems are used by the knowledge engineers to structure and input the knowledge base and in a limited capacity are used to help the domain experts visualize the knowledge and the various possible relations as imple-mented for the JETA browser. In RATIONALE, a diagnostic system that reasons by explaining, explanation was used to understand the reasoning in the knowledge-based system [Abu-Hakima90]. This position paper argues that although these knowledge-based approaches help in the visualization and understanding of diag-noses in physical systems, they need to be improved and better integrated into an overall diagnostic system. Some of the many issues that arise in trying to achieve this are discussed in the paper.
Introduction
Diagnosis of physical systems such as car or aircraft engines is a complex ac-tivity. Technicians combine paper manuals with schematics and some analysis of measured data to diagnose and repair engines. Knowledge-based systems provide the technicians with electronic manuals organized using hypermedia techniques as well as diagnostic hierarchies that represent the failure, test and repair actions of the diagnostic cycle. Such an approach has been followed for JETA, the Jet Engine Troubleshooting Assistant [Halasz91]. Other systems have followed modelling and simulation techniques that represent the actual physical system and attempt to nose it on the basis of the expected behaviour of the model [MBR91]. Some
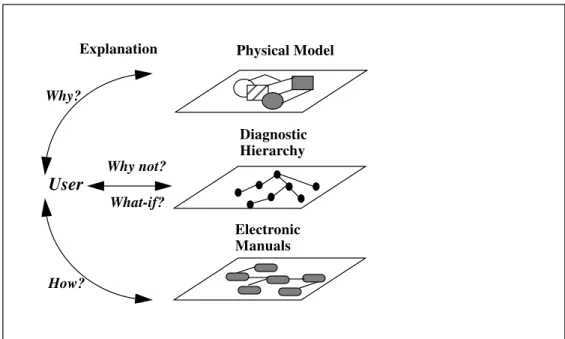
nostic systems support the user with sophisticated explanations of diagnoses that help justify system behaviour and clarify the reasoning to the user. RATIONALE is a diagnostic system which was developed to provide the user with such explana-tions [Abu-Hakima90]. Figure 1 illustrates the information flow with respect to the user.
All these systems fall short in helping the user visualize as well as understand system diagnoses. The primary reason for this shortfall is the lack of integration and mapping of the information represented to the user. Two representations can be thought of in diagnosing a system. The first is a physical real-world representation of the various components and their interaction. This is best visualized using a mul-ti-dimensional simulation true to the actual physical system. Supporting the real-world physical system is a paper manual describing its operation, failure testing and repairs. The second representation used to diagnose a physical system is the abstract one. This takes the form of representing the information known about the workings and failures of a physical system, derived from manuals and the experience of tech-nicians, and encoding it into a diagnostic system.
This position paper elaborates on the various information sources that the world of a diagnostic system user holds. The final section describes how the information sources could be better integrated so that a user can better visualize and understand a diagnosis.
Navigating Electronic Manuals - Hypermedia
Hypermedia, the linking of textual and graphical information (and in some cas-es voice information) has become cas-essential in the use of electronic manuals. The electronic manual, much like its paper counterpart, has indices and cross references. The difference lies in the ability to search the electronic manual in seconds versus minutes. Electronic manuals make use of hypertext links that display to the user def-initions or entire procedures based on the selection of a keyword in context. These same links allow the user to access any cross referenced schematics or drawings.
Electronic
Manuals DiagnosticHierarchy
Why? Why not? How? What-if?
Explanation Physical Model
User
This capability has been implemented in JETA, the Jet Engine Troubleshooting As-sistant [Halasz91]. The implementation of hypermedia in JETA has been facilitated by the existence of powerful user interface tools such as HyperNeWS.
HyperNeWS is a window interface tool [vanHoff91] written in PostScript which uses NeWS graphics primitives. It is similar in some ways to HyperCardTM,
but it can have client processes in LISP, Quintus Prolog and C. It is an object-ori-ented tool which runs under Unix. Its stacks can take any shape the developer cre-ates using the drawing tool and can have text objects, check boxes, user created iconic buttons, etc. The primary advantage of this tool is its use of meaningful images, graphics and icons to relay information to the user.
JETA integrates heuristics with its hypermedia manuals. These heuristics form the basis of its frame-based knowledge representation. The knowledge representa-tion was achieved by working with a domain expert in the structuring of the manu-als. Its knowledge is organized into a diagnostic network based on a hierarchy of general diagnoses that are focused to more specific ones as described in the next section. These frames contain procedures and markers to schematics that are made available to the user as advice. JETA also has a help system with hypermedia links that a user can access at any time during the session.
Understanding Diagnostic Hierarchies - Knowledge Browsing
As a knowledge base is developed, it is more difficult to track relations and to maintain the consistency of the information. Knowledge acquisition becomes more difficult since gaps in the knowledge base are not easily found. In response to these issues, knowledge browsers are developed. A knowledge browser graphically rep-resents the information in the knowledge base. Several researchers have been using knowledge browsers to graphically illustrate the relations between rules. Several such systems have attempted to address the problem of visually relating medical knowledge used in the diagnosis and treatment of patients [Banks88]. Another has been in the area of viewing and finding relations in statistical informa-tion [Stephenson88].
The objectives for browsers in all domains are similar. Mainly: to produce an observable domain structure (such as a diagnostic hierarchy); to allow the user unrestricted movement in the structure; to allow for alternative views of the same information; and to make use of a mouse with menus to reduce keyboard entry. As a result of these objectives the user needs: a guide or map for the structure; the ability to graphically modify the knowledge structure; markers that support audit trails; line type and colour to indicate relations; filters to reduce the amount of information; keyword search mechanisms; consistency checking mechanisms for the knowledge structure; and user tailoring.
JETA is a frame-based rather than a rule-based system[Halasz91]. Its knowl-edge base is structured with defined relations represented by slots in the node frame. Thus, its knowledge browser has to be flexible enough to visually commu-nicate the relations between the nodes. As a result, a diagnostic tree with colours on node and line features has been chosen to communicate relational information.
The knowledge structure is a hierarchy of nodes (as illustrated in Figure 2) with a root node at the top level. At the next level is a split between the phases of
operation of the engine and the list of major symptoms. This level is followed by several levels of functional or procedural test and general nodes. The lowest level in the hierarchy includes replace, repair and adjust nodes. It is important to note that the hierarchy, although it appears as such, is not a true one and is a directed network since some of the terminal nodes may require further tests which cycle back to earlier nodes in the network. In addition, some nodes may have links to other nodes that are not directly connected.
An important feature of the browser is the ability to zoom in on the network. The zoom mode allows the user to 'rubber band ' or put a box around an area they wish to zoom in on. The selected area is then expanded to the size of the current browser window. The browser allows the developer to edit the network graphi-cally. Nodes and links can be added and deleted. Nodes can also be moved with their links shortened or lengthened accordingly.
An important difference between traditional knowledge browsers and JETA’s is the ability to browse relations in a frame. When the browser is first started the lines connecting the nodes represent the subproblem-of relation which is a slot in each frame representing a node. The arrow at the end (visible on zooming) indi-cates that the node pointed to is a subproblem of the previous node. At a glance the developer viewing and editing the knowledge base can view the structure of the knowledge base and find what key relations have been defined for a set of nodes.
The browser allows one to focus on a node. Focusing allows the user to view a node and its parent and sibling links without viewing any other nodes in the tree. Focusing is recursive in nature and allows the developer to repeatedly focus on the parents of a node, the parents of the parents of the node, etc.
Explanation
We and others have long argued for the need of explicit knowledge representa-tion and reasoning strategies for the generarepresenta-tion of concise, coherent contextual explanations [Abu-Hakima 88& 90; Neches 85]. To maintain the context of expla-nation in diagnostic systems, we have argued that the knowledge base be organ-ized in a hierarchical structure. The most general knowledge should be represented near the root of the hierarchy and the more specific knowledge should be repre-sented near the end nodes. Since some of the explanatory knowledge is reprerepre-sented locally in the frame that is reasoned about, explanatory contexts would allow rela-tions between nodes such as refinements, siblings or alternates to be explained [Abu-Hakima 88& 90]. Templates are used to structure generated text responses.
The explanations generated for RATIONALE, an earlier implemented diagnos-tic system that reasons by explaining, are textual but are available in a hypermedia interface that has been described previously [Abu-Hakima 89]. We are currently specifying explanations for JETA which will be modelled after RATIONALE’s. In troubleshooting jet engines, technicians make use of manuals, graphs and schemat-ics showing how to dismantle and repair subsystems. For our user interface to truly support a technician, it is necessary for it to access and link relevant schematics, graphs and template-based text in context. Further it is essential that explanation be directly tied into this explicit reasoning and hypermedia interface.
in [Abu-Hakima 90] they allow the user to ask questions about dynamic and static knowledge. This includes why, why-not and what-if questions about the dynamic trace. It also allows the user to ask about deductive and abductive methods of the system and how conclusions are drawn from both the static and dynamic knowl-edge.
Integration and Visualization
For a user to understand and visualize the workings of a knowledge-based sys-tem for diagnosis, several layers of information need to be better integrated as illus-trated in Figure 3. There is a need for a visual model of the actual physical system. For example, in the case of a car engine it would include the engine block, the car-burator, the pistons, the valves, the air and fuel intake valves, the fuel pump, the wa-ter pump, etc. All these components should be visually modelled so that the user can see the various components acting and reacting as they would in the real world. The user should then be able to zoom in and out on the subsystems of the model down to the component level.
A second layer directly related to this layer should be a knowledge representa-tion and organizarepresenta-tion that allows the user to view the mapping from the real world physical system to the knowledge-based representation. This mapping could be in the form of a diagnostic hierarchy which includes the phases of operation of a sys-tem. In the case of the car engine root node the next level could be start, accelerate, decelerate and stop. The next level in the hierarchy would relate the phases of operation to the symptoms that would cause components of the car engine subsys-tems to produce problems at each of the phases of operation. For example in the case of an acceleration problem, we could have a fuel leak, a fuel pump malfunc-tion, a distributor malfuncmalfunc-tion, etc. This level would then be made more specific down to the lowest component level of the engine that is causing the problem. The structure of this knowledge would be illustrated using the knowledge browser. Note that at the lowest level the user would see the individual components of the engine mapped from the real world physical model referred to above.
The third layer would be the hypermedia representation of the electronic man-ual. This would have hypertext links to procedures and tests included in the diag-nostic hierarchy. In addition, any schematics or visual representation of procedures would make use of the real world physical model of layer one. Thus, if the user is required to dismantle a subsystem in a particular order, a simulation of the disman-tling down to the individual components would be played back making use of the visualization of layer one. This is akin to a video of the individual parts being dis-mantled being played back to the user. This approach communicates causal infor-mation quite easily and is related somewhat to the concepts discussed in
[Feiner90].
The underlying link between the three layers comes in the form of explanation. Explanation of why the physical components in a subsystem have caused it to fail are much easier to generate with a visual aid such as those available in layers one and two.
components of the physical system acting and reacting. In the car example it is much easier to visually illustrate a piston seizing due to the lack of oil lubrication rather than textually describing it.
Another graphical enhancement to the content of an explanation would be the use of two to three level subtrees of the diagnostic hierarchy of the browser to illustrate relations. If, for example, the user asks why a certain conclusion was not made. If the conclusion was due to a refinement of the original hypothesis,
the root of the subtree would be the original hypothesis and the subsequent refine-ments of that node would be illustrated using children of the root and how they failed to confirm a particular problem. In the case of a trace which required the traversal of many levels of nodes to reach a conclusion, a mechanism such as that used in RATIONALE's textual explanations [Abu-Hakima 88] could rank the nodes for explanation content in terms of relevance and complexity. In the cases where explaining the node is overly complex compared to its relevance to the cur-rent line of reasoning, it is omitted from the explanation. In the cases where it is relevant and not overly complex it is included.
Explanations should also be added to the browser itself. Explanations could be used to describe the various relations and how they are used in the diagnosis. A user who is not the developer, such as a domain expert, could benefit by viewing, commenting and possibly modifying the knowledge base.
A knowledge browser which uses visual cues such as colour and line shapes to provide the user with a structured view of the knowledge is essential for the aver-age user of a system. With such a tool the user could better visualize and under-stand the mappings between the real world physical layer, the electronic manuals and the diagnostic system.
Another level of integration would allow the user to generate hypermedia que-Electronic
Manuals Diagnostic Hierarchy Explanation Physical Model
User
Figure 3: Integrated world of user in knowledge-based system
Why?
Why not?
How?
ries off the physical visualization. This could be offered in varying degrees of depth such as contextual help is generally offered.
In conclusion, it is essential that diagnostic systems make better use of existing visual aids such as multi-dimensional models and diagnostic network browsers to better serve users. The integration of such tools requires that the physical and abstract representations used in knowledge-based systems be better integrated. It is also important to recognize that there are many classes of users of diagnostic sys-tems. There are developers, domain experts and end users (the technicians). Within each class of user there are varying levels of expertise which translate to specific needs that should be addressed. Finally, explanation is a powerful tool useful for better understanding and visualizing diagnoses. It has thus far been poorly used and is very much the cornerstone of better understanding by users of diagnostic systems.
References
[Abu-Hakima88] Abu-Hakima S. RATIONALE: A Tool for Developing Knowledge-Based Systems
that Explain by Reasoning Explicitly. Masters thesis, Carleton University, Ottawa, Canada. May
1988.
[Abu-Hakima89] Abu-Hakima S. and van Hoff A.A. An Intelligent Environment for Developing Knowledge-Based Applications. Proceedings of IJCAI '89 Workshop on A New Generation of Intelligent Interfaces. Detroit, MI. August 89.
[Abu-Hakima90] Abu-Hakima S. and Oppacher F. Improving explanations in knowledge-based systems: RATIONALE. Knowledge Acquisition journal (2). 301-343. December 1990.
[Banks88] Banks G. McLinden S. and Carlos G. Implementation of Medical Knowledge-Bases in Hypercard. Proceedings of the Twelfth Annual Symposium on Computer Applications in Medical Care. Washington, DC, November 6-9 1988. pp. 434-440.
[Feiner90] Feiner S. and McKeowen K. Coordinating Text and Graphics in Explanation Genera-tion. Proceedings of the Eighth National Conference on Artificial Intelligence, Boston, Massachu-setts. July 29-August 3, 1990. pp. 442-449.
[Halasz91] Halasz M. Davidson P. Abu-Hakima S. and Phan S. JETA: A KNowledge-based Approach to Aircraft Gas Turbine Engine Maintenance. To appear in Applied Intelligence: The International Journal of AI, Neural Networks and Complex Problem Solving Technology,. Kluwer Academic Publishers.
[MBR91] Workshop Notes from the 9th National Conference on Artificial Intelligence (AAAI ‘91) Model-Based Reasoning. Anaheim, California. 1991.
[Neches85] Neches R., Swartout W.R., and Moore J.D. Enhanced Maintenance and Explanation of Expert Systems Through Explicit Models of their Development. IEEE Transactions on Software Engineering, Vol. SE-11, No. 11, 1337-1351 (November 1985).
[Stephenson88] Stephenson G.A. Knowledge Browsing - Front Ends to Statistical Databases. Sta-tistical and Scientific Database Management. Fourth International Working Conference SSDBM Proceedings. June 27-30 1988. pp. 327-337.