'A
Analysis of Randomly Occurring High Injection Forces in an Insulin Delivery Device
by
William D. Bellows
B.S., Engineering
Messiah College, 2009
MASSACHUSETTS INSTITUTE OF TECHNOLOGYAUG
15
2014
LIBRARIES
Submitted to the MIT Sloan School of Management and the Mechanical Engineering
Department in Partial Fulfillment of the Requirements for the Degrees of
Master of Business Administration and
Master of Science in Mechanical Engineering
In conjunction with the Leaders for Global Operations Program at the Massachusetts
Institute of Technology
June 2014
@ 2014 William D. Bellows. All rights reserved.
The author hereby grants to MIT permission to reproduce and to distribute publicly
paper and electronic copies of this thesis document in whole or in part in any
medium now known or hereafter.
Signature of Author
Signature redacted.
MIT Sloan School of Management, Department of Mechanicalfngineering
May 9, 2014
Signature redacted
Certified by
Ro Welsch, Thesis Supervisor
Professor of Statistics and Management Science, MIT Sloan School of Management
A
Certified by
QJ
Jungpoon Chun, Thesis Supervisor
Pro
s
of Njechap'AkEnginegring
Accepted by
Signature redacted
David E. Hardt, Chair
Mechanical Engineering Committee on Graduate Students
II
Accepted by
Signature redacted
Analysis of Randomly Occurring High Injection Forces in an Insulin Delivery Device
by
William D. Bellows
Submitted to the MIT Sloan School of Management and the MIT Department of
Mechanical Engineering on May 9, 2014 in Partial Fulfillment of the Requirements
for the Degrees of Master of Business Administration and Master of Science in
Mechanical Engineering
Abstract
During manufacturing scale-up of a new product, new failure modes often surface which require
corrective action. However, as production numbers of an insulin injection device pass 200
million per year, testing continues to find sub-assemblies with too-high injection forces,
seemingly at random. Up until now, no corrective action has been effective in preventing these
problems. These non-conforming sub-assemblies cause batches to be rejected, reducing the
production yield at Sanofi's Site Frankfurt Devices (SFD) production facility.
This thesis describes the current state of rejected batch problem solving and explores the
application of new methods to better understand the root problems and improve the process.
Frequency spectra analysis of testing data using the Fast Fourier Transform (FFT), combined with
device physics, identified the key interaction points within the sub-assemblies. This model of
part interactions has been verified through testing of purpose-built defective pieces and
examination of defective parts. The verified model was then used to identify which components
within sub-assemblies cause non-conformances. The root causes of several failure codes were
determined, and results were further confirmed by rebuilding and retesting subassemblies with
the identified problem components. These results confirm the usefulness of this novel
application of frequency analysis to a new field of industrial troubleshooting. Various
improvement and control methods are explored and next steps recommended for Sanofi to
further improve quality control processes and thereby the production yield.
The opinions expressed herein are solely those of the author and do not necessarily relect those
of Sanofi S.A.
Thesis Supervisor: Roy Welsch
Title: Professor of Statistics and Management Science, MIT Sloan School of
Management
Thesis Supervisor: Jung-Hoon Chun
Acknowledgments
As the first LGO intern to work with Sanofi, I find myself deeply indebted to the many people at Sanofi and MIT who made this project possible by overcoming the many difficulties that a first-time project entails. I want to thank everyone who made my time in Frankfurt such an incredible experience.
First off I must acknowledge Stefan Bohling and Axel Forstreuter for sponsoring and supervising the internship project; it would not have happened without you. Thanks to my Sanofi task force teammates Alex Meier and Frank Bien for welcoming me to the project, patiently bringing me up to speed and supporting my efforts, and for many stimulating chats about life and insulin injection devices over coffee. I'd like to recognize Dr. Patric Stracke for graciously sharing your efforts in exploring frequency analysis and keeping such good documentation! I also want to express my appreciation to Daniel, Stefanie, Peter, Sylvia, and all the others who made my stay in Frankfurt so enjoyable.
I'd like to recognize my MIT advisors, Roy Welsch and Jung-Hoon Chun, for giving up their time and
enabling me to learn from their experience. Also, thank you so much to LGO's Ted Equi and to Erin Schenk of the MIT Germany program for helping me with all of the legal, logistical, and bureaucratic details required to get me to Germany and Sanofi. I am also extremely thankful to LGO and all of my classmates who make it a job to learn operations.
Finally, it is my pleasure to thank my wife Alyssa: your love and unwavering faith in me keep me going in all circumstances, and I am profoundly blessed to share the rest of my life with you.
The author wishes to acknowledge the Leaders for Global Operations Program for its support of this work.
Table of Contents
Abstract ... 3 Acknowledgm ents ... 5 Table of Contents ... 7 List of Figures ... 10 List of Tables ... 11 1 Introduction ... 121.1 General Problem Statement ... 12
1.2 Goals ... 13
1.3 General Approach and Results ... 13
1.4 Thesis Organization ... 14
2 Background ... 14
2.1 Site Frankfurt Devices ... 15
2.2 Insulin Injection Devices ... 16
2.3 Supply Chain ... 16
3 Literature Review ... 19
3.1 Plastic Injection M olding ... 19
3.2 ISO Testing Requirements ... 21
3.3 Frequency Analysis ... 22
4.1 Sam pling and Inspection Procedures... 24
4.2 Batch Reject Rates ... 25
5 Root Cause Analysis ... 27
5.1 Defective Parts Analysis ... 28
5.2 Com ponent Tracking...31
5.3 Frequency Analysis...31
5.3.1 Underpinnings of Frequency Analysis... 33
5.3.2 Norm al Device Frequency Spectrum ... 36
5.3.3 Code E Frequency Analysis... 38
5.4 Com ponent Dynam ics...42
5.5 Com ponent Interaction Validation ... 44
6 Im provem ent ... 46
6.1 Enhanced Lubrication ... 46
6.1.1 Code C and Lubrication ... 47
6.1.2 Grease Quantity Testing...48
6.1.3 Grease Distribution Testing ... 49
6.2 M odified Com ponent Design ... 50
6.3 Discussion of Results...53
7 Recom m endations and Conclusion... 54
7.2 In-process Inspection and Control... 54
7.3 Data Analysis Autom ation...55
7.4 Conclusions ... 56
8 References ... 57
List of Figures
Figure 1. Images of insulin injection devices produced by Sanofi ... 15
Figure 2. Pictures of the Automatic Testing Equipment (ATE) ... 18
Figure 3. Diagram of an injection molding machine...20
Figure 4: The severity of vibration velocity for different classes of machines. ... 23
Figure 5. Pareto analysis of failure types... 26
Figure 6. Examples of physical defects which cause high injection forces... 29
Figure 7. Computed tomography scan showing component defect ... 30
Figure 8. Process overview - determining root causes with frequency analysis ... 32
Figure 9. Frequency analysis example - three periodic curves ... 33
Figure 10. Frequency analysis example - complex curve from superposition of simple periodic curves... 34
Figure 11. Example frequency analysis - frequency magnitude graph ... 35
Figure 12. Frequency analysis example - contributing frequencies identified ... 36
Figure 13. Injection force of normally functioning mechanic... 37
Figure 14. Frequency spectrum of normally functioning mechanic ... 38
Figure 15. Code E injection force curve ... 39
Figure 16. Code E frequency spectrum ... 40
Figure 17. Code E component parts & superposition... 41
Figure 18. Code E original force curve with reconstructed curve superimposed... 42
Figure 19. The pitch of a threaded part ... 43
Figure 20. Code H injection force curve... 46
Figure 21. Starting peak force curve (Code C) ... 47
Figure 22. Effect of lubricant amount on mechanic injection force ... 48
Figure 24. Image of a Code X defect... 51
Figure 25. Code X injection force curve... 51
Figure 26. Comparison of Modified and Regular Component ... 52
Figure 27. Code A injection force curve ... 59
Figure 28. Code C injection force curve... 60
Figure 29. Code D injection force curve ... 60
Figure 30. Code E injection force curve... 61
Figure 31. Code H injection force curve ... 61
Figure 32. Code W injection force curve ... 62
Figure 33. Code X injection force curve... 62
Figure 34. Code Y injection force curve... 63
List of Tables
Table 1. Suppliers' percent of total reject batches (Sanofi incoming inspection)... 25Table 2. Percent of each failure code contributed by supplier ... 27
Table 3. Part interaction movements responsible for high injection force for various force codes... 43
1
Introduction
Plastic injection molding (IM), with its low cost, high run rates, and good precision, has become the technology of choice for manufacturing of high volume products. As the technology has improved,
manufacturers have gone beyond making single components to making entire assemblies purely out of plastic IM parts. This adds complexity and raises the bar for individual part tolerances. As with any high volume process, certain defect modes often do not present themselves until ramp up of production. These growing pains are expected, and Sanofi - a worldwide leader in the pharmaceutical medical device industries - is well versed in troubleshooting IM manufacturing defects during production ramp up. However, seemingly random defects have continued to spring up throughout ramp up and into the full production phase of a major medical device. These defects often have no readily apparent root cause and are a ripe opportunity for applying new analytical tools.
1.1 General Problem Statement
Sanofi faces strong and growing demand for its insulin injection devices. Subassemblies from suppliers are a key part of the supply chain, but if testing of samples shows abnormal functioning, entire batches of subassemblies must be rejected and discarded. The 2011-2012 rejection rate of greater than 2% sabotages their ability to meet demand in a key market. In order to reduce the rejection rate of
subassembly batches, root causes for heretofore unexplained non-conformances must be identified. Various efforts by Sanofi and its suppliers have attempted to correct defects and improve the control of
the manufacturing process. However, root causes for the majority of testing failure types have yet to be discovered.
1.2 Goals
The purpose of this work with Sanofi was three fold: to identify new processes for the identification of root causes of defective parts, determine the root causes of all current failure types, and recommend process and design improvements to prevent further recurrence of these issues. This thesis explores the application of new root cause analysis techniques - including spectrum frequency analysis and factorial testing - to high volume medical device manufacturing. The application of spectrum frequency analysis, which is frequently used for bearing analysis in machine diagnostics, to plastic IM assemblies is novel and provides a new and powerful tool for root cause analysis. This work also shows the applicability of this tool beyond its normal usage, hopefully providing the inspiration for further innovation in applying mechanical analysis tools beyond the areas where they are already routine.
1.3 General Approach and Results
Steps were first taken to understand the previous efforts to rectify the problem of rejected batches, which primarily used batch level statistics. There is significant documentation of these attempts in the form of official supplier Corrective and Preventative Action (CAPA) reports, in addition to internal
records of improvement testing. Benchmarking of supplier sampling and testing methods also provides valuable context for understanding how defective sub-assemblies reach the final manufacturing site.
Frequency spectrum analysis is then applied to sub-assembly data and is shown to be valuable in
identifying which interactions between parts are causing non-conformances in cases where clear defects cannot be found during examination of the device. From these results, identified problem parts are assembled with brand new parts and retested, the results of which confirm the predictions made by the spectrum analysis. With the root causes of major failure modes confirmed, simple improvements to the manufacturing process and the device design are tested, but are shown to be ineffective in preventing non-conformances. Building on these results, recommendations are made for improved process
controls, the application of spectrum analysis and part confirmation testing, and further design improvement testing.
1.4 Thesis Organization
Chapter 1 gives an overview of the manufacturing problem and thesis approach and organization.
Chapter 2 contains background information on insulin injection devices, Site Frankfurt Devices where Sanofi produces most of its devices, and the injection device supply chain.
Chapter 3 reviews literature surrounding plastic injection molding, sampling and testing requirements, and frequency spectra analysis.
Chapter 4 compares and contrasts supplier quality methods and the incidence of rejected batches.
Chapter 5 discusses several different methods for determining causes of defective devices, with examples drawn from work done at Sanofi.
Chapter 6 describes a sample of device improvement tests and discusses their implications.
Chapter 7 summarizes the key results from root cause analysis and improvement efforts and provides recommendations on future work and applications.
2 Background
Sanofi is a global healthcare company headquartered in Paris, France, with operations in more than 100 countries. Within its diversified portfolio of healthcare offerings, Sanofi has long been a leader in
2.1 Site Frankfurt Devices
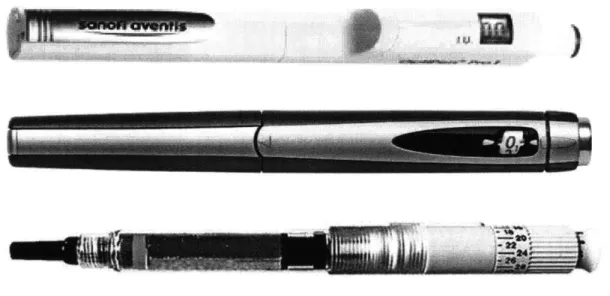
Sanofi produces insulin injection devices at Site Frankfurt Devices (SFD) in Frankfurt, Germany. The commitment to patients is exemplified in the site vision statement: "We deliver convenient to use, safe and effective medical devices for all patients who require self-treatment to manage their disease." Site Frankfurt Device's portfolio of products (Figure 1) includes several reusable and disposable options for insulin injection devices.
Figure 1. Images of insulin injection devices produced by Sanofi
These devices are shipped throughout the world and the site is therefore subject to inspections by global regulatory agencies including those from Germany, the US, and Brazil. A new production facility with capacity in the millions of devices was constructed in 2006 in order to meet the high demand. It is
here that recurring issues with non-conforming batches of one of Sanofi's devices have resulted in negative financial impacts and higher pressure to meet volume requirements.
2.2 Insulin Injection Devices
According to the Centers for Disease Control and Prevention (CDC), diabetes is a chronic disease "marked by high levels of blood glucose resulting from defects in insulin production, insulin action, or both." [2] In the United States Sanofi's single largest market for insulin and insulin injection devices -diabetes affects more than 25 million or 8% of the population, and more than a quarter of diagnosed adults require regular insulin to help control blood glucose levels. [2] Called combination products by the US Food and Drug Administration (FDA) [3], prefilled insulin injection devices can be more accurate and convenient for patients than syringes. They provide easy dosage control and simplified use when compared with alternatives. These devices are either reusable or disposable. With reusable devices, patients can change out the insulin cartridge when they have used up all of the medication. Patients using disposable versions can simply discard the entire device and use a new prefilled device. The second option is often considered more convenient as patients do not need to deal with small parts and
potentially complicated reassembly. This is especially important for the infirm or elderly. In order to keep costs down, the disposable options are constructed almost entirely of plastic injection molded parts. The most important feature for both types of devices is "easy push-button injection" which is also the number one reason for patients to change brands. Due to the importance of this feature Sanofi places strict limits on the injection force required to operate its devices.
In order to prevent high injection force devices from reaching consumers, device samples are
destructively tested from each batch before filling with insulin occurs; if injection force exceeds the limit the entire batch of part sub-assemblies is rejected from use with production and discarded.
2.3 Supply Chain
In addition to high volume manufacturing, SFD also houses supply chain management for its devices. An established network of suppliers from across Europe does the primary manufacturing: sourcing raw
materials, plastic injection molding of parts, and assembly of these parts into subassemblies known as mechanics. The mechanic houses the device mechanism which provides dosage control and dispensing. The mechanics are vertically packed into plastic carrying trays, each holding approximately 200 pieces, and shipped to SFD for final assembly and filling with insulin. Each direct supplier produces the exact same mechanics, with only minor shape and color variations for use with different types of insulin. The overall supply chain is not particularly complex and each mechanic is traceable to the supplier and assembly line, while each individual part is traceable to the injection mold used to create it.
Suppliers perform various quality control measures on their production processes. Individual parts are sampled regularly during injection molding and checked for dimensional accuracy using high tolerance coordinate measuring machines. Operators and quality staff supplement these measurements with frequent visual inspections. After subassembly, sampling of completed mechanics is carried out. Sampled units are split between the supplier and Sanofi. The supplier tests their mechanics on
automated testing equipment (ATE) which has been calibrated to match the ATE's at SFD, which will be used for final batch acceptance or rejection. The units for Sanofi's incoming batch testing are
segregated in a tray marked for the SFD quality department and shipped with the rest of the batch. Upon arrive in Frankfurt the sampled mechanics are tested on one of Sanofi's ATE's. If the number and severity of non-conformances surpass specified quality thresholds, further sampling testing of the batch is carried out to determine final acceptance or rejection of the batch.
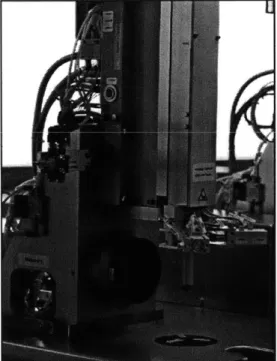
The ATE (see Figure 2) is fully automated and measures each mechanic's function and appearance on a variety of important quantitative variables and qualitative characteristics. For the purposes of this thesis, the most important variable measured is the injection force. Not only is the ease of injection the most
important feature according to patients as discussed in section 2.2 Insulin Injection Devices, but it is also the characteristic which causes the majority of non-conformances and batch rejections. A piston within
the machine models the resistance to the mechanism provided by the insulin cartridge, allowing for a valid comparison with actual user experience. The injection force is measured across multiple injection cycles of the mechanic. There are two specification thresholds for injection force. Mechanics exhibiting injection force in a range slightly above normal are designated "stiff" mechanics. While stiff mechanics
may not be noticeable during normal operation, they are still tightly controlled. Mechanics
demonstrating even higher injection forces are labeled "blocked," and have even tighter controls placed on them. The allowable limit for numbers of stiff and blocked mechanisms is set according to their acceptable quality limit (AQL), the batch size, and sample size according to ISO standard 2859-1.
3 Literature Review
The following literature review addresses the manufacturing process, regulatory requirements, and analysis techniques used for the insulin injection devices. This thesis builds on machine analysis tools (frequency analysis) which have been in use for more than 50 years. However, this appears to be the first instance of applying these tools to a plastic injection molded part, so much of the discussion here must be translated into very different working terms (for example, in machine analysis frequencies are commonly in the 1000's; in this thesis, the highest frequency is approximately 40Hz).
3.1 Plastic Injection Molding
Injection molding is widely used for consumer and commercial products, as it is a very economical way to manufacture small plastic components. The process also provides high rates of production along with excellent control over part dimensions [4], two factors which make it an excellent choice for producing disposable medical devices.
In a basic form of the process, plastic granules or pellets are fed into a ram or screw-type plunger (Figure
3) which melts the plastic and then forces the material under pressure into a mold, creating the desired
shape [5]. When the part has sufficiently solidified and cooled, the mold is opened and the part ejected. The entire process is very fast, with cycle times as low as five seconds, and lends itself to automation.
Molds with multiple cavities create more than one part with each shot of the press, further enabling high production volume. Parts produced can be quite complex, with even interior and exterior threads possible through the use of moving and unscrewing mandrels. [4]
-Injection
Molding
Plastic Granules Hopper Heater
Reciprocating Screw Barrel
Injection
Machine
Mold Cavity Mold
/
I
Nozzle Moveable Platen
Clamping
Figure 3. Diagram of an injection molding machine.
Created by Brendan Rockey, University of Alberta Industrial Design, for Injection Molding Wikipedia article.
Plastic injection molding quality is heavily dependent on mold quality and design and various process characteristics such as temperature, pressure, and moisture [5]. Defects such as incorrect dimensions, flash, and short shots, for example, can cause significant detriments to final part operation. As molds wear over time, dimensions can fall out of the specified tolerances, and cavities may become damaged and transfer that damage to the plastic parts. If the injection pressure is too high or the mold clamping
pressure too low, flash can occur where molten plastic seeps out of the cavity causing a thin layer of excess material to be attached to the part. Short shot is when not enough material enters the mold to finish the part and can be caused by low injection pressure or temperature, insufficient material, etc. It is also possible for parts to become bent or warped during ejection from the mold cavity. Even if not readily apparent to the naked eye, defects such as these can easily cause the part to fail during operation, especially for moving parts such as those used in insulin injection devices. Because of the many factors affecting injection molding quality, trial runs to test mold design and determine injection process parameters are usually performed before full production begins. [5]
-3.2 ISO Testing Requirements
The International Organization for Standardization (ISO) is an international federation of national standards bodies; it drafts standards through technical committees which are then approved by the member bodies. [6] Sanofi's ISO certified quality management system utilizes several ISO standards to ensure quality. This section includes a brief summary of the ISO sampling requirements which Sanofi uses to inspect insulin injection mechanisms for batch release. By following the procedures laid out in
ISO 2859 Sampling procedures for inspection by attributes, the certification "inspection in compliance
with ISO 2859" can be used.
The type of inspection used is called "inspection by attributes" in which each inspected item is classified as "conforming or nonconforming to a specified requirement..." [6]. In this case, the requirement is whether or not the mechanic is stiff or blocked according to the injection force limits imposed by Sanofi. The sampling plans contain the sample size to be inspected, the number of allowed nonconformances, and the rejection number, the number of nonconformances which will cause the entire lot to be rejected. The sampling plan depends on the lot or batch size, the process quality, as well as the acceptance quality limit (AQL); the AQL is the maximum percentage of nonconformances in the underlying process which a sampling plan will be designed to encourage the process to surpass. So if the AQL is 2.5%, then the sampling regimen should invoke tightened inspection and eventual
discontinuation of sampling inspection if the underlying process average has a defect rate above 2.5%. In general, the sample size will be slightly larger for larger lot sizes, and it will decrease if the process quality is shown to be consistently meeting requirements. Samples for inspection are to be drawn by simple random sampling. [6]
3.3 Frequency Analysis
"Every rotating machine exhibits a characteristic vibration signal... [which] is the sum total of the design, manufacture, application, and wear of each of its components." [7] Frequency analysis is the process of breaking down this signal into its constituent parts in order to identify which component(s) are causing or are about to cause problems for machine operation. This method has many advantages, among which is the ability to perform the analysis while running the machine and without invasive inspection.
Frequency analysis utilizes the Fourier transform to take data measured as a time series and convert it into the frequency domain. This technique has been applied to relating machine frequencies to specific physical causes for a very long time, but it wasn't until the fast Fourier transform (FFT) was devised in
1965 [8] that this technique could be rapidly deployed [7]. The use of an FFT analyzer in machine
analysis, especially bearing analysis, is well defined and commonly used in maintenance departments around the world. The steps have been simplified and codified such that technicians on the front lines can easily apply them to gain valuable insights. Here is one such guideline for doing this analysis [9]:
1. Collect useful information
2. Analyze spectral data
3. Use additional techniques to identify faults/defects
4. Perform root cause analysis
5. Reporting and planning actions.
The guide published by the SKF Group, a major manufacturer of machine components, includes full details on how to follow these steps to identify machine faults. The issues surrounding machine vibration are well understood, to the point that standards for evaluating the severity of vibration have been generalized for different types of machines and machine mounting systems, as seen in Figure 4.
Figure 4: The severity of vibration velocity for different classes of machines.
On the other end of the academic spectrum, there are numerous published articles on advanced
techniques for identifying bearing faults within machinery and other equipment [10] [11]1. However, for a first foray of frequency analysis into the realm of plastic injection molded products, the analysis described here will be limited to the most basic frequency analysis techniques. The above guidelines closely mirror the actions taken by the author in performing this work.
4 Supplier Comparison
Supplier quality and production processes were evaluated for defect occurrences of a certain type to identify potential improvements to process controls and quality testing. This would enable faster and more effective corrective and preventative action towards these defects.
4.1 Sampling and Inspection Procedures
While Sanofi has common quality and testing agreements - including sample sizes - with its suppliers, each supplier still has its own processes for sampling of mechanics. Here we will compare and contrast the sampling procedures of two suppliers (designated "Beta" and "Epsilon") and discuss how these may affect process and product quality.
At both facilities, plastic injection molding and final assembly are collocated in a designated clean manufacturing area (level set by medical device manufacturing requirements). The quality testing lab is in an enclosed room within the manufacturing hall enabling convenient access and smooth
communication flow. Fully assembled mechanics are checked on a variety of factors including injection force. Key to this process is how tested parts are chosen or sampled.
The automated equipment performs assembly steps on several mechanics at once which travel together along the line on carriers. The positions on the carriers are called tracks. At supplier Beta, quality inspections start with the assembly operators who perform visual checks on mechanics every hour. Operators take parts from all assembly tracks at the end of assembly before loading on shipping trays occurs. Mechanics are manually tested for high injection forces, which can catch blocked mechanics but
a person's feel may not be precise enough to catch stiff mechanics. When operator detects problems, and the defect is assembly related, problem fixing occurs immediately at production line.
For batch release testing, the same two trays of mechanics are picked out from each batch, one from halfway through the batch and one from near the end. These trays are taken to the quality area where half of each tray is set aside for internal testing and the other two halves are combined and sent to Sanofi for incoming batch testing. The number of mechanics the supplier and Sanofi test is set by ISO testing levels according to the acceptable quality level for the devices (discussed in 3.2 ISO Testing Requirements).
In contrast, mechanics for release testing are sampled during the automated tray loading process at supplier Epsilon. For each tray transport pallet per batch a set number of samples are automatically sampled to ensure good testing coverage of the batch. Track information as well as the order in which
mechanics were assembled is recorded throughout the sampling and tray loading processes. Then, similar to supplier Beta, Epsilon quality control department visually inspects and then tests in an automated test equipment (ATE) a percentage of the sampled parts and sends the rest to Sanofi with the batch.
When Epsilon's quality control department finds stiff and blocked mechanics, they do have further recourse due to the extra information collected. If the defect is assembly related, and knowing which track the problem mechanic comes from greatly narrows down the search for the cause in the assembly equipment.
4.2 Batch Reject Rates
Despite the fact that both suppliers have excellent manufacturing spaces and test similar numbers of final mechanics, the extra effort and investment put into automated sampling, recording track information, and consistent ATE force measurements, Epsilon is in a better position to catch
manufacturing problems early with a positive impact on overall quality levels. This is demonstrated in in Table 1 which compares the percentage contribution to total rejected batches between the two
suppliers.
Table 1. Suppliers' percent of total reject batches (Sanofi incoming inspection)
Rejected Batches by Supplier
Supplier 2011 2012 2013
Beta 37% 33% 47%
Each supplier has different production rates (some suppliers have up to twice as much volume as others), which makes this table inappropriate for direct comparisons between suppliers. However, the change in percent of total rejected batches over time is striking, especially the large drop for Epsilon between 2011 and 2012.
After the preceding discussion on variation between suppliers' sampling and testing measures, the next overview information to explore is the prevalence of the different failure codes. While a Pareto analysis
usually expects to show the effects of the important few compared to the insignificant many, in this case it takes fully half of the failure codes to make up 80% of the total defective mechanisms (see Figure 5). The most prevalent code has less than a 25% share of the total, while five codes come in at greater than
10%. This shows that there are many common defect types which need to be addressed.
Frequency of Failure Codes in 2012
- --- ---
-
100
0
--
--- - -- - --
-
-
--
--- - -
50
- - - - --- --- ---- - - ---- ----03C
X
E
D
V
Y
W
G
F
A
Figure 5. Pareto analysis of failure types
Not only are the number of non-conformances spread evenly across many different failure types, the failure types are also spread extensively across suppliers (see Table 2). As with the percent of rejected
batches by supplier, this data is confounded by different production levels across suppliers. It is
only occurring in one supplier. However, the four most common failure types occur across all suppliers. So the most important problems cannot be accounted for by merely looking at supplier differences.
Table 2. Percent of each failure code contributed by supplier
Stiff Mechanics by Supplier__________ Supplier Code Code Code Code Code Code Code Code Code Code Code Total
A C D E F G H V W X Y
Beta 100% 17% 2% 8% 30% 89% 3% 14% 32% 100% 22%
Epsilon 15% 13% 18% 15% 18% 11%
These graphics make it readily apparent that the problem of high injection forces is both diverse and diffuse. Despite the large variety of failure types (and corresponding low occurrence rates for each one), the highest priority issues need to be addressed at all suppliers.
5
Root Cause Analysis
When the Automated Testing Equipment (ATE) has measured high injection forces in a mechanic, there are many available avenues for analyzing what caused the high forces. These root cause analysis options fit into four main groups: part inspection and investigation, component and production incident tracking, testing data analysis, and factorial retesting of parts. The first two correspond to the first two sections, 5.1 Defective Parts Analysis and 5.2 Component Tracking; these methods are well established at Sanofi and its primary suppliers. Next in section 5.3 Frequency Analysis, a new data analysis method is described which builds on previous data categorization work. Necessary to this method is a fuller understanding of Component Dynamics (5.4). Finally, section 5.5 shows how factorial retesting is not only useful for sharpening and confirming results gained through other tracks of analysis, but also provides new insights into the root causes of non-conformances.
Sanofi and its suppliers primarily measure production process health by tracking the number of defective mechanics per batch over time. When there is an outbreak of more rejected batches than
normal, further analysis into batch mean injection force takes place, but this is limited by the fact that high injection force mechanics are not correlated with overall batch means. Occasionally statistical testing is used to compare batches before, during, and after a period of higher reject rates, but these have all shown no significant change, again because the focus is on the batch mean. More rigorous application of statistical process control (SPC) tools could be helpful in tracking and controlling process health. However, there is enough ambiguity in the system that information on overall process health cannot drill down to the specific issue which causes an individual mechanic to demonstrate high injection force. It is generally understood that creation of defective mechanics is out of control; the main issue is understanding what is wrong with individual mechanics. For these reasons, defect root cause analysis is the focus and SPC will not be covered in this thesis.
5.1 Defective Parts Analysis
The simplest way to search for the causes of high injection forces is to open up the mechanic and examine the parts for injection molding defects and other failures. Disassembly of a mechanic is a manual process which takes less than ten minutes; with the comparatively low numbers of total defective mechanics, the disassembly time is not a serious constraint. Of greater concern is the likelihood of damaging components while opening. As a safety feature for patients, disposable insulin injection devices are designed specifically to prevent opening, making it difficult for technicians investigating a part to open without causing serious damage to certain components. This damage potentially obscures or confounds the true root cause. Furthermore, with different people opening devices and originally lacking a standard method, there has often been significant variability in the amount of damage caused by disassembly. This heightens the chance that the cause of high injection force will be attributed to the wrong component or unable to be found at all. With the advent of a focused task force on this issue, an improved method for mechanic opening with minimal damage has been developed, although it has yet to be fully adopted by all stakeholders.
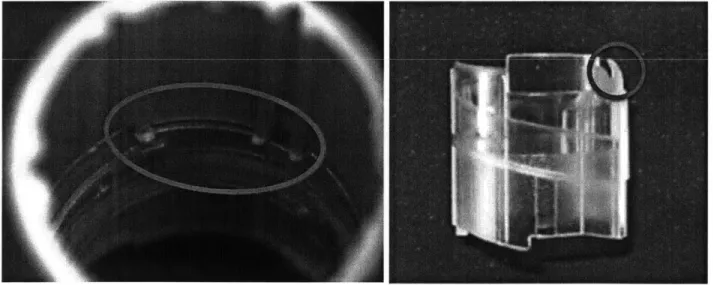
Once a non-conforming mechanic has been opened, each component is visually inspected, with the use of a magnifying glass helping to pick out less noticeable defects. The cavity numbers for the injection mold dies are stamped into each component, so a fault from molding (e.g. short shot or flash) can be traced back to a specific manufacturing part. Defects which are clearly not molding errors are more difficult to track down as they can be introduced in material handling, the automated positioning process, or any one of multiple final assembly steps at the supplier's manufacturing facility. Regardless, once the high injection force can be directly attributed to a physical defect, the analysis process has been successful for Sanofi, as specific feedback can be given to suppliers to track down the production problem which caused the defect. Figure 6 shows examples of a molding defect (L) and an assembly or handling defect (R).
Figure 6. Examples of physical defects which cause high injection forces
For variations in size or shape which are not visible during manual inspection, Sanofi can use x-ray computed tomography (CT) scans. Perhaps most commonly recognized for wide usage in medical fields,
CT scans enable very exact views of the inside of objects without opening them. Rotating 2D scans
design and tolerances. The slightest deviation from specifications can then be identified. The problem with using CT scans is the length of time required for setup and the fact that its resources are shared across multiple departments. It is not possible to scan every single component of every non-conforming device, so only the most conspicuous components receive scanning.
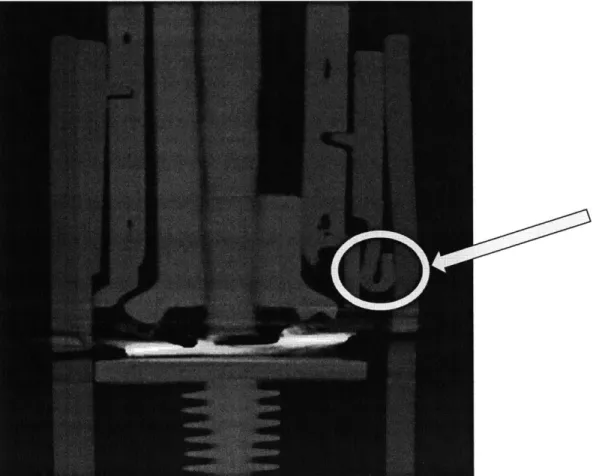
Computed tomography scans are not limited to single part analysis. The same machine can be used to examine mechanics before disassembly. This enables checking for misalignment or component defects that are at risk of being masked by the disassembly process. The example in Figure 7 below shows a component defect which is the clear root cause of the high injection force. While CT scans of full mechanics can reveal interference that would be lost once the part is opened, the severity of interference or misalignment may be difficult to judge.
5.2 Component Tracking
If the root cause of high injection force is not readily apparent from examining the mechanic, tracking its
production from start to finish can offer clues as to where the problem originated. At the highest level this consists of checking which supplier production line assembled the mechanic and whether there has
been a recent increase in the number of failures produced on that line. By lining up batch production dates with known process changes or other issues, the root causes of certain defects can be surmised. To give a hypothetical example: a gripper for component X was replaced on a certain day because of
insufficient gripping force leading to assembly misalignment; this points to problems with alignment being the cause of defective mechanics produced right before the issue was found and rectified.
Deeper investigation is also possible as individual parts are labeled with the injection mold cavity which was used to produce them. Comparing the cavity numbers of recent rejected parts reveals potential mold problems for further investigation. Discovering that recent defective mechanics contained several components made on the same mold or molds enables investigators to focus their efforts and pay special attention to these suspicious molds. The huge number of molds used in production precludes their examination beyond normal preventative maintenance unless there is evidence such as high defect
rates from a single cavity.
If individual component investigation and tracking of process changes and component histories does not
discover the root cause of high injection forces, more analytical tools can be brought to bear as will be discussed next.
5.3 Frequency Analysis
An application of frequency analysis is transforming time domain data into the frequency domain. The Fourier transform is a mathematical algorithm which accomplishes this. For the purposes of this work,
made up of periodic functions which represent the various part interactions causing the signal. Bearing fault analysis in machinery utilizes this method, often with sound data, in order to determine which
bearing in a piece of equipment has worn down. The rotational movement of bearings creates a sound which changes - increases in magnitude - if a bearing is worn out. However, in a complex machine with
many bearings rotating at different frequencies, finding the problem can be time-consuming and difficult. By transforming data into the frequency domain, the major contributor(s) can be easily identified. The component frequencies of the machine's sound are separated, and peaks clearly show which frequency, and thus which rotational speed and which bearing, has worn out.
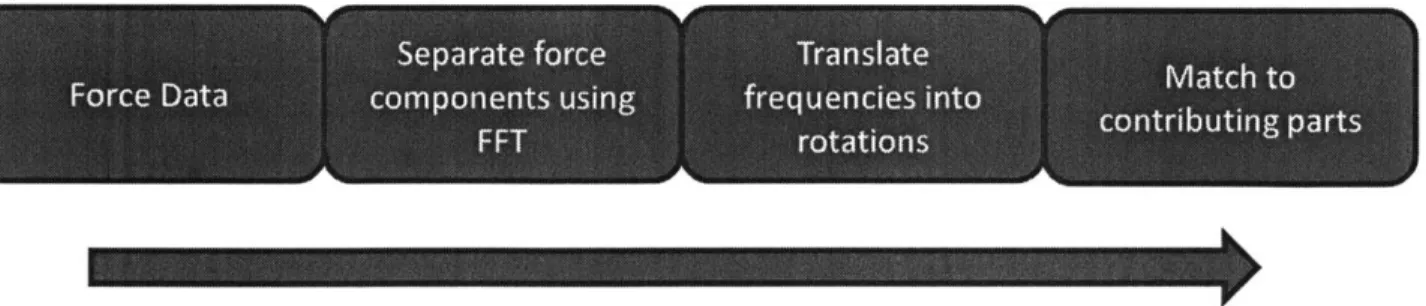
Following is an explanation of how frequency analysis can be used to identify the important component interactions within a plastic IM assembly. Raw force data is transformed using Microsoft Excel's Fast Fourier Transform (FFT), which separates out important injection force components by their frequency. The important frequencies are then translated into part movements (rotations or linear
reciprocations) over the course of the testing cycle. Important force components can then be matched to contributing parts which have the same movement dynamics identified by the frequency analysis. See Figure 8 below for an overview of this process.
Separate force Translate
Match to
Force Data components using frequencies into cnrbtn at
FFT rotations
5.3.1 Underpinnings of Frequency Analysis
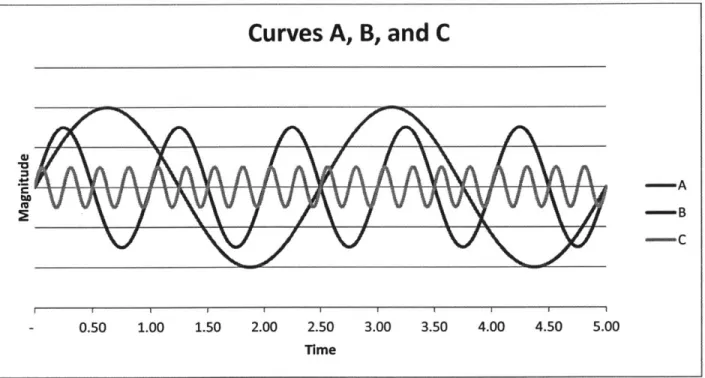
We will start with a hypothetical example before moving on to an actual case from Sanofi. First we have
three curves, A, B, and C (Figure 9) which represent the contributions of three parts, A, B, and C. They
all have different frequencies and amplitudes, showing that the movement of some parts is faster or
slower and requires more or less force.
Curves A, B, and C
-
Y
-A B -C - 0.50 1.00 1.50 2.00 2.50 3.00 3.50 4.00 4.50 5.00 TimeFigure 9. Frequency analysis example -three periodic curves
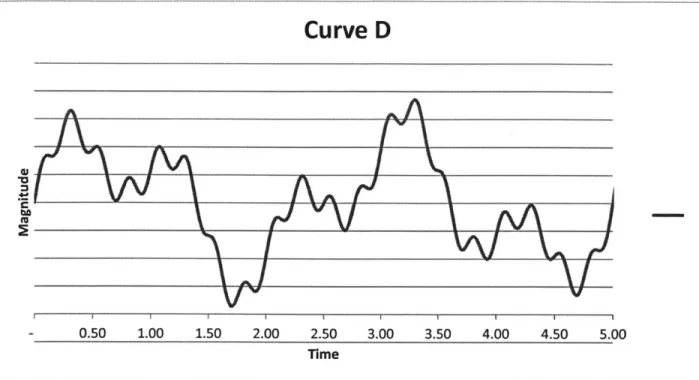
When these three component curves are combined, we get a complex-looking curve with component parts that are not easily recognizable. When just looking at the combined curve in Figure 10 (next page), it would be extremely difficult to identify the specific component curves. This becomes more and more difficult as more components are added.
v I I A rI I
cV
- 0.50 1.00 1.50 2.00 2.50 3.00 3.50 4.00 4.50 5.00
Time
Figure 10. Frequency analysis example - complex curve from superposition of simple periodic curves
Transforming the data from the time domain to the frequency domain makes the component parts
obvious. This can be accomplished simply by using Microsoft Excel's Fast Fourier Transform (FFT), an
algorithm which creates a discrete Fourier transform (DFT) of the data. This gives the complex
coefficients of frequencies corresponding to the input time series data. These complex coefficients can
be converted to magnitudes by taking the square root of the squares of the real and complex parts. The
frequencies shown depend on the rate at which the original data is sampled. In this case, sampling of
example data occurred every .01 seconds, for a frequency of 100Hz. In Figure 11 below, there is clear
symmetry around the folding frequency of 50Hz (half of the sampling frequency). Fourier analysis
provides the complex coefficients for N/2 + 1 frequencies, where N is the number of time domain data
points collected. So the information after 50Hz is extraneous. Please see "Frequency Domain Using
Excel" [12] for a thorough step-by-step walkthrough of using Excel's FFT function to perform this type of
analysis.
Frequency Magnitude
a. I W' M 10 20 0 30 40 50 Frequency 60 70 80 90 100Figure 11. Example frequency analysis - frequency magnitude graph
Zooming in on the Frequency Magnitude graph, the three frequencies of the three component curves become readily apparent; there are peaks at .4Hz, 1Hz, and 4Hz (Figure 12). Comparing with Figure 9 shows that this is correct as curves A, B, and C showed two, five, and twenty peaks in five units of time corresponding to .4Hz, 1Hz, and 4Hz, respectively. Frequency analysis accurately identifies the
component curve frequencies from compound curve data. For the purposes of this work, the location (frequency) of the peaks is more significant than their relative magnitudes.
LL
iiJ
Pertinent Frequencies
0
1 2 3 4 5 6 7 8Frequency
Figure 12. Frequency analysis example - contributing frequencies identified
5.3.2 Normal Device Frequency Spectrum
Applying frequency analysis to the raw data from the Automatic Testing Equipment (ATE) can yield similarly useful results. During the testing sequence, the injection force is measured multiple times across the device's maximum injection amount. The ATE samples the injection force at a rate of 500Hz and each measurement lasts approximately two and a half seconds, with a little less than half a second passing before the ATE fully engages the device mechanism. At that point the injection force
experiences a steep increase before leveling off, and the injection forces remains steady through the end of the test run. This characteristic behavior of a normally functioning subassembly can be seen in Figure 13.2 The force required to operate the mechanic is mainly composed of a constant step with
2 The values for the injection force axis are concealed for confidentiality, but all injection force graphs presented in
some small oscillations. This step response is the baseline injection force due to overcoming the testing machine's resistance and various frictional actions within the device and is approximately the amount of injection force the device is designed to require.
Normal Subassembly
.
0
0
0.5 1 1.5 2 2.5Time (seconds)
Figure 13. Injection force of normally functioning mechanic
Performing spectrum analysis on this data reveals the major contributors to injection force in normal device operation. The FFT function in Excel requires the number of input data points, N, be a power of two (i.e. N = 2 ), so only the data from .5-2.5s are used (approximately two seconds of data recording
sampled at 500Hz easily gives the requisite 1024 data points). This real world data spectrum graph is messier than in the preceding hypothetical example as there are many moving parts which contribute some small amount. Additionally there is random white noise in the measuring electronics and interference from the ATE's electric motor. Figure 14 still shows clear peaks at the frequencies of the periodic force contributors within the mechanic.
Frequency Spectrum of Compliant Device
WA'CU.9A
40 50 60 10 0 20 30 Frequency (Hz)Figure 14. Frequency spectrum of normally functioning mechanic
There are strong spikes in magnitude at frequencies of 2Hz and 40Hz. These correspond to well-understood device interactions of the NS/T13 and the NS/ CL, respectively. Not shown is a very strong spike at OHz, which represents the step response, non-periodic component of injection force. For most devices the step component is the single largest component of injection force and so dominates the frequency-magnitude graphs. It does not show much variation, even for non-conforming mechanics, so it is omitted to make the periodic components easier to pick out. In non-conforming devices it is generally the periodic elements of injection force which show a large increase and are responsible for the high injection forces.
5.3.3 Code E Frequency Analysis
While frequency analysis has been performed on all force curve codes, the examples in this section and the one that follows particularly show the unique advantages this sort of analysis can provide. Using
3 Part names are abbreviated for confidentiality.
L
Code E as a model, this section demonstrates how frequency analysis can identify root causes which were previously unknown. Figure 15 graphs the raw data from a Code E type failure which exceeded the injection force specifications.4 Note that while actual injection force values are removed for
confidentiality, the scale remains the same: this Code E failure exhibits a peak injection force more than twice as high as the normally functioning device.
Code E Force Curve
0
0
0 0.5 1 1.5 2 2.5
Time (seconds)
Figure 15. Code E injection force curve
There is a clear periodicity to the Code E force curve testing data. However, the exact nature of its causes is not readily apparent when the device is opened and examined. Performing frequency analysis reveals the major force contributors. Here in Figure 16, we can see this analysis performed as in the preceding example.
Figure 16. Code E frequency spectrum
A sampling frequency of 500Hz Excel's FFT provides information on the frequency coefficients from 0 to
250 Hz. As to be expected for a physical device, frequencies greater than 50Hz (not shown) do not
contribute significantly - nothing in the device is moving that quickly. Figure 16 has three clear peaks in the lower ranges at approximately 2Hz, 4Hz, and 7Hz. There is also a much smaller but still noticeable peak at 40Hz. The peaks at 2Hz and 40Hz were also present in the normal device, but the one at 2Hz had a significantly lower magnitude. As before, we can use these frequencies to reconstruct the original curve; this will prove that they account for the majority of the measured injection forces. The periodic functions represented by each of these frequencies will have different amplitudes and may be phase shifted as well. Figure 17 shows each of the important contributing curves as well as the combined
Code E Frequency Analysis
@1 to 4' 'U
NR
30 35 40 45 50 0 5 10 15 20 25 Frequencycurve which is the superposition of the contributing curves (note that the vertical offset of these curves has been adjusted in order for easy display in a single graph).
Code E Reconstruction
0
1.
I.--o -- Combined
bie
-- 2Hz -- 4Hz -7Hz - 40Hz 2.4 0.4 0.9 1.4 Time (seconds) 1.9
Figure 17. code E component parts & superposition
In order to compare with the original Code E data, an exponential decay term must be added to each of the periodic functions. This models the "wearing in" of brand new parts as they move against each other for the first time. Matching the combined reconstructed curve with the original Code E data (Figure 18) shows solid correspondence between the two, confirming that the four frequency peaks explain most of the Code E injection force curve. Some causes of variation between the reconstructed curve and the original data include the lack of granularity in Excel's FFT (~.5Hz in this instance) and the fact that only a portion of the characteristic frequencies from the device are being used to model it.
Code E Reconstruction Comparison
L --- CodeE
- Combined 0.4 0.9 1.4 1.9 2.4 TimeFigure 18. Code E original force curve with reconstructed curve superimposed
5.4 Component Dynamics
With the frequency of movement for each of the contributing parts determined, it is necessary to match this to actual mechanic components by examining the device dynamics. First the frequency must be translated into number of peaks during the test. The time over which the force testing data is collected being approximately two seconds, the frequency in Hertz (1/s or peaks/s) is multiplied by two seconds to get the number of peaks per test. This number of force peaks per test corresponds to the rotations or linear oscillations of the component which caused those peaks. For example, a frequency of 40Hz corresponds to a component interaction which occurs 80 times during the force testing.
Table 3. Part interaction movements responsible for high injection force for various force codes.
Code
#of rotations
A 4,8,16,82 C 82 D 4, 8,16,21,82 E 4,9,82 F 4, 8, 12, 16, 82 G 4,16,21,82 V 4, 9,12,16,21,24,82 W 4, 8, 12, 16, 21, 82 X 4,82 Y 4, 8, 74, 78, 82, 86 Normal Device 4,82 ATE 32,64,88
The movement of the mechanic during the test is well defined so the movement of each individual component can then be calculated and matched. For example, the movement of a threaded part is defined by the pitch, which is the distance between the threads. Each time the part completes one rotation, it will move linearly by the pitch distance (Figure 19). Alternatively, if the linear travel distance is known - as is the case with key threaded parts in the insulin injection device - the number of
rotations can be calculated by dividing the distance by the pitch. If there is a defect at that threaded interface, this number of rotations will match with the number of force peaks calculated from the frequency analysis.
This analysis has been performed for all moving part interactions within the insulin injection device. Table 4 shows the number of peaks/rotations for several different interactions. Matching the
information provided in these two tables identifies which specific part interactions are likely responsible for a given high injection force code. One issue that arose is that many of the part interactions have either the same number of rotations/movements or were multiples of one another. This requires extra testing to match force peaks in the data to the correct part interaction, as explained in the next section.
Table 4. Some sample numbers of rotations/oscillations for component interactions
Part Interaction
# of peaks/rotations
Clutch ratchet arms + NS
82
DG+ DB
16
DB + Clutch
8
DB+DS
8
LS
+ Bearing
~80
DS
+DG
4-8
Body +
LS
2.7
DS +
LS
2.7
NS
+TI
4
5.5 Component Interaction Validation
Once the potential problem components have been identified through matching component dynamics to force frequency data, the results need to be validated by retesting those components. By isolating those components from other potential causes, their contribution to high injection force can be confirmed.
The method for doing this is by disassembling the high injection force mechanic, and then reassembling suspect component(s) with all new components into a new mechanic. This mechanic can then be tested on the ATE, and if it shows the same high injection force behavior, the identified suspect component(s) has been confirmed. At this point, these components can be CT scanned to check the exact physical
dimensions which are behind the components' contribution to high injection forces. Testing of all important failure codes was carried out in this way to validate the problem components predicted by the frequency analysis. As a control, mechanics for which the defects are known were also
disassembled, reassembled in their entirety, and retested to show that using the same components will cause the same force curve behavior. Through this testing, the root component causes for many codes was determined.
This retesting also enables checking of force codes which could not be analyzed using frequency analysis because of the non-periodic nature of their force curves. A factorial retesting of the components of such a mechanic can show which components caused the high injection force. In this case, the retesting takes much longer without the frequency analysis predictions, but it can still be quite effective in revealing root causes.
For example, one such non-periodic high injection force occurs in force code H (Figure 20. next page). The sudden peak partway through injection force testing does not seem to match up with any possible component interaction. However, when the components were rebuilt and retested on the ATE, every code H mechanic behaved exactly the same as a perfectly conforming, normal mechanic, with no abnormally high injection force. Code H defects were then narrowed down to a particular ATE which had new software recently installed, and the defects were eventually traced to a small fault in the testing equipment.
Force Curve Type Code H
0 C 0 f-TimeFigure 20. Code H injection force curve
6 Improvement
The process to change an approved medical device design or its manufacturing process is long and difficult, requiring extensive testing and other evidence to prove to regulatory bodies that introducing a change will not pose a danger to patients. Due to time constraints, completing such testing was out of scope for this project; instead a number of smaller tests were run in order to identify potential areas for future research. The focus here is on changes which could make the manufacturing process or injection device design more robust to the most common manufacturing defects which cause high injection forces. In this section, adjustments to the application of lubricant to the mechanic and modifications to key mechanic components will be explored.
6.1 Enhanced Lubrication
In order to help components move easily, a spot of lubricant is used on the most important sliding-rotational interaction. If for some reason this lubricant is missing, the injection force will be much
-1
-W-M-6-M - ll--q---Q
higher, almost always climbing into the blocked range which immediately stops the test. While in-line high speed cameras check for the presence of lubricant on the proper component during automated assembly, it is a yes-no binary check. Neither Sanofi nor its suppliers has exact equipment for measuring the amount of lubricant in an assembled mechanic or even after disassembly, so the effects of variations in the amount of lubricant have not been well understood.
6.1.1 Code C and Lubrication
One of the more common force curves (Code C) has a sharp peak reaching the stiff level as soon as the mechanic is engaged, then injection force drops swiftly down to that of a normal mechanic and
completes the rest of the testing without problems (Figure 21). Subsequent tests show no abnormal forces, while disassembly reveals that lubricant is indeed present.
Force Curve Type Code C
C
0
0.5 1 1.5 2 2.5Time (seconds)
Figure 21. Starting peak force curve (Code C)
The similarities in shape, if not degree, in the Code C curves and those of lubricant lacking mechanics suggest that variations in lubricant amount or placement could be the root cause for these
nonconformances. The very appearance of the curve suggests something of that kind, either of
that snaps into place when enough force is applied. Furthermore, if variations in greasing have such a large effect, there is potential that changes to the greasing process could help all mechanics operate at a lower average injection force. Testing was thus carried out separately on the quantity of lubricant and the amount of spreading over components during its application.
6.1.2 Grease Quantity Testing
For testing quantity of lubricant, the number of grease dots and the length of time the grease applicator nozzle fired was varied along multiple set points. To confirm previous observations that mechanics lacking lubricant usually test as blocked, a number of mechanics were also tested without any lubricant at all. While mechanics completely lacking grease came up blocked per usual, injection force showed increases in average and variance with the amount of grease (Figure 22). This suggests that too much lubricant rather than not enough is the root cause of Code C failure types. More accurate
measurements of the amount of lubricant on a component will need to be developed in order to prove that Code C mechanics have an amount of grease in excess of the norm. This testing does show that the
amount of lubricant must be carefully controlled by suppliers during the assembly process.
Effect of Greasing on Injection Force
-r- Level 1 -- Level 2 -4.-Level 3 -.. -- ---4-Level 4 --- No Grease Mechanic Number
The four levels of greasing shown in Figure 22 above are in order of increasing amounts of lubricant. The two options for increasing the amount are using multiple grease spots and increasing the size of grease
spots. Adding a second grease spot doubles the amount of grease, while increasing the size has a much
smaller effect. Level 1 has one grease spot; Level 2 has one larger spot; Level 3 has two normal sized
spots; and Level 4 has two larger spots. Thus, the difference in grease applied between Levels 1 and 2
above is relatively small, while Level 3 is approximately twice that of Level 1, and Level 4 has twice the lubrication of Level 2.
6.1.3 Grease Distribution Testing
Further testing was carried out with standard amounts of lubricant grease, with only the location and
spread varied. Greased components were manually moved to different set positions to change the
extent of lubricant coverage. At the extreme this involved ensuring that there was lubricant present at
the interaction site as soon as the mechanic was engaged. Some minor modifications of the automated grease application machines would be required in order to implement this in practice at the suppliers. The results of two different levels of grease spreading on the component are compared in Figure 23.
Statistical hypothesis testing (with 95% confidence interval) of the results shows no significant difference in average injection force. One mitigating issue may be that lubricant spreading only
becomes important when parts are at the extremes of allowed tolerances. These results make further efforts on controlling quantity of lubricant a higher priority that ensuring great lubricant spreading; this