An Artificial Intelligence Model to Predict the
Mortality of COVID-19 Patients at Hospital
Admission Time Using Routine Blood Samples:
Development and Validation of an Ensemble Model
The MIT Faculty has made this article openly available.
Please share
how this access benefits you. Your story matters.
Citation
Ko, Hoon et al. "An Artificial Intelligence Model to Predict the
Mortality of COVID-19 Patients at Hospital Admission Time
Using Routine Blood Samples: Development and Validation of an
Ensemble Model." Journal of Medical Internet Research 22, 12
(December 2020): e25442. © 2020 The Authors
As Published
http://dx.doi.org/10.2196/25442
Publisher
JMIR Publications Inc.
Version
Final published version
Citable link
https://hdl.handle.net/1721.1/128948
Terms of Use
Creative Commons Attribution 4.0 International license
Original Paper
An Artificial Intelligence Model to Predict the Mortality of COVID-19
Patients at Hospital Admission Time Using Routine Blood
Samples: Development and Validation of an Ensemble Model
Hoon Ko1*, MSc; Heewon Chung1*, MSc; Wu Seong Kang2*, MD, PhD; Chul Park3*, MD; Do Wan Kim4, MD; Seong
Eun Kim5, MD; Chi Ryang Chung6, MD, PhD; Ryoung Eun Ko6, MD, PhD; Hooseok Lee1, MSc; Jae Ho Seo7, PhD;
Tae-Young Choi8, PhD; Rafael Jaimes9, PhD; Kyung Won Kim10, MD; Jinseok Lee1, PhD
1Biomedical Engineering, Wonkwang University, Iksan, Republic of Korea
2Department of Trauma Surgery, Wonkwang University Hospital, Iksan, Republic of Korea 3Department of Internal Medicine, Wonkwang University Hospital, Iksan, Republic of Korea
4Department of Thoracic and Cardiovascular Surgery, Chonnam National University Medical School, Gwangju, Republic of Korea 5Department of Internal Medicine, Chonnam National University Medical School, Gwangju, Republic of Korea
6Department of Critical Care Medicine, Samsung Medical Center, Sungkyunkwan University School of Medicine, Seoul, Republic of Korea 7Department of Biochemistry, Wonkwang University School of Medicine, Iksan, Republic of Korea
8Department of Pathology, Wonkwang University School of Medicine, Iksan, Republic of Korea
9Biotechnology and Human Systems, Lincoln Laboratory, Massachusetts Institute of Technology, Lexington, MA, United States
10Radiology and Research Institute of Radiology, Asan Medical Center, University of Ulsan College of Medicine, Seoul, Republic of Korea *these authors contributed equally
Corresponding Author: Jinseok Lee, PhD Biomedical Engineering Wonkwang University Iksan Daero Iksan, 54538 Republic of Korea Phone: 82 1638506970 Email: gonasago@gmail.com
Abstract
Background: COVID-19, which is accompanied by acute respiratory distress, multiple organ failure, and death, has spread worldwide much faster than previously thought. However, at present, it has limited treatments.
Objective: To overcome this issue, we developed an artificial intelligence (AI) model of COVID-19, named EDRnet (ensemble learning model based on deep neural network and random forest models), to predict in-hospital mortality using a routine blood sample at the time of hospital admission.
Methods: We selected 28 blood biomarkers and used the age and gender information of patients as model inputs. To improve the mortality prediction, we adopted an ensemble approach combining deep neural network and random forest models. We trained our model with a database of blood samples from 361 COVID-19 patients in Wuhan, China, and applied it to 106 COVID-19 patients in three Korean medical institutions.
Results: In the testing data sets, EDRnet provided high sensitivity (100%), specificity (91%), and accuracy (92%). To extend the number of patient data points, we developed a web application (BeatCOVID19) where anyone can access the model to predict mortality and can register his or her own blood laboratory results.
Conclusions: Our new AI model, EDRnet, accurately predicts the mortality rate for COVID-19. It is publicly available and aims to help health care providers fight COVID-19 and improve patients’ outcomes.
KEYWORDS
COVID-19; artificial intelligence; blood samples; mortality prediction
Introduction
COVID-19 is a highly contagious infection caused by SARS-CoV2. In severe cases, COVID-19 causes acute respiratory distress, multiple organ failure, and, eventually, death [1]. As of November 2020, COVID-19 cases and deaths are approaching 60 million and 1.5 million, respectively, worldwide.
In a pandemic situation, the most important issue in the management of patients diagnosed with COVID-19 is to select patients at risk of high mortality in the early period of disease and to provide appropriate treatments [2]. Particularly, the condition of patients at high risk can rapidly deteriorate. Some papers reported that deceased COVID-19 patients initially had mild symptoms but suddenly transitioned to a critical stage, leading to death [3-5]. In Italy, 75% of deceased patients showed mild symptoms, such as fever, dyspnea, and cough, at admission to the hospital [1]. Thus, the development of a prognostic model to predict mortality as early as possible is very critical. In this pandemic crisis, the shortage of resources and medical staff causes big problems in the health care system. Accordingly, artificial intelligence (AI) can aid in the management of COVID-19 patients. A recent research study has developed an AI prediction model of mortality based on blood test results [6]. In this study, Yan et al initially considered 73 blood-borne markers for the mortality prediction model; finally, three blood biomarkers were selected, including lactate dehydrogenase (LDH), lymphocyte, and high-sensitivity C-reactive protein (hs-CRP). This model predicted mortality with 90% accuracy based on a decision tree using an XGBoost classifier [7] to analyze feature importance.
However, Yan et al’s study has drawbacks. First, the three biomarkers derived from the XGBoost-based feature selection may not be the best choices. Feature importance provides a score indicating how each feature contributes in the construction of decision trees within the model. However, due to the stochastic nature of machine learning algorithms, each feature’s importance score may vary. Moreover, in decision tree algorithms, such as an XGBoost and a random forest (RF), when multiple features have the same gain during the split, a branch in a tree is made by randomly selecting features among them. Second, numerous studies have shown that the disease progression of COVID-19 is not only associated with LDH [2,8-11], lymphocyte [12,13], and hs-CRP [2,10,14-17] but also with other blood-based biomarkers, such as neutrophil counts [16,18,19], albumin [18,20,21], and prothrombin activity
[18,22-24]. In our study, we developed an AI model using 28 biomarkers for predicting the mortality of COVID-19 patients. Third, the three biomarker-based AI models [6] predicted mortality 10 days before a patient’s recovery or death. These limitations show that the model may not work for COVID-19 patients who have just been diagnosed and hospitalized. Therefore, in this study, we aimed to develop an AI model based on a blood test for mortality prediction at the early stage of hospital admission. We deployed the developed AI model on a public website so that all patients and medical staff could predict mortality using individual patient blood test results.
Methods
Data Sets
This study was approved by Wonkwang University Hospital (WKUH), Chonnam National University Hospital (CNUH), and Samsung Medical Center (SMC) in Korea. Informed consent was waived. For training data, we used the blood test results obtained from 375 COVID-19 patients collected between January 10, 2020, and February 24, 2020, in Tongji Hospital, Wuhan, China [6]. Of these, 14 patients without a blood test within 1 day after the hospital admission were excluded, and 361 patients—212 males (58.7%) and 149 females (41.3%); mean age 58.9 years (SD 16.5)—were included. As presented in Multimedia Appendix 1, the training data set of 361 patients included the admission date and time, discharge date and time, age, gender, mortality outcome, and results of blood tests obtained within 24 hours after hospital admission. For testing data, we collected medical records on COVID-19 patients (N=106) from three medical institutions: CNUH (85/106, 80.2%), WKUH (11/106, 10.4%), and SMC (10/106, 9.4%). The blood laboratory results from these 106 COVID-19 patients were collected between February 2020 and July 2020. Similar to the training data, we used the blood test data obtained within 24 hours after hospital admission (see Multimedia Appendix 2). For summarizing the statistics of the training and testing data sets, the patients were classified into a survivor group and a deceased group in the training and testing data sets. The number of blood tests differed across patients and institutions. The mean numbers of blood tests per patient were 61.21 (range 24-73) in the training data set and 35.36 (range 30-55) in the testing data set. The mean numbers of hospitalization days were 13.82 (survivor group) and 8.16 (deceased group) in the training data set and 18.21 (survivor group) and 17.98 (deceased group) in the testing data set (see Table 1).
Table 1. Statistical summary of the training and testing data sets.
Testing data set (N=106) Training data set (N=361)
Patient data Total (N=106) SMCc(n=10) WKUHb(n=11) CNUHa(n=85) Tongji Hospital Number of patients, n (%) 106 (100) 10 (100) 11 (100) 85 (100) 361 (100) Total 104 (98.1) 10 (100) 9 (82) 85 (100) 195 (54.0) Survived 2 (1.9) 0 (0) 2 (18) 0 (0) 212 (58.7) Deceased Gender, n (%) 42 (39.6) 3 (30) 5 (45) 34 (40) 212 (58.7) Male 64 (60.4) 7 (70) 6 (55) 51 (60) 149 (41.3) Female Number of hospitalization days, mean (SD) 18.21 (11.46) 30.95 (23.03) 28.16 (11.13) 15.06 (7.90) 13.82 (6.38) Survived 17.98 (11.83) N/A 17.98 (11.83) N/Ad 8.16 (7.38) Deceased 46.73 (22.28) 58.20 (21.05) 56.27 (23.00) 44.14 (21.81) 58.91 (16.49) Age in years, mean (SD)
Number of blood biomarkers collected 30-55 30-40 30-52 32-55 24-73 Min-max 35.36 (4.19) 34.20 (3.16) 35.00 (5.31) 36.89 (4.11) 61.21 (6.92) Mean (SD) a
CNUH: Chonnam National University Hospital.
bWKUH: Wonkwang University Hospital. c
SMC: Samsung Medical Center.
dN/A: not applicable; there were no deceased patients in the testing data set at this institution.
Feature Selection
Given the total 73 blood biomarkers from the training data, we performed an analysis of variance (ANOVA), which uses an F test to check for any significant difference between the two groups (ie, deceased vs survivor) according to each blood biomarker. For the feature selection, we also considered the available data rate (ADR), which refers to how much blood biomarker data were available for training the AI model. This is calculated as
where Npatients is the total number of patients (N=361) and
Nbiomarkeris the number of patients having each of the specific biomarker data.
Based on the ANOVA, we first selected the top 32 biomarkers corresponding to P values less than 10–5. Subsequently, we excluded four biomarkers with ADR values of less than 90%. Table 2summarizes the final selection of 28 biomarkers with the corresponding ANOVA P values and ADR values. The ANOVA P values and ADR values for all 73 biomarkers in the training data set are summarized in Multimedia Appendix 3, Table S1. The sample distributions of the selected 28 biomarkers in the survivor and deceased groups are presented in Multimedia Appendix 3, Figure S1.
Table 2. List of 28 blood biomarkers selected for the artificial intelligence model training.
ADRb, % ANOVAaP value
Blood biomarker Biomarker index No.
96.95 2.44×10−46 Lymphocytes 1 96.68 5.65×10−43 Neutrophils 2 96.12 2.90×10−37 Albumin 3 96.12 4.18×10−36 Lactate dehydrogenase 4 96.68 3.54×10⁻³⁵ Neutrophil count 5 94.74 8.38×10⁻³⁵
Hypersensitive C-reactive protein 6 94.18 3.20×10⁻²⁶ Prothrombin activity 7 95.29 2.24×10⁻¹⁹ Calcium 8 96.12 3.29×10⁻¹⁷ Urea 9 96.12 5.05×10⁻¹⁷
Estimated glomerular filtration rate 10 96.95 1.09×10⁻¹⁴ Monocytes 11 96.12 6.06×10⁻¹³ Globulin 12 96.68 2.07×10⁻¹² Eosinophils 13 93.63 2.39×10⁻¹¹ Glucose 14 92.24 8.43×10⁻¹⁰
Red blood cell distribution width (RDW) 15 96.12 2.68×10⁻⁹ HCO3−(bicarbonate) 16 92.24 3.06×10⁻⁹ RDW standard deviation 17 96.68 1.46×10⁻⁸ Platelet count 18 92.24 1.92×10⁻⁷
Mean platelet volume 19
92.24 2.02×10⁻⁷
Platelet large-cell ratio 20 94.18 3.42×10⁻⁷ Prothrombin time 21 96.12 5.29×10⁻⁷ Total protein 22 92.24 6.98×10⁻⁷
Platelet distribution width 23 96.12 1.01×10⁻⁶ Aspartate aminotransferase 24 92.24 1.49×10⁻⁶ Thrombocytocrit 25 92.24 2.90×10⁻⁶ Eosinophil count 26 96.12 8.27×10⁻⁶ Alkaline phosphatase 27 92.24 2.65×10⁻⁵
International standard ratio 28
a
ANOVA: analysis of variance.
bADR: available data rate.
Preprocessing
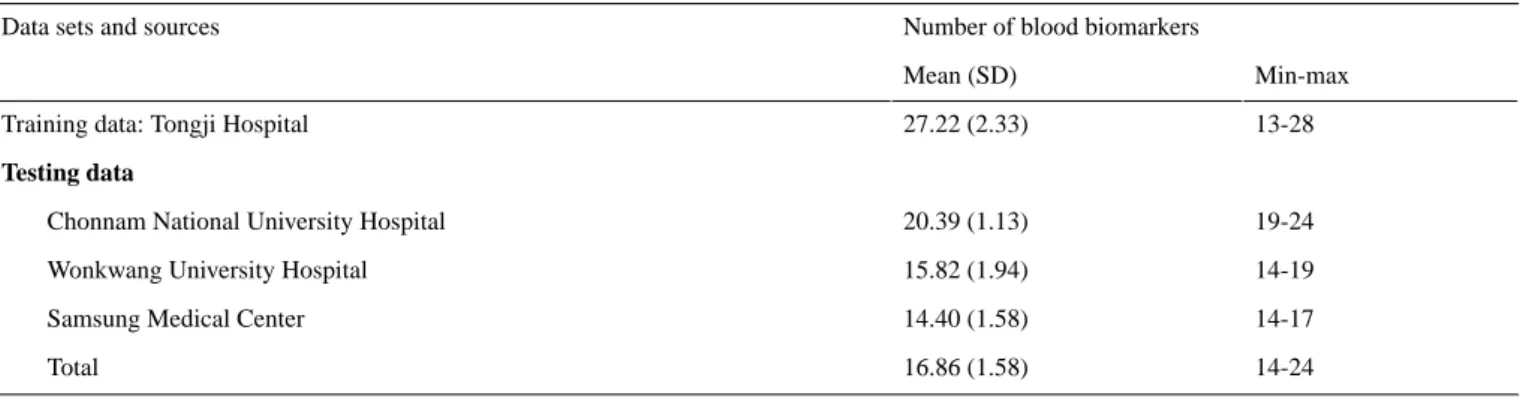
Given the selected 28 biomarkers, the mean number of available biomarkers per patient was 27.22 (SD 2.33) for the training data and 16.86 (SD 1.58) for the testing data, as summarized in Table
3. To handle the missing data, we calculated the mean value from the training data for each biomarker and replaced the missing data with the mean value for the training and testing data sets. We then added two more features (ie, age and gender) to the 28 biomarkers and trained our AI model using 30 features.
Table 3. Number of available blood biomarkers per patient for the artificial intelligence model training.
Number of blood biomarkers Data sets and sources
Min-max Mean (SD)
13-28 27.22 (2.33)
Training data: Tongji Hospital
Testing data
19-24 20.39 (1.13)
Chonnam National University Hospital
14-19 15.82 (1.94)
Wonkwang University Hospital
14-17 14.40 (1.58)
Samsung Medical Center
14-24 16.86 (1.58)
Total
With the 30 features, we performed data set standardization, which is a common requirement for machine learning estimators. The standardization changes the data distribution of each feature with zero mean and standard deviation of 1 as
where mean(train) and SD(train) are the mean and standard deviation values, respectively, for each feature from the training data. The standardization was applied to the training and testing data sets.
Development of an Ensemble AI Model
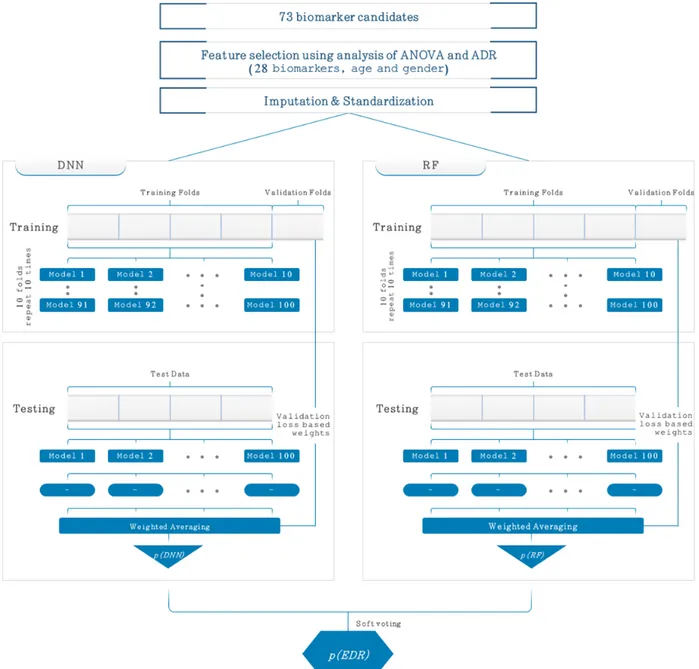
As illustrated in Figure 1, the new ensemble AI model is composed of a 5-layer deep neural network (DNN) and RF
model. Our ensemble AI model was named as EDRnet (ensemble learning model based on DNN and RF models). The 5-layer DNN was comprised of an input layer, three fully connected (FC) layers, and an output layer. The input layer contained 30 features, including 28 biomarkers, age, and gender. The input layer was fed into three FC layers in a series, each of which consisted of 30, 16, and 8 nodes. To alleviate the overfitting issue, we applied a dropout rate of 0.3. Then, the last FC layer was fed into a softmax layer, which is an output layer providing the probabilities for the patient mortality. Figure S2 in Multimedia Appendix 3shows our DNN model and its printed textual summary run on Keras, where the total number of parameters (ie, weights and biases) was 1571.
Figure 1. Proposed ensemble model (EDRnet) composed of a 5-layer deep neural network (DNN) and random forest (RF) model for the mortality
prediction. In the training of both models, a 10-time-repetition 10-fold stratified cross-validation was separately performed, and the predicted mortality probabilities of the DNN model, p(DNN), and the RF model, p(RF), were calculated. The final predicted mortality probability of the ensemble model, p(EDR), was obtained by soft voting based on the p(DNN) and the p(RF). ADR: available data rate; ANOVA: analysis of variance; EDRnet: ensemble learning model based on DNN and RF models.
For the 5-layer DNN, a 10-time-repetition 10-fold stratified cross-validation was performed to confirm the model’s generalization ability. The training data (N=361) were randomly shuffled and partitioned into 10 equal subgroups in a stratified manner. Of the 10 subgroups, a single subgroup was retained as the validation data set for testing the model, and the remaining nine subgroups were used as the training data set. The process was then repeated 10 times, with each of the 10 subgroups used exactly once as the validation data set. By repeating this stratified 10-fold cross-validation process 10 times, a total of 100 models from the 5-layer DNN were derived. Then, we ensembled the models with the weighted average as
where pm(DNN) is the predicted mortality probability value from the mthmodel of the DNN, p(DNN) is the ensemble result corresponding to the predicted mortality prediction probability, and m(DNN) is the normalized weight value for the m
th model. We obtained the normalized weight value m(DNN) as
where the weight wm(DNN) was obtained using the validation loss from the mthmodel, lm(DNN), as
Along with the 5-layer DNN, we separately trained an RF model. For the RF model, 100 decision trees were trained with a maximum depth of 4 and maximum feature number of 5. Similar to the 5-layer DNN, we performed a 10-time-repetition 10-fold stratified cross-validation and ensembled the 100 models with the weighted average as
where pm(RF) is the predicted mortality probability value from the mth model of the RF, p(RF) is the ensemble result corresponding to the predicted mortality prediction probability, and m(RF) is the normalized weight value for the m
th model. We obtained the normalized weight value mas
where the weight wm(RF) was obtained using the validation loss from the mthmodel, lm(RF), as
Given the two ensemble results p(DNN) and p(RF), we finally obtained the final predicted mortality probability value using soft voting. Based on the average of the two probability values p(DNN) and p(RF), if the value is greater than or equal to 0.5, then the prediction result represents death; otherwise, it represents survival.
Implementation
We implemented and trained EDRnet using TensorFlow, version 1.13.1 for graphics processing unit (GPU), and Keras, version 2.2.4 for GPU. NumPy, version 1.16.4; Pandas, version: 0.25.3; Matplotlib, version 3.1.2; and scikit-learn, version 0.22.1, were used to build the model and analyze the results. We trained the models with the Adam optimizer and a binary cross-entropy cost function in equation 9 with a learning rate of 0.0001 and a batch size of 64 on the NVIDIA GeForce GTX 1080 Ti GPU as
where yiis the label (ie, 1 for deceased and 0 for survived) and
p(yi) is the predicted probability of each patient being deceased for the batch size N number of patients.
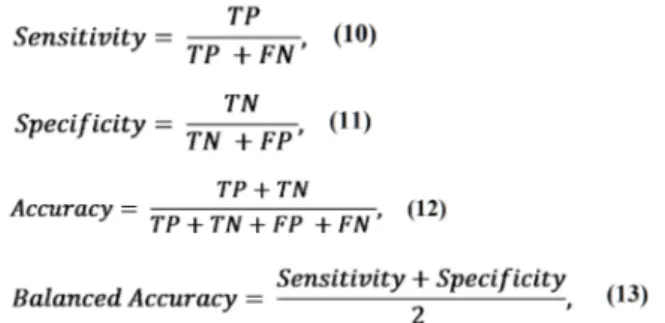
Performance Evaluation of AI Models
To evaluate the performance of the AI models in predicting mortality, we used the sensitivity, specificity, accuracy, and balanced accuracy metrics, defined as
where TP, TN, FP, and FN represent the true positive, true negative, false positive, and false negative, respectively. In the training data set, the prediction performance of the AI models was evaluated based on a 10-time-repetition 10-fold stratified cross-validation. In the testing data set, the prediction performance of the AI models was independently evaluated. To compare the performance of our proposed EDRnet model with those of other external AI models, we separately trained the models of XGBoost and AdaBoost (AB), each of which was evaluated as a single model and as an ensemble model combined with DNN, resulting in four models: XGBoost, AB, ensemble with DNN and XGBoost (EDX), and ensemble with DNN and AB (EDA). For the training of these models, we searched the optimal hyperparameters providing the highest validation accuracy value, as presented in Multimedia Appendix 3, Table S2. In addition, we adopted a recently published AI model by Li et al [6] using a decision tree via an XGBoost-based feature selection for performance comparison. All five external AI models were evaluated using our testing data set of 106 patients.
Results
The cross-validation of RF, DNN, and our ensemble model EDRnet showed that the accuracy on the validation data set is 89% for RF, 92% for DNN, and 93% for EDRnet. Thus, EDRnet provides the highest sensitivity, specificity, accuracy, and balanced accuracy values (see Table 4).
Table 4. Cross-validation accuracy comparison.
Cross-validation results (N=361), mean (SD) Model Balanced accuracy Accuracy Specificity Sensitivity 0.89 (0.04) 0.89 (0.04) 0.89 (0.07) 0.89 (0.06) Random forest 0.92 (0.06) 0.92 (0.04) 0.93 (0.04) 0.91 (0.06)
Deep neural network
0.93 (0.05) 0.93 (0.03)
0.93 (0.03) 0.92 (0.05)
EDRneta
Moreover, we applied EDRnet to 106 Korean patients as an independent testing data set to check the TP, TN, FP, FN, sensitivity, specificity, accuracy, and balanced accuracy. The results show a sensitivity of 100%, specificity of 91%, accuracy of 92%, and balanced accuracy of 96%, indicating that the model
trained and validated on Chinese patient data can be applied to Korean patients for mortality prediction (see Table 5). The computational times of DNN and RF in EDRnet for the training were 796 and 126 seconds, respectively. The overall computational time for the testing of EDRnet was 72 seconds.
Table 5. Test results from our proposed EDRnet (ensemble learning model based on deep neural network and random forest models) model.
Balanced accuracy Accuracy Specificity Sensitivity True positive, % False negative, % False positive, % True negative, % Testing data Model 0.93 0.93 0.93 N/Ab 0 0 6 79 CNUHa EDRnet 0.89 0.82 0.78 1.00 2 0 2 7 WKUHc EDRnet 0.90 0.90 0.90 N/A 0 0 1 9 SMCd EDRnet 0.96 0.92 0.91 1.00 2 0 9 95 Total EDRnet a
CNUH: Chonnam National University Hospital.
bN/A: not applicable. c
WKUH: Wonkwang University Hospital.
dSMC: Samsung Medical Center.
Next, we summarized the performance comparison results between XGBoost, AB, RF, DNN, EDX, EDA, Li et al’s model [6], and EDRnet. Considering all variables, EDRnet provided the highest prediction performance. Indeed, the balanced accuracy was 88% with XGBoost, 89% with AB, 92% with RF,
71% with DNN, 88% with EDX, 71% with EDA, 67% with Li et al’s model [6], and 96% with EDRnet. Notably, the accuracy of Li et al’s model was only 36%, indicating that a few blood markers may not be sufficient to predict patient mortality (see Table 6).
Table 6. Comparison of the performance of various methods.
Balanced accuracy Accuracy Specificity Sensitivity True positive, % False negative, % False positive, % True negative, % Model 0.88 0.77 0.77 1.00 2 0 24 80 XGBoost 0.89 0.78 0.78 1.00 2 0 23 81 AdaBoost 0.92 0.84 0.84 1.00 2 0 17 87 Random forest 0.71 0.90 0.91 0.50 1 1 9 95
5-layer deep neural net-work (DNN) 0.88 0.77 0.77 1.00 2 0 24 80 DNN + XGBoost 0.71 0.91 0.92 0.50 1 1 8 96 DNN + AdaBoost 0.67 0.36 0.35 1.00 2 0 68 36 Li et al’s model [6] 0.96 0.92 0.91 1.00 2 0 9 95 DNN + random forest (EDRneta)
aEDRnet: ensemble learning model based on DNN and random forest models. Our proposed EDRnet model used 28 blood biomarkers for prediction, but it does not require all 28 blood biomarkers. In our testing data sets, EDRnet training was validated using available biomarkers, ranging from 14 to 24, for each patient (see Figure 2). The results reveal that the majority of the patients had 19 to 21 available biomarkers (ie, 19 in 15 patients, 20 in
41 patients, and 21 in 22 patients) with a similarly high prediction accuracy (ie, 93%, 95%, and 86%, respectively). For the patients with 17 and 18 available biomarkers, the accuracy was 75% and 50%, respectively. By contrast, the patients with 14 to 16 biomarkers showed a high accuracy ranging from 83% to 100%.
Figure 2. Accuracy with the number of available blood biomarkers from the 106-patient testing data set.
To further investigate the effect of the number of available biomarkers, we estimated the accuracy values according to the number of available biomarkers (see Figure 3). For the estimation, we randomly selected 1 to 20 biomarkers from all of the testing data points and tested the model with a 100-time repetition. When randomly selecting biomarkers, only samples
where the actual available number of biomarkers was equal to or greater than the number of randomly selected biomarkers were simulated. The results show that accuracy increases with the number of available biomarkers until reaching 19 biomarkers.
Figure 3. Estimated accuracy values according to the number of available biomarkers. Red circles represent the median. The bars at the top and bottom
represent the 75th and 25th percentiles, respectively. The blue rectangles at the top and bottom represent the 90th and 10th percentiles, respectively. The blue diamonds at the top and bottom represent the 95th and 5th percentiles, respectively.
Furthermore, our developed AI model, EDRnet, was successfully deployed on a public website [25] so that anyone can predict mortality using individual blood test results. The web application provides predicted mortality probability, as shown in Figure 4. A user inputs his or her blood sample results (see Figure 4a), and then the predicted mortality results are
presented (see Figure 4b). Currently, the web application does not store any information entered by users. However, we consider and plan to store information entered by users on agreement to improve the AI model via a real-time learning process.
Figure 4. Deployed web application, BeatCOVID19 [25]: (a) input windows where a user inputs his or her blood sample results and (b) the predicted mortality results after entering the blood sample results.
Regarding clinical characteristics (see Table 7), there were no significant differences in comorbidity. In terms of initial symptoms, the deceased group had more frequent dyspnea symptoms than the survivor group (66.7% vs 16.8%; P=.04). All patients from the deceased group required oxygen supply. The deceased group had more frequent altered mentality than the survivor group (50.0% vs 1.0%; P=.02). There was no
significant difference in terms of antiviral drugs (ie, lopinavir or ritonavir, chloroquine or hydroxychloroquine, ribavirin, remdesivir, and oseltamivir) or anti-inflammatory drugs (ie, interferon, dexamethasone, and methylprednisolone) between the deceased and survivor groups. However, the deceased group received more antibiotics or combination therapy.
Table 7. Clinical characteristics of the patient groups from the testing data set. P value Total (N=106) Survivor group (n=104) Deceased group (n=2) Characteristics Comorbidity, n (%) >.99 10 (9.4) 10 (9.6) 0 (0) Diabetes mellitus >.99 8 (7.5) 8 (7.7) 0 (0) Asthma >.99 0 (0) 0 (0) 0 (0)
Chronic obstructive pulmonary disease
>.99 3 (2.8)
3 (2.9) 0 (0)
Coronary heart disease
>.99 1 (0.9) 1 (1.0) 0 (0) Cardiovascular disease >.99 1 (0.9) 1 (1.0) 0 (0)
Chronic kidney disease
>.99 0 (0)
0 (0) 0 (0)
Chronic liver disease
.11 4 (3.8)
3 (2.9) 1 (50)
Congestive heart failure
>.99 3 (2.8) 3 (2.9) 0 (0) Cancer Initial symptom, n (%) .61 61 (57.5) 59 (56.7) 2 (100) Fever >.99 47 (44.3) 46 (44.2) 1 (50) Cough .04 20 (18.2) 18 (16.8) 2 (100) Dyspnea >.99 11 (10.0) 11 (10.3) 0 (0) Diarrhea >.99 26 (23.6) 26 (24.3) 0 (0) Myalgia
Initial vital sign, mean (SD)
.97 128.0 (18.4)
128.0 (18.5) 127.5 (17.7)
Systolic blood pressure (mm Hg)
.64 78.7 (12.8)
78.8 (12.8) 74.5 (10.6)
Diastolic blood pressure (mm Hg)
.34 84.4 (17.8)
84.2 (17.7) 96.5 (24.7)
Heart rate (per minute)
.43 20.4 (4.3)
20.2 (4.1) 29.5 (10.6)
Respiration rate (per minute)
.02 2 (1.9) 1 (1.0) 1 (50) Altered mentality, n (%) Oxygen requirement, n (%) .07 83 (78.3) 83 (79.8) 0 (0) No oxygen supply .69 16 (15.1) 15 (14.4) 1 (50) Conventional oxygen >.99 3 (2.8) 3 (2.9) 0 (0)
High-flow nasal cannula
>.99 0 (0) 0 (0) 0 (0) Noninvasive ventilation .11 4 (3.8) 3 (2.9) 1 (50) Mechanical ventilation >.99 1 (0.9) 1 (1.0) 0 (0)
Extracorporeal membrane oxygenation
Pharmacologic agent, n (%) .16 32 (30.2) 30 (28.8) 2 (100) Lopinavir or ritonavir >.99 7 (6.6) 7 (6.7) 0 (0) Chloroquine or hydroxychloroquine >.99 0 (0) 0 (0) 0 (0) Ribavirin .99 0 (0) 0 (0) 0 (0) Remdesivir .99 2 (1.9) 2 (1.9) 0 (0) Oseltamivir >.99 0 (0) 0 (0) 0 (0) Interferon >.99 1 (0.9) 1 (1.0) 0 (0) Dexamethasone >.99 4 (3.8) 4 (3.8) 0 (0) Methylprednisolone .001 10 (9.4) 8 (7.7) 2 (100) Antibiotics .02 17 (16.0) 15 (14.4) 2 (100) Combination
Discussion
Principal Findings
Our new AI model, EDRnet, was able to predict the mortality of COVID-19 patients using 28 blood biomarkers obtained within 24 hours after hospital admission. In the independent testing data sets, EDRnet showed excellent prediction performance with high sensitivity (100%), specificity (91%), and accuracy (92%). We were able to improve the prediction performance by adopting the ensemble approach combining DNN and RF models. Of note, EDRnet was developed by training with Chinese patients’ data and testing with Korean patients’ data.
EDRnet has several advantages. First, EDRnet can predict which patients are at a high risk of mortality in the early stage of hospital admission (ie, within 24 hours after admission). This is a substantial improvement compared to the prior AI prediction model reported by Yan et al, which predicted mortality 10 days before the occurrence of survival or death [6]. The mortality prediction at the time of admission can be substantially informative for clinicians because the critical time regarding disease progression is 10 to 14 days from the onset of symptoms, according to previous studies [13,16,26]. EDRnet can provide treatment priority guidance regarding who should be treated intensively. Second, EDRnet only uses blood biomarkers to predict mortality. In general, COVID-19 patients get blood laboratory tests at the time of hospital admission [9,27]. Blood biomarkers are objective indices that are used to estimate patients’ conditions in a quantitative manner, which may be beneficial to assure the reliability of the AI model. We did not include subjective biomarkers, such as symptoms, nor predisposing factors, such as underlying comorbidities, because these indices are difficult for quantification and may show high variability between patients. Third, the clinical meaning and significance of blood biomarkers used in our EDRnet model have been well investigated through many prior clinical studies. Thus, the AI’s predicted mortality results are explainable and easily understood by doctors. Furthermore, several major blood biomarkers are used in our EDRnet model.
The hematological changes in lymphocytes, neutrophils, monocytes, eosinophils, and platelets are common, as these changes are related to viral replication and hyperinflammation in COVID-19 infection [12,13]. In severe cases, the infiltration and sequestration of CD4+/CD8+ T cells occurred, leading to a decrease in the peripheral lymphocytes. Neutrophil counts [19-21] were significantly higher in the severe group than in the mild group. Platelet count, platelet volume, and platelet large-cell ratio are related to COVID-19 infection because immunologic destruction can lead to inappropriate platelet activation and consumption as well as impaired megakaryopoiesis [28-30].
Regarding blood chemistry, hs-CRP is a major biomarker that represents acute phase inflammation [2,10,14-17]. LDH is related to cell damage, so elevated LDH is an independent risk factor for the severity and mortality of COVID-19 [2,8-11].
Hypoalbuminemia [18,20,21], hypocalcemia [31-33], and elevated aspartate aminotransferase [18] are highly associated with severe COVID-19 infection requiring hospitalization in the intensive care unit. Urea and estimated glomerular filtration rate are important lab findings associated with an underlying chronic renal disease, which is a well-known predisposing factor of mortality [34]. In terms of the coagulation profile, COVID-19 generally presents a hypercoagulation state, thus resulting in an elevated prothrombin time and international normalized ratio in severe COVID-19 cases [3,18].
In this study, no significant differences were observed in the use of pharmacologic agents between the deceased and survivor groups except antibiotics and in the use of antiviral drugs, such as remdesivir. Antibiotics or combination therapy is usually used for suspected bacterial superinfection that represents severe diseases. To date, there has been no successfully effective pharmacologic agent to treat COVID-19. The pharmacologic treatment is not significantly related to survival in this study. EDRnet does not require all 28 blood biomarkers for the prediction of mortality. EDRnet worked well as long as there were at least 19 blood biomarkers at the time of admission. Compared to prior AI prediction models for COVID-19 mortality, which used three biomarkers, there might be concern that EDRnet requires too many biomarkers. However, these blood tests are commonly performed in our daily clinical practice for hospitalized patients with COVID-19. If more data are accumulated, then we can reduce the number of blood biomarkers for mortality prediction.
Limitations and Future Work
Our study has several limitations. First, the number of patients available for testing might be small. According to Johns Hopkins Coronavirus Resource Center, the mortality rate in South Korea is 1.7%. In the testing data set of 106 Korean patients, the mortality rate was 1.9%, which is almost equivalent to the actual mortality rate. It might be necessary to update EDRnet by training with a large population data set from all over the world. To update EDRnet, we made a web application [25] so that anyone can access the model. We believe that opening the AI model to the public is helpful to improve its performance and generalizability. Second, our data did not include other races, such as Caucasian or Middle East Asian. Our future research plan is to establish a real-time AI training system that can continue to train our model using prospectively collected data from all over the world. In addition, we will upgrade the web application so that the database framework allows a user to input his or her blood sample results along with the outcome. Based on the extended data, we will improve EDRnet for better generalization.
Conclusions
In conclusion, our new AI model, EDRnet, was developed to predict the mortality of COVID-19 patients at the time of hospital admission using blood biomarkers only. It is now open to the public with the hope that it can help health care providers fight COVID-19 and improve patients’ outcomes.
Acknowledgments
This work was supported by Korea Medical Device Development Fund grants, funded by the Korean government (the Ministry of Science and ICT; the Ministry of Trade, Industry and Energy; the Ministry of Health and Welfare, Republic of Korea; and the Ministry of Food and Drug Safety) (grant Nos. 202012B04 and NRF-2020R1A2C1014829), and by the Korea Health Industry Development Institute (grant No. HI18C1216). Author RJ is currently an MIT Lincoln Laboratory employee. No Laboratory funding or resources were used to produce the result/findings reported in this publication.
Authors' Contributions
HK and HC carried out the machine learning and deep learning simulation for hyperparameter search and modeling. CP verified blood biomarkers to be applied in COVID-19 patients and wrote an initial draft of the paper. DWK, SEK, CRC, and REK collected and validated the data and performed statistical analyses. HL developed and maintained the web application. KWK, JHS, and TYC validated and confirmed the simulations and helped to draft the manuscript. RJ validated the methodology of machine learning and deep learning techniques. JL and WSK conceived of the study and participated in its design and coordination and wrote the initial manuscript. All authors read and approved the final manuscript.
Conflicts of Interest None declared.
Multimedia Appendix 1 Training data set.
[XLSX File (Microsoft Excel File), 96 KB-Multimedia Appendix 1] Multimedia Appendix 2
Testing data set.
[XLSX File (Microsoft Excel File), 35 KB-Multimedia Appendix 2] Multimedia Appendix 3
Supplementary figures and tables.
[DOCX File , 876 KB-Multimedia Appendix 3] References
1. COVID-19 Surveillance Group. Characteristics of COVID-19 Patients Dying in Italy: Report Based on Available Data on March 20th, 2020. Rome, Italy: Istituto Superiore di Sanità; 2020. URL: https://www.epicentro.iss.it/coronavirus/bollettino/ Report-COVID-2019_20_marzo_eng.pdf[accessed 2020-12-17]
2. Li C, Ye J, Chen Q, Hu W, Wang L, Fan Y, et al. Elevated lactate dehydrogenase (LDH) level as an independent risk factor for the severity and mortality of COVID-19. Aging (Albany NY) 2020 Aug 14;12(15):15670-15681 [FREE Full text] [doi: 10.18632/aging.103770] [Medline: 32805722]
3. Luo L, Xu M, Du M, Kou H, Liao D, Cheng Z, et al. Early coagulation tests predict risk stratification and prognosis of COVID-19. Aging (Albany NY) 2020 Aug 29;12(16):15918-15937 [FREE Full text] [doi: 10.18632/aging.103581] [Medline: 32860672]
4. Lai C, Liu YH, Wang C, Wang Y, Hsueh S, Yen M, et al. Asymptomatic carrier state, acute respiratory disease, and pneumonia due to severe acute respiratory syndrome coronavirus 2 (SARS-CoV-2): Facts and myths. J Microbiol Immunol Infect 2020 Jun;53(3):404-412 [FREE Full text] [doi: 10.1016/j.jmii.2020.02.012] [Medline: 32173241]
5. Sohrabi C, Alsafi Z, O'Neill N, Khan M, Kerwan A, Al-Jabir A, et al. World Health Organization declares global emergency: A review of the 2019 novel coronavirus (COVID-19). Int J Surg 2020 Apr;76:71-76 [FREE Full text] [doi:
10.1016/j.ijsu.2020.02.034] [Medline: 32112977]
6. Yan L, Zhang H, Goncalves J, Xiao Y, Wang M, Guo Y, et al. An interpretable mortality prediction model for COVID-19 patients. Nat Mach Intell 2020 May 14;2(5):283-288. [doi: 10.1038/s42256-020-0180-7]
7. Chen T, Guestrin C. XGBoost: A scalable tree boosting system. In: Proceedings of the 22nd ACM SIGKDD International Conference on Knowledge Discovery and Data Mining. New York, NY: Association for Computing Machinery; 2016 Presented at: 22nd ACM SIGKDD International Conference on Knowledge Discovery and Data Mining; August 13-17, 2016; San Francisco, CA p. 785-794 URL: https://dl.acm.org/doi/pdf/10.1145/2939672.2939785[doi:
10.1145/2939672.2939785]
9. Henry BM, de Oliveira MHS, Benoit S, Plebani M, Lippi G. Hematologic, biochemical and immune biomarker abnormalities associated with severe illness and mortality in coronavirus disease 2019 (COVID-19): A meta-analysis. Clin Chem Lab Med 2020 Jun 25;58(7):1021-1028. [doi: 10.1515/cclm-2020-0369] [Medline: 32286245]
10. Henry BM, Aggarwal G, Wong J, Benoit S, Vikse J, Plebani M, et al. Lactate dehydrogenase levels predict coronavirus disease 2019 (COVID-19) severity and mortality: A pooled analysis. Am J Emerg Med 2020 Sep;38(9):1722-1726 [FREE Full text] [doi: 10.1016/j.ajem.2020.05.073] [Medline: 32738466]
11. Panteghini M. Lactate dehydrogenase: An old enzyme reborn as a COVID-19 marker (and not only). Clin Chem Lab Med 2020 Aug 24;58(12):1979-1981. [doi: 10.1515/cclm-2020-1062] [Medline: 32829312]
12. Huang I, Pranata R. Lymphopenia in severe coronavirus disease-2019 (COVID-19): Systematic review and meta-analysis. J Intensive Care 2020;8:36 [FREE Full text] [doi: 10.1186/s40560-020-00453-4] [Medline: 32483488]
13. Ruan Q, Yang K, Wang W, Jiang L, Song J. Clinical predictors of mortality due to COVID-19 based on an analysis of data of 150 patients from Wuhan, China. Intensive Care Med 2020 May;46(5):846-848 [FREE Full text] [doi:
10.1007/s00134-020-05991-x] [Medline: 32125452]
14. Wang L. C-reactive protein levels in the early stage of COVID-19. Med Mal Infect 2020 Jun;50(4):332-334 [FREE Full text] [doi: 10.1016/j.medmal.2020.03.007] [Medline: 32243911]
15. Wang D, Hu B, Hu C, Zhu F, Liu X, Zhang J, et al. Clinical characteristics of 138 hospitalized patients with 2019 novel coronavirus-infected pneumonia in Wuhan, China. JAMA 2020 Mar 17;323(11):1061-1069 [FREE Full text] [doi: 10.1001/jama.2020.1585] [Medline: 32031570]
16. Guan W, Ni Z, Hu Y, Liang W, Ou C, He J, China Medical Treatment Expert Group for Covid-19. Clinical characteristics of coronavirus disease 2019 in China. N Engl J Med 2020 Apr 30;382(18):1708-1720 [FREE Full text] [doi:
10.1056/NEJMoa2002032] [Medline: 32109013]
17. Tan C, Huang Y, Shi F, Tan K, Ma Q, Chen Y, et al. C-reactive protein correlates with computed tomographic findings and predicts severe COVID-19 early. J Med Virol 2020 Jul;92(7):856-862 [FREE Full text] [doi: 10.1002/jmv.25871] [Medline: 32281668]
18. Long H, Nie L, Xiang X, Li H, Zhang X, Fu X, et al. D-dimer and prothrombin time are the significant indicators of severe COVID-19 and poor prognosis. Biomed Res Int 2020;2020:6159720 [FREE Full text] [doi: 10.1155/2020/6159720] [Medline: 32596339]
19. Kong M, Zhang H, Cao X, Mao X, Lu Z. Higher level of neutrophil-to-lymphocyte is associated with severe COVID-19. Epidemiol Infect 2020 Jul 09;148:e139 [FREE Full text] [doi: 10.1017/S0950268820001557] [Medline: 32641174] 20. Aziz M, Fatima R, Lee-Smith W, Assaly R. The association of low serum albumin level with severe COVID-19: A systematic
review and meta-analysis. Crit Care 2020 May 26;24(1):255 [FREE Full text] [doi: 10.1186/s13054-020-02995-3] [Medline: 32456658]
21. Aziz M, Fatima R, Assaly R. Elevated interleukin-6 and severe COVID-19: A meta-analysis. J Med Virol 2020 Nov;92(11):2283-2285 [FREE Full text] [doi: 10.1002/jmv.25948] [Medline: 32343429]
22. The Lancet Haematology. COVID-19 coagulopathy: An evolving story. Lancet Haematol 2020 Jun;7(6):e425 [FREE Full text] [doi: 10.1016/S2352-3026(20)30151-4] [Medline: 32470428]
23. Arachchillage DRJ, Laffan M. Abnormal coagulation parameters are associated with poor prognosis in patients with novel coronavirus pneumonia. J Thromb Haemost 2020 May;18(5):1233-1234. [doi: 10.1111/jth.14820] [Medline: 32291954] 24. Bowles L, Platton S, Yartey N, Dave M, Lee K, Hart DP, et al. Lupus anticoagulant and abnormal coagulation tests in
patients with COVID-19. N Engl J Med 2020 Jul 16;383(3):288-290 [FREE Full text] [doi: 10.1056/NEJMc2013656] [Medline: 32369280]
25. BeatCOVID19. URL: http://beatcovid19.ml/[accessed 2020-12-15]
26. Qian G, Yang N, Ding F, Ma AHY, Wang Z, Shen Y, et al. Epidemiologic and clinical characteristics of 91 hospitalized patients with COVID-19 in Zhejiang, China: A retrospective, multi-centre case series. QJM 2020 Jul 01;113(7):474-481 [FREE Full text] [doi: 10.1093/qjmed/hcaa089] [Medline: 32181807]
27. Luo Y, Yuan X, Xue Y, Mao L, Lin Q, Tang G, et al. Using a diagnostic model based on routine laboratory tests to distinguish patients infected with SARS-CoV-2 from those infected with influenza virus. Int J Infect Dis 2020 Jun;95:436-440 [FREE Full text] [doi: 10.1016/j.ijid.2020.04.078] [Medline: 32371192]
28. Zhao X, Wang K, Zuo P, Liu Y, Zhang M, Xie S, et al. Early decrease in blood platelet count is associated with poor prognosis in COVID-19 patients-Indications for predictive, preventive, and personalized medical approach. EPMA J 2020 May 14:1-7 [FREE Full text] [doi: 10.1007/s13167-020-00208-z] [Medline: 32419876]
29. Zhu S, Dong L, Cai W. Predictive value of neutrophil to lymphocyte and platelet to lymphocyte ratio in COVID-19. Crit Care 2020 Aug 28;24(1):532 [FREE Full text] [doi: 10.1186/s13054-020-03258-x] [Medline: 32859254]
30. Sadr S, SeyedAlinaghi S, Ghiasvand F, Hassan Nezhad M, Javadian N, Hossienzade R, et al. Isolated severe thrombocytopenia in a patient with COVID-19: A case report. IDCases 2020;21:e00820 [FREE Full text] [doi: 10.1016/j.idcr.2020.e00820] [Medline: 32483524]
31. Cappellini F, Brivio R, Casati M, Cavallero A, Contro E, Brambilla P. Low levels of total and ionized calcium in blood of COVID-19 patients. Clin Chem Lab Med 2020 Aug 27;58(9):e171-e173. [doi: 10.1515/cclm-2020-0611] [Medline: 32459190]
32. Di Filippo L, Formenti AM, Rovere-Querini P, Carlucci M, Conte C, Ciceri F, et al. Hypocalcemia is highly prevalent and predicts hospitalization in patients with COVID-19. Endocrine 2020 Jun;68(3):475-478 [FREE Full text] [doi:
10.1007/s12020-020-02383-5] [Medline: 32533508]
33. Sun J, Zhang W, Zou L, Liu Y, Li J, Kan X, et al. Serum calcium as a biomarker of clinical severity and prognosis in patients with coronavirus disease 2019. Aging (Albany NY) 2020 Jun 25;12(12):11287-11295 [FREE Full text] [doi: 10.18632/aging.103526] [Medline: 32589164]
34. Gao M, Wang Q, Wei J, Zhu Z, Li H. Severe coronavirus disease 2019 pneumonia patients showed signs of aggravated renal impairment. J Clin Lab Anal 2020 Oct;34(10):e23535 [FREE Full text] [doi: 10.1002/jcla.23535] [Medline: 32840917] Abbreviations
AB: AdaBoost
ADR: available data rate AI: artificial intelligence ANOVA: analysis of variance
CNUH: Chonnam National University Hospital DNN: deep neural network
EDA: ensemble with deep neural network and AdaBoost
EDRnet: ensemble learning model based on deep neural network and random forest models EDX: ensemble with deep neural network and XGBoost
FC: fully connected FN: false negative FP: false positive
GPU: graphics processing unit
hs-CRP: high-sensitivity C-reactive protein LDH: lactate dehydrogenase
RF: random forest
SMC: Samsung Medical Center TN: true negative
TP: true positive
WKUH: Wonkwang University Hospital
Edited by G Eysenbach, R Kukafka; submitted 03.11.20; peer-reviewed by J Lee, C Jeong; comments to author 24.11.20; revised version received 24.11.20; accepted 08.12.20; published 23.12.20
Please cite as:
Ko H, Chung H, Kang WS, Park C, Kim DW, Kim SE, Chung CR, Ko RE, Lee H, Seo JH, Choi TY, Jaimes R, Kim KW, Lee J An Artificial Intelligence Model to Predict the Mortality of COVID-19 Patients at Hospital Admission Time Using Routine Blood Samples: Development and Validation of an Ensemble Model
J Med Internet Res 2020;22(12):e25442 URL: http://www.jmir.org/2020/12/e25442/
doi: 10.2196/25442
PMID:
©Hoon Ko, Heewon Chung, Wu Seong Kang, Chul Park, Do Wan Kim, Seong Eun Kim, Chi Ryang Chung, Ryoung Eun Ko, Hooseok Lee, Jae Ho Seo, Tae-Young Choi, Rafael Jaimes, Kyung Won Kim, Jinseok Lee. Originally published in the Journal of Medical Internet Research (http://www.jmir.org), 23.12.2020. This is an open-access article distributed under the terms of the Creative Commons Attribution License (https://creativecommons.org/licenses/by/4.0/), which permits unrestricted use, distribution, and reproduction in any medium, provided the original work, first published in the Journal of Medical Internet Research, is properly cited. The complete bibliographic information, a link to the original publication on http://www.jmir.org/, as well as this copyright and license information must be included.


![Figure 4. Deployed web application, BeatCOVID19 [25]: (a) input windows where a user inputs his or her blood sample results and (b) the predicted mortality results after entering the blood sample results.](https://thumb-eu.123doks.com/thumbv2/123doknet/14091587.464819/11.892.474.797.254.917/figure-deployed-application-beatcovid-windows-predicted-mortality-entering.webp)

