Assessing the Impacts of Retail Tariff Design on the Electric Power
Sector: A Case Study on the ComEd Service Territory in Illinois
by
Nelson Lee
B.A. Environmental Studies Prescott College, 2010
Submitted to the
INSTITUTE FOR DATA, SYSTEMS, AND SOCIETY
in partial fulfillment of the requirements for the degree of MASTER OF SCIENCE IN TECHNOLOGY AND POLICY
at the
MASSACHUSETTS INSTITUTE OF TECHNOLOGY
June 2019
( 2019 Massachusetts Institute of Technology. All rights reserved.
Signature redacted
Institute for Data, Systems, and SocietyMay 18, 2019
Signature redacted
Certified by
7, - Karen Tapia-Ahumada
Research Scientist, MIT Energy Initiative Thesis Supervisor Accepted by MAS$CHNEOS I4STIIJV
JrUN 10 2001]
LIBRAkIES
Signature redacted
Noelle Selin Director, Technology and Policy Program Associate Professor, Institute for Data, Systems, and Society and Department of Earth, Atmospheric and Planetary Sciences AuthorAssessing the Impacts of Retail Tariff Design on the Electric Power
Sector: A Case Study on the ComEd Service Territory in Illinois
by
Nelson Lee
Submitted to the Institute for Data, Systems, and Society in partial fulfillment of the requirements for the degree of
Master of Science in Technology and Policy
ABSTRACT
Cost-reflective electricity tariffs hold the key to enabling a wider adoption of distributed energy resources. Standard residential electricity tariffs have a flat monthly charge and a static volumetric energy charge that do not provide the correct economic signals to customers and do not reflect the costs of maintaining and operating the grid. Besides subsidies or specific supports to certain technologies, there are currently limited economic incentives for customers to invest in numerous technology options, like home batteries and AC controls, that could collectively and in response to efficient price signals: reduce system peak load, reduce greenhouse gas emission, provide greater system reliability, and reduce system costs. This thesis qualitatively explores the cost drivers of the electricity system and their implications for residential tariff design, as well as the economic inefficiencies and cross subsides that are present under the current volumetric rate tariff. In addition, we quantitatively assess the impacts of different electricity tariffs on consumers and on distributed energy resource adoption.
Based on hourly electricity meter data for 54,412 users in the Chicago area, the EIA 2016 residential energy survey, and the Commonwealth Edison's (ComEd's) costs of service reports, this thesis creates a full picture of residential energy consumption and costs. A regression-based Electric Load Decomposition (ELD) model was developed to predict hourly load profiles for each user's air-conditioning usage, electric heating usage and electric hot water heating usage. In addition, the MIT Demand Response and Distributed Resource Economics (DRE) model was used to evaluate the impacts of different electricity tariffs on customer bill changes, adoption of distributed energy resources, and reduction of CO2 emissions.
In this work, we design twelve revenue-neutral tariffs which recover the same total amount of revenues as ComEd's default volumetric tariff. We then compare these tariffs to the current utility volumetric tariff for all 54,412 residential electricity accounts, and we assess the impacts of flat volumetric charges, Time of Use Pricing, Critical Peak Pricing, Coincident Peak Capacity Charges, Real Time Pricing, and Carbon Pricing on customer bills and other metrics of interest. In addition, we also model the adoption of several distributed energy resources in response to these different tariff scenarios in order to understand their economic viability.
This work identifies the main tariff features that have meaningful impact on electricity bills, energy usage and CO2 emissions. Recovering network costs through a tariff that relies on a large capacity
charge creates substantial bill changes compared to the default flat tariff. Alternatively, a tariff that has a combination of a flat volumetric rate and a real-time price creates minimal bill impacts. Additionally, we find that most of the tariffs tested in this work incentivize the adoption of smart thermostats for air conditioning and for electric hot water heater. However, in the case of electric space heating, none of the tariffs produced significant incentives to load shift by preheating the
building, therefore smart thermostats for electric space heating were rarely adopted. The value created by residential batteries and solar panels are never enough to offset their high (unsubsidized) upfront costs.
Furthermore, we find that tariffs that rely on large capacity charges to recover significant portions of network costs, also create favorable prices during the winter that allow electric heat pumps to have lower annual operational costs than natural gas furnaces. Finally, we find that although precooling or preheating of a building (to avoid high price periods) lowers the electricity costs associated to space conditioning, they also result in increased energy consumption and increased carbon dioxide emissions. On the other hand, the scheduling and operating of smart electric hot water heaters can reduce emissions.
Thesis Supervisor: Karen Tapia-Ahumada
Acknowledgments
Thanks to the Alfred P. Sloan Foundation, whose funding has supported this work. Additional thanks to all the people I have worked with at the Environmental Defense Fund (EDF), Massachusetts Institute of Technology Energy Initiative (MITei) and Institute for Policy Integrity at New York University School of Law (NYU Policy Integrity).
Special thanks to my advisor and thesis supervisor, Dr. Karen Tapia-Ahumada, who has guided my research studies for the past year. She has been a wonderful mentor who has provided continuous support for this project. Her excellent and frequent feedback has vastly improved this work.
These last two years in TPP have been an incredible experience. I want to thank all of my classmates and friends for creating a fun, collaborative and enjoyable learning environment. Additionally, I want to thank the faculty and staff that make TPP possible.
Table of Contents
ABSTRACT ... 3 Table of Contents ... 6 Table of Figures ... 9 Table of Tables ... 12 1 Introduction...13 1. 1 M otivation ... 13 1.2 Research Q uestions... 15 1.3 M ethodology Overview ... 15 1.4 Thesis O rganization ... 162 Context and Literature Review ... 17
2.1 Electricity M arket O verview ... 17
2.1.1 The Costs of Supplying Electric Energy to Customers ... 17
2.1.2 The Costs of Connecting Customers to the Electric Energy Suppliers ... 18
2 .1.3 P olicy C o sts...18
2.1 Principles of Efficient Tariff D esign... 18
2.1.1 Reallocating Network Cost to Services Provided ... 19
2.2 Tariff Elem ents ... 20
2.2.1 Flat M onthly Charge...21
2.2.2 Flat Volumetric Energy Charge... 22
2.2.3 Capacity Charge...22
2.2.4 Time Variant Energy Charges...23
2.3 D rawbacks of Current Residential Tariff D esigns ... 25
2.3.1 Economic Inefficiencies ... 25
2.3.2 Cross Subsidies and Equity ... 25
2.3.3 Equity concerns: Do the Poor Subsidize the Rich?... 27
3 D ata Sets ... 28
3.1 Residential H ourly Electricity Consum ption D ata... 28
3.1.1 Customer Classes ... 28
3.1.2 Reading Interval...28
3.1.3 Data Cleaning ... 29
3.2 The Costs of Providing Electricity... 30
3.3 US Census and H ousing D ata... 30
3.3.1 Housing Characteristics ... 31
3.4 M eteorological D ata... 32
3.5 Residential Energy Data... 32
3.6 Current Costs of Technology... 35
4 M ethodology ... 36
4.1 Creating User Subclasses... 36
4.1.2 Users with Electric Hot Water... 36
4.1.3 U sers w ith A ir-C onditioning ... 37
4.2 Identifying Independent Variables That Influence Energy Load ... 38
4.3 Electric Load Decomposition (ELD) Model ... 41
4.3.1 Isolating Air-Conditioning Load from Annual Electricity Profiles ... 42
4.3.2 Isolating Electric Heating Load from Annual Profiles ... 46
4.3.3 Identifying Electric Hot Water ... 49
4.3.4 Summary of the Electricity Load Decomposition Model ... 51
4.3.5 Comparison of RECS and Electric Load Decomposition Model...52
4.4 Distributed Resource Economic Model...54
5 Tariffs Scenarios ... 56
5.1 C u sto m er B ills ... 56
5.2 ComEd Default Flat Volumetric Tariff...57
5 .3 T ariffs T ested ... 59
5.3.1 T im e of U se (T O U ) T ariffs... 60
5.3.2 Flat Volumetric with Critical Peak Price ... 61
5.3.3 Flat Volumetric and Real-Time Price Tariff... 62
5.3.4 Real-Time Price with Coincident Peak Capacity Charge ... 63
5.3.5 R T P + R eF ram e ... 65
5.3 .6 R T P + C arb o n ... 66
6 Results and Discussion... 68
6 .1 B ase C ase ... 6 8 6.1.1 Base Case: Annual Bill Impact... 68
6.1.2 Base Case: Impact on the Annual Operating Costs of Air Conditioning... 70
6.1.3 Base Case: Impact on the Annual Operating Costs of Electric Heating ... 72
6.1.4 Base Case: Impact on the Annual Operating Costs of Electric Hot Water ... 74
6.2 DRE Simulated Air Conditioning Load Shifting...75
6.2.1 Air Conditioning Response to Time of Use Tariffs ... 77
6.2.2 Air Conditioning Response to Critical Peak Pricing ... 78
6.2.3 Air Conditioning Response to Real Time Pricing ... 79
6.2.4 Air-Conditioning Energy Use and Emissions Under Different Tariffs ... 80
6.2.5 Air-Conditioning Bill Changes in response to Different Tariffs ... 81
6.3 Responsive Electric Heating ... 82
6.3.1 Cost Parity of Electric Heating and Natural Gas Heating ... 82
6.3.2 DRE Electric Heating Simulation...84
6.3.3 DRE Electric Heat Load Shifting Under Different Tariffs ... 85
6.3.4 Electric Heating Energy Use and Emissions Under Different Tariffs... 87
6.4 Responsive Electric Water Heaters...88
6.4.1 Hot Water Heaters as Energy Storage Devices... 89
6.4.2 Smart Hot Water Heater Schedule in response to Different Tariffs ... 89
6.4.3 Changes in Carbon Dioxide Emissions from the Operation of Smart Hot Water Heaters. 91 6.4.4 Bill changes for Average Electric Hot Water User...92
6.5 Tariff Impacts on Rooftop Photovoltaic ... 93
6.6 A Note on Residential Batteries ... 94
6.7 T echnology A doption ... 95
6.8 The "Smart" Case: Bill Changes with Adopted Technology ... 96
7.1 Summary of Research ... 99
7.2 Summary of Results ... 102
7.3 F uture R esearch ... 106
7.3.1 C ase Study Im provem ents...106
7.3.2 F u ture Studies...106
7.3.3 M odel Im provem ents...107
7.4 F in al R em arks ... 107
8 Bibliography... 108
9 Appendix: Additional Smart AC Load Shifting Figures ... 112
10 Appendix: Additional Smart Electric Heating Load Shifting Figures ... 116
11 Appendix: Additional Smart Electric Water Heating Load Shifting Figures... 117
Table of Figures
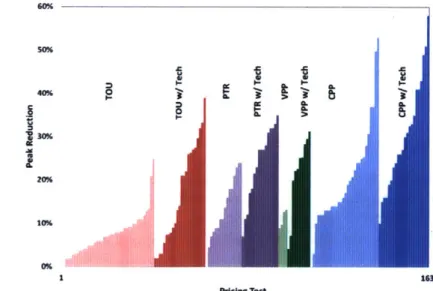
Figure 2-1: Impacts from pricing tests by rate type and use of enabling technologies (Faruqui and
S ergici 2 0 13) ... 24
Figure 2-2: Wholesale Price and System Demand in the ComEd System Territory (S&P Global M arket Intelligence 2018)... 26
Figure 3-1: Steps Taken to Clean and Subset the ComEd Data Set ... 29
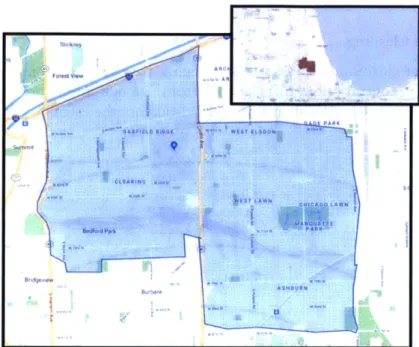
Figure 3-2: Area of study includes zip codes 60638, 60652, and 60629. Source: Google Maps 2019 ... 3 0 Figure 3-3: Income levels for household in the study area. Each dot represents 10 households. Based on 2010 US Census data (Radical Cartography 2010)... 31
Figure 3-4: Houses Built per Decade in the 3-Zip Study Area ... 32
Figure 3-5: 2015 Residential Energy Consumption Survey. Average electricity consumption broken down by end use for consumers in the east north central census zone and in the cold/very cold clim ate region ... 33
Figure 3-6: Left -Climate Regions of US. Right - East North Central census region. Center: Overlapping Region. Image Sources: , (Creative Commons 2007; US DoE 2019)... 34
Figure 4-1: Total Load of all 3-Zip Data Set Accounts... 38
Figure 4-2: Load vs Tem perature: 3-Zip D ata Set ... 39
Figure 4-3: Load vs Temperature for all Electric Heat Users ... 39
Figure 4-4: Random Account Hourly Electricity Load During the Week of January 1't 2016... 40
Figure 4-5: Daily Usage Patterns Determined by Time Series Decomposition of Account 242.. 40
Figure 4-6: The Electric Load Decomposition Model Prediction of Component Loads for A ccount 34 in the 3-Zip D ata Set ... 41
Figure 4-7: Distribution of the Thermal Regression Adjusted R Squared Value for Each User... 43
Figure 4-8: 2016 Hourly Electricity Consumption User #242... 43
Figure 4-9: Initial Predicted Total Load Without AC for User #242... 44
Figure 4-10: Initial Predicted AC Load with Residuals for User #242... 44
Figure 4-11: Final Estimate of Air-Conditioning Load Profile for User #242 ... 45
Figure 4-12: Final Estimate of Non-AC Load for User #242... 45
Figure 4-13: Total Electric Load for User #34 Identified as Having Both Electric Heat and E lectric H o t W ater ... 46
Figure 4-14: Final Estimated Air Conditioning Load of User #34... 46
Figure 4-15: Final Estimate of Non-AC Load for User #34 ... 47
Figure 4-16: Final Estimate Electric Space Heating Load for User 34... 49
Figure 4-17: User #34 Baseline and Electric Hot Water. Total Load with Electric AC and Electric Space H eat R em oved ... 49
Figure 4-18: Final Estimated Electric Hot Water Heating Load for User #34... 51
Figure 4-19: 2015 RECS and 2016 Regression Decomposition Comparison by User Class -A nnual average kW h . ... 52
Figure 4-20: Calibration of The Electric Head Loads Produced by the Electricity Decomposition Model to Better Match the RECS Estimated Loads for Similar Households... 54
Figure 4-21: DR-DRE Schematic of Primary Inputs ... 55
Figure 5-1: Allocation of Revenues Collected from ComEd's Residential Bills (Monitoring A nalytics, LLC 2018; Com Ed 2017a)... 56
Figure 5-2: Simplified Breakdown of the Allocation of Revenue Collected from ComEd's R esid en tial B ills ... 57
Figure 5-3: Allocation of Cost Drivers to Default Volumetric ComEd Tariff...58
Figure 5-4: Default Flat ComEd price per kWh and the Real Time Wholesale Price per kWh of th e system ... 5 8 Figure 5-5: Sum m ary of Tariffs Tested ... 59
Figure 5-6: Tim e of U se vs. W holesale Price... 60
Figure 5-7: Flat+ 1 OxCPP Tariff and Real-Time Wholesale Price...62
Figure 5-8: Flat+RTP Tariff and Real-Time Wholesale Price ... 63
Figure 5-9: RTP+CPC10 Tariff and Real-Time Wholesale Price on August 10th and 11th...64
Figure 5-10: RTP+CPC10 Tariff and Real-Time Wholesale Price on March 15th and 16t...64
Figure 5-11: RTP+ReFrame Tariff and Real-Time Wholesale Price on August 10th and 11h...65
Figure 5-12: RTP+ReFrame Tariff and Real-Time Wholesale Price on August 5th through the 15' ... 6 5 Figure 5-13: ComEd System Load (MW) and Marginal Emissions Plotted for Each Hour of the Y ear ... 6 6 Figure 5-14: ComEd Wholesale Price and Marginal Emissions...66
Figure 6-1: All 55,412 A ccount's Annual bills... 68
Figure 6-2: Bill Changes for Each Tariff Tested Compared to the Default Com Ed Bill. Plotted Separately for Lower Income Zip Code and Higher Income Zip Code. Positive Values R epresent B ill Increases ... 69
Figure 6-3: Density Plot of all 54412 Users Annual Air-Conditioning Operating Expense...70
Figure 6-4: Changes in the Cost to Operate Air Conditioners Under the Different Tariffs ... 71
Figure 6-5: Annual Operating Costs of Electric Heat for Users with Electric Heating...73
Figure 6-6: Changes in the Annual Operating Cost of Electric Heating Equipment Under D ifferen t T ariffs ... 73
Figure 6-7: Annual Operating Costs of Electric Water Heating for Users with Electric Water H eaters ... 74
Figure 6-8: Changes in the Annual Operating Cost of Electric Water Heating Equipment Under D ifferen t T ariffs ... 75
Figure 6-9: DRE Generated AC Load Under Default Tariff with a Time Constant of 10 Hours and Total A nnual Load of 1923 kW h ... 76
Figure 6-10: DRE AC Load Shifting in Response to TOU 1:3:5 Tariff on August 10th and 11th .Plotted w ith lines connecting points ... 77
Figure 6-11: Comparison of Smart AC Operation under TOU 1_3_5 Tariff and TOU 1_5_10 Tariff on August 10th and 11th. Plotted in Steps for Each Period...78
Figure 6-12: Smart AC Operation During a Critical Event of the FlatCPP10x Tariff...79
Figure 6-13: Smart AC Operation with the Flat+RTP Tariff... 80
Figure 6-14: Increases in annual Energy Use and C02 Emissions from the Operation of DRE Simulated Smart Air Conditioner for a single user...81
Figure 6-15: Bills Changes for Median Air Conditioning Load Under Different Tariffs, With and W ithout Sm art C ontrols... 82
Figure 6-16: Average Ductless Heat Pump Efficiency vs Outdoor Temperature. Source: (Cadmus G ro u p 20 16)...83
Figure 6-17: DRE Generated Electric Heating Demand, Outdoor temperature, Flat Tariff and W h o lesale P rices...84
Figure 6-18: DRE Smart Electric Heating Load Shift in Response to TOU_1_3_5 Tariff ... 85
Figure 6-19: DRE Smart Electic Heating Load Shifting in Response to RTP+CPC Tariff...86
Figure 6-21: Changes in Total Energy Consumption and Carbon Dioxide Emissions as a Result
of the Adoption of Smart Controls for Electric Space Heating for a Single User... 87
Figure 6-22: Energy Cost Comparison of Gas Space Heating and Electric Space Heating Under Different Tariffs Using a Heat Pump with Average Annual COP of 2... 88
Figure 6-23: Basic Electric Hot Water Schedule for User #15 as Determined by the Hot Water Demand Profile Calculated by the Load Decomposition Model... 89
Figure 6-24: DRE Simulated Scheduling of Charging of a 1.5kW Hot Water Heater with an 80 Gallon Storage Tank in Response to a Time of Use Tariff ... 90
Figure 6-25: DRE Simulated Scheduling of a 1.5kw Hot Water Heater with an 80 Gallon Storage Tank in Response to a the RTP Scaler Tariff... 91
Figure 6-26: Changes in Emissions as a Result of the Smart Operation of Electric Water Heaters ... 9 2 Figure 6-27: Energy Cost Comparison of Gas Water Heating and Electric Water Heating Under Different Tariffs Using a Basic Water Heater versus a Smart Water Heater... 92
Figure 6-28: Revenue Generated by Four-Kilowatt Rooftop Photovoltaic Array with Net M etering under different Rate Tariffs. ... 93
Figure 6-29: Changes in Income of Rooftop Photovoltaic Installations Due to different Tariffs. All Tariffs Compared to Default Flat Tariff. Four-Kilowatt Array Modeled with Multiple Directional Orientation. 2016 Irradiance Data Used... 94
Figure 6-30: Summary of the Annual Bills for a Random Sample of Users under Different Tariffs, with and without the Adoption of Smart Thermostats. Sample of 10% of the 55,412 U sers in the 3-Zip Study A rea. ... 97
Figure 6-31: Distribution of the Bill Impact for Each Customer for Each Tariff with and without the Adoption of Smart Thermostats. All Bills are compared against the Default Flat Tariff. Sample of 10% of the 55,412 Users in the 3-Zip Study Area. Negative Values Represent User Savings compared to the Default Tariff. ... 98
Figure 7-1: Sum m ary of T ariffs Tested... 101
Figure 7-2. Plot of Customers Who Have Bills Increase Under Each Tariff. Refer to Table 7-3 to See the Percentage of Customers with Bill Increases. ... 105
Figure 9-1: Smart AC Operation Under Flat+CPP10X and Flat+CPP100X Tariffs ... 112
Figure 9-2: Smart AC Operation with the RTP+CPC10 and RTP+CPC100 Tariff... 113
Figure 9-3: Smart AC Operation with the RTP+CPC50 Tariff... 114
Figure 9-4: Sm art AC Operation with the RTPx Tariff... 114
Figure 9-5: Smart AC Operation with the RTP ReFrame Tariff... 115
Figure 10-1: DRE Simulated Smart Heating Operation in Response to the RTP Scaler Tariff.. 116
Figure 10-2: DRE Simulated Smart Heating Operation in Response to the RTP Carbon 40 Tariff ... 1 1 6 Figure 11-1: DRE Simulated Scheduling of a 1.5kw Hot Water Heater with an 80 Gallon Storage Tank in Response to a the Flat+CPP10x Tariff... 117
Figure 11-2: DRE Simulated Scheduling of a 1.5kw Hot Water Heater with an 80 Gallon Storage Tank in Response to a the V +RTP Tariff... 117
Table of Tables
Table 3-1: Summary Income Statistics of the 3-Zip Study Area...31
Table 3-2: Major electric appliances ownership rates, Source: 2015 RECS...34
Table 4-1: Number of users with electric heat ... 36
Table 4-2: Allocation of Electric Hot Water Heaters in RECS data set ... 37
Table 4-3: Variables Used in Regression. Weather Data From (Manajit Sengupta et al. 2018)...42
Table 4-4: Regression Interaction Term s... 42
Table 4-5: Variables Used in 2nd Regression. Weather Data from (Manajit Sengupta et al. 2018) and Watermain Temperature Data from (Dept. of Energy 2014) ... 48
Table 4-6: 2nd Regression Interaction Term s ... 48
Table 4-7: Variables Used in Hot Water Demand Regression. Watermain Temperature Data from (D ept. of E nergy 2014) ... 50
Table 4-8: 3rd Regression Interaction Term s ... 50
Table 4-9: Cooling Degree Hours for 2015 and 2016. Chicago O'Hare. Derived from NREL W eath er R ecord s ... 53
Table 4-10: Number of Observation in RECS and 3-Zip Data Set. ... 53
Table 5-1: Default ComEd 2016 Tariff by Customer Class (Source: ECOSS)...58
Table 5-2: Summary of TOU 1:3:5 and TOU 1:5:10 Tariffs ... 61
Table 5-3: Sum m ary of Flat+CPP Tariffs... 61
Table 5-4: Sum m ary of Flat+RTP Tariff... 62
T able 5-5: R T P + C PC 10 T ariff...63
Table 6-1: Annuity Payments for Selected Technologies ... 95
Table 6-2: Percent of Users Who are Incentivized to Adopt Smart Controllers Under Different T ariffs ... 9 6 Table 7-1: Incentives for Smart Thermostats and Load Shifting...102
Table 7-2: Summary of Operational Costs Parity with Natural Gas for Electric Space Heating and Electric Hot Water Heating for Each of the Tariffs Tested. ... 103
Table 7-3: Percent of Accounts with Bill Increases Under Each Tariff Tested, With and Without Sm art T herm ostats...104
1
Introduction
1.1 Motivation
Global climate change is the result of the increased concentration of carbon dioxide (CO2) and other greenhouse gases in the atmosphere. Over the last 160 years, the accumulation of CO2has
increased from 280 parts per million in 1850 (NOAA 2008) to 407 parts per billion in 2017 (NOAA
2019). Antarctic ice core samples indicate that current levels of CO2in the atmosphere are higher
now than at any other point in the last 400,000 years (Riebeek 2005). The effects of global climate change will likely include: global temperature increases, sea level rise, species extinctions, shifting agricultural zones, ocean acidification, increasing frequency of droughts and forest fires, melting ice caps, and the displacement of millions of people.
The combustion of fossil fuels is the leading driver of increased greenhouse gas emissions. In addition to CO2, small particulate matter, sulfur dioxide, nitrous oxides, and ozone are also produced during the combustion process with health effects on local populations. Caiazzo et al.
(2013) estimated that 100,000 premature deaths occur each ycar in the United States because of the
combustion of fossil fuels in the electricity and transportation sector.
Currently 83% of the world's total primary energy consumption is provided by coal, oil and natural gas (UN IEA 2016). The need to transition away from fossil fuels as primary energy sources is key if we want to minimize the consequences of global climate change and on negative impacts on human health.
The Energy Transition
Fossil fuels have powered society for the last 100 years and were critical for many of our technological advancements. They are very energy dense, easy to transport, and can be easily stored. They can be used directly to heat homes, propel cars and planes, provide hot water, and cook meals. Fossil fuels also provide most of the energy for the US's electricity. Electricity, in turn, powers most of societies lights, electronics, refrigeration, and air-conditioning.
Electricity will play a central role in transitioning to a carbon zero energy future (Jenkins, Luke, and Thernstrom 2018). Most energy end-uses that currently rely on directly burning fossil fuels can be transitioned to electric. Electric vehicles are rapidly improving, and many consumers see them as a viable alternative to gasoline vehicles. Electric heat pumps can efficiently replace gas and oil furnaces. Induction cooktops can replace gas cooktops. Electric hot water heaters can replace gas hot water heaters.
However, the current electricity sector is primarily fueled by fossil fuels. So, fuel switching alone will not necessarily reduce carbon emissions.
In order to transition away from fossil fuels, societies must do two things simultaneously. Create an electric power system that is fueled by low carbon technologies and convert other fossil fuel uses to electricity. If the electricity sector decarbonizes, then other energy end-uses, like transportation and space conditioning, can decarbonize by switching to electric energy.
Most electricity decarbonization strategies increase the deployment of intermittent renewable energy resources, like wind and solar, increase the deployment of energy storage, and increase
demand flexibility (Jenkins, Luke, and Thernstrom 2018). Residential households can play a part in each of these areas. Houses can install rooftop solar, install electric batteries, and have greater demanid flexibility by load shifting electric hot water heating, electric space heating and air-conditioning.
Many states have incentives and rebates to install rooftop solar panels, few states have policies that support the installation of electric batteries or encourage the demand flexibility.
Residential Electricity Bills
Most residential consumers pay a single price for electric energy regardless of the time of day or season of year. In the service territory of the electric utility company Commonwealth Edison, a kWh costs a consumer the same amount of money across all hours of the year regardless of the time-dependent marginal cost of producing the kWh. Historically this has been a necessity as utility companies had no way of monitoring dynamic energy consumption. Residential electric meters were analog devices that counted the amount of energy that passed through them. Monthly meter readings allowed utilities to record, and then bill for monthly consumption of energy.
The mismatch between the price consumers pay for energy and the price that generators charge for energy has created a market failure. During most hours of the year, the cost of supplying electricity is less than what customers are charged. During a few hours of the year the costs of supplying electricity is much higher than what customers are charged. There are two dead weight losses associated with these price mismatches. The first occurs when wholesale prices for energy are greater than the retail price, customers consume more energy than if they were charged wholesale prices. Likewise, when wholesale prices are less than the retail price, customers consume less energy than they would if exposed to the wholesale price. If everyone was charged a dynamic price, overall system costs would be less.
The electric industry could learn a few lessons from the airline industry. Imagine an old airliner that operates a Boston-New York City route. With ticket prices of $300 one way, during the busiest travel day of the year there is enough demand to fill 20 planes, during most other days of the year there is demand for only 10 planes. This Airliner buys and maintains all 20 planes. A new airline decides to charge a $400 for the busiest day of the year and $150 for the rest of the year. With this price structure the airline can fill 18 planes all year round and ultimately transport far more customers at a lower average cost.
The electric grid is built to handle peak demand that occurs once or twice a year, this means that for most hours of the year there is substantial slack in the system. This is akin to the airline that operates most of the year with empty seats. If the electric grid charged customers different prices during periods of high demand, just like the airline industry currently does, then they would be able to reduce average costs and serve more energy. For this to work customers must be responsive to changes in price.
Distributed energy resources, such as internet connected appliances, smart thermostats and smart hot water heaters, can respond to price signals that will enable them to schedule which hours of the day to operate. If these technologies were widely adopted, then a large portion of residential electricity demand could be controlled.
A future can be envisioned when consumers, through their internet connected devices, are able to
match their electricity demand to periods of lower energy costs1. Batteries, electric vehicles, hot water heaters, and HVAC systems2 can all be controlled to prioritize operation when it is windy or sunny. However, few consumers will adopt these technologies unless economic incentives exist. Current flat retail prices provide no incentives to consumers to adopt these technologies.
1.2 Research Questions
This thesis will explore the potential value created by residential distributed energy resources (DERs) that can respond to different tariff designs. The research questions this thesis attempts to answer revolve around the relationship between revenue-neutral tariff designs, changes in customers' bills, and the adoption of distributed energy resources.
In particular, this thesis will address the following questions:
* Will a more cost-reflective retail tariff create economic incentives for residential customers to invest in load shifting technologies?
* What tariffs create incentives to switch from gas space heating to electric space heating? * Can the adoption of distributed energy resources reduce the number of negatively impacted
customers that are created from a new tariff? * How do different tariffs impact carbon emissions?
1.3 Methodology Overview
This thesis relies on a quantitative and qualitative analysis of the impacts of various tariff structures on consumers located within the concession area of Commonwealth Edison (ComEd), the largest electric utility in the state of Illinois.
This work benefited from ComEd's anonymized residential energy usage dataset. This thesis process and analyzes the hourly electricity meter data 54,412 residential account in the ComEd service territory.
An Electric Load Decomposition Model was developed to approximate the base electric load, hot water electric load, electric space heating load, and air conditioning load of each of the 54,412 residential accounts.
Additionally, several revenue neutral electricity tariffs are examined in this work. These include a combination of flat volumetric energy charges, time dependent energy charges (time of use charges, critical peak charges, and hourly time varying charges), coincident peak demand charges, and flat monthly charges.
Finally, in order to carry out the analysis, the MIT Demand Response and Distributed Resource Economic (DR-DRE) model was adapted to this thesis. This optimization tool was used to
I Or if a consumer prefers when renewable energy sources are most productive.
2 HVAC can precool or preheat office spaces in the middle of the night when nobody is present and still maintain thermal comfort during business hours.
determine the set of DER technologies to invest in for each consumer, and to economically operate them. The menu of technologies included in this analysis covered hot water heaters with smart controls, smart thermostats for air conditioners and electric space heating, and rooftop solar panels.
1.4 Thesis Organization
The structure of the thesis is as follows. Chapter 2 reviews the literature on residential electricity tariff deign. Chapter 3 describes the public datasets used in this thesis as well as their sources. These data sets include information about: hourly residential energy consumption, housing information, meteorological data, utility costs of service, and residential energy end-use estimates.
Chapter 4 discusses in detail the methodology used for the assessment of the impacts of electricity
rates on the system and consumers, covering the method used for decomposing residential electricity usage, and the linear optimization tool used to simulate distributed energy resources.
Chapter 5 presents the construction of scenarios used in the analysis. Results are presented and
discussed in Chapter 6. Chapter 7 finishes with recommendations and discusses future lines of research.
2 Context and Literature Review
This chapter presents background information on three topics that are relevant for the work presented in this thesis. These topics are: the cost drivers of the electricity grid; economic inefficiency and equity shortfalls of current residential electricity tariffs; and strategies for designing efficient tariffs.
2.1 Electricity Market Overview
The costs drivers of an electric power system are critical for understanding the basis of tariff design and their structure. Most of the costs of delivering electricity to customers are determined in the markets operated by an independent system operator. These include the costs of generating energy, the costs of transmitting energy on medium and high voltage lines, the costs of providing reserves and frequency control, and the costs of ensuring future capacity requirements. In addition, the local electric utility has costs for: distributing electricity on low voltage lines, reading meters, customer relations, and billing.
The particular case of this thesis is geographically focused in north-eastern Illinois, where the local electric utility is Commonwealth Edison (ComEd) which is a member of PJM Interconnection LLC (PJM) - the independent system operator (ISO) for North East Illinois and several mid-Atlantic states. PJM is responsible for operating the electric grid and managing the electricity markets where generators place bids to provide electricity, reserves and future capacity (PJM 2019b).
2.1.1 The Costs of Supplying Electric Energy to Customers
Energy costs are a combination of all the costs associated with the generation of electricity at power plants, and the costs of supplying that energy reliably. These costs include the costs of generating electricity, securing operational reserves, and procuring future capacity commitments. They are locational and time dependent and determined by markets managed by PJM.
Chicago real-time wholesale electricity prices are settled by PJM every 5 minutes. PJM also determines the operational schedule of all the electric generators in its territory. Wholesale prices are affected by: temporal changes in electric demand at hundreds of different nodes; the availability of generators; system energy losses and congestion across the regional transmission lines (PJM 2019a).
An individual user's electricity demand is highly variable, changing with each flip of a switch or operation of an appliance. However, when thousands of users are aggregated together their load becomes smoother and more predictable. Thus, aggregate electric demand at each node in the system can be predicted based on time of day, day of week, time of year and outdoor weather conditions.
Every generator provides information to PJM about its availability and operating constraints which is used to schedule the operation of the units and settle the market based on generators' bids. Normally, the market will schedule lower costs generators before higher cost generators. However, unexpected changes in generator output can occur due to changes in weather, in the case of wind and solar, or unexpected outages of any generator. In order to ensure enough generation to meet demand, PJM also operates long-term capacity, short-term reserve, and reactive power markets in addition to the energy market. The reserve market ensures that if there is an unexpected failure in the system -- a line goes down or a generator fails-- there is minimal disruption in the supply of electricity. The reactive power market ensures that the electricity remains stable and compatible
with all the different loads on the system. Lastly, the capacity market ensures that there will be enough generation for several years into the future.
Wholesale prices in PJM (also known as Locational Marginal Prices, LMPs) are highly time and location dependent. This provides the financial incentives to build and operate new generators (or transmission lines) that can best take advantage of high prices, especially when congestion is persistent throughout the system.3
2.1.2 The Costs of Connecting Customers to the Electric Energy Suppliers
ComEd is an energy delivery company and as such acts as the intermediary between electricity markets and residential customers. As a regulated monopoly, ComEd is chartered with being the sole maintainer of the transmission and distribution network in its service territory. Building and maintaining the medium and low voltage network to provide safe, reliable electric service to 4 million customers is the core of the company's business (ComEd 2019b), and account for most of ComEd's annual costs.
In addition to network operational costs, ComEd has costs associated with reading meters, calculating and collecting bills, and interacting with customers. The utility is allowed by regulators to pass all of its operational costs on to its customers and to secure a return on its installed equipment by means of electric tariffs for its industrial, commercial and residential customers. ComEd's Embedded Cost of Service Study (ECOSS) details the distribution, policy and customer-related costs of supplying energy to consumers (ComEd 2017a). The ECOSS is used to calculate customers' tariffs, which for residential customers, is normally a simple flat volumetric rate with a lump sum monthly charge.
2.1.3 Policy Costs
Furthermore, there are extra costs -known as policy costs -that regulators and policy makers have decided to add to customer bills. In 2016, the added policy costs on customer bills included charges for a Renewable Portfolio Standard, a Zero Emissions Standard and Environmental Cost Recovery. The costs are also recovered through a flat volumetric energy charge. Finally, local and state taxes are applied to bills after all other costs have been fully calculated.
All of the energy, network and policy costs associated with suppling and delivering electric energy
need to be recovered through different charges on customer bills. The design of these charges will be discussed in the next sections.
2.1
Principles of Efficient Tariff Design
A well-designed residential bill should aim to create as few market distortions as possible, and to
bill customers accurately for their individual network and energy usage. This can be achieved by using the principle of cost-causality. The costs of the network should be allocated to the users who
cause them. Or in other words, consumers should pay the costs they impose on the system. Retail
tariffs for electric supply and delivery services should reflect the underlying system costs and the environmental costs of electric consumption (Convery, Mohlin, and Spiller 2017). A cost reflective tariff accomplishes the principle of cost-causality.
3 Congestion on the electricity grid occurs when the transmission lines reach their rated capacity, which
Tariffs that rely on time and location dependent marginal cost pricing can fully recover the cost of fuel, pollution, and customer services, but they will not fully recover the costs of the network. The short run marginal costs of operating the distribution network is substantially lower than the average costs of operating the network, due to the large upfront capital expenses that are required. Therefore marginal costs pricing will not recover the full costs of the network (Bharatkumar 2015).
A principle challenge in tariff design is determining how to allocate the sunk costs of the
distribution network. To address this challenge Perez-Arriaga and Bharatkumar (2014) developed a framework for reallocating network costs to services provided to consumers.
2.1.1 Reallocating Network Cost to Services Provided
Perez-Arriaga and Bharatkumar (2014) advocate for allocating the costs of the electricity network based on services the grid provides to consumers. By redefining the cost drivers as services, the costs can be more accurately allocated to different tariff elements.
The first service provided by the electricity grid to customers is a basic connection. The cost of connection is the minimum network costs needed to connect everyone to the grid at minimum load levels. A minimum load should provide enough capacity for the essentials like a refrigerator, lights, TV, computer, fans, and a single high load item to all be run at the same time. It would not cover the additional capacity needed to run multiple high loads at the same time, such as air conditioners, microwaves, electric cooktops, ovens, electric clothes dryers, electric hot water heaters, and electric space heating. Currently, the cost of connection is incorporated into the transmission and distribution charges. The authors advocate for collecting connection costs through a flat monthly charge that is location dependent.
The second service is capacity. The network's ability to handle peak power flows is a key driver of transmission and distribution costs (Perez-Arriaga and Bharatkumar 2014). The costs associated with strengthening and reinforcing the grid to handle peak demand on the system are the costs imposed by providing added capacity. Increased capacity allows users to use multiple high load appliances at the same time. According to the authors, the most economically efficient way to allocate capacity costs would be through a coincident peak demand charge that would bill customers based on the fraction they contribute to system's peak demand.
Peak demand may occur at different times in different parts of the system, thus there could be separate peak demand charges for different levels of connection to the grid. The peak power flows on the smaller distribution network will occur at different times than on the regional transmission network.
The third service provided is reliability. The electric grid provides very high levels reliability to customers.
"In designing a distribution network, the system planner also takes into account reliability criteria defined by network user needs or by regulatory requirements. The investments made by the distribution utility to ensure system reliability, such as component redundancies and security margins or "buffers," are intended to ensure continuity and quality of supply" (Perez-Arriaga and Bharatkumar 2014).
In order to provide high levels of reliability, system planners and grid operators maintain added redundancy in order to ensure that no unexpected loss of a generator or transmission line results in an electricity outage. This requires substantial increases in transmission and distribution capacity, well above the grid ability to handle peak power flows.
The authors suggest for these costs to be recovered through a flat volumetric energy charge and not through a capacity charge because,
"Failures in network components can occur at any time, and investments in redundancy, extra transfer capacity, advanced automation, or network visibility, monitoring, and metering capabilities may only be justified when the entire year - not only the few peak hours -are considered. Thus, the reliability cost driver is associated with users' entire network utilization profiles not just capacity requirements, and reliability-related costs are allocated on the basis of hourly energy use" (Perez-Arriaga and Bharatkumar 2014).
The last network cost driver presented by the authors are investments made to reduce energy losses. System planners can make investments in technology and equipment that reduce energy losses across the network.
"The [distribution system operator] - and thus the design of any regulatory mechanism to incentivize loss reduction in the distribution system - must consider the tradeoff between making the infrastructure investments to reduce losses in the distribution system, or operating with high losses and paying any regulated penalty for network losses. Losses at the distribution level are primarily transformer core losses and power line losses. As such, this cost driver reflects how a network user's profile impacts transformer and line losses, and therefore, investments made by the distribution utility to reduce those losses [...] the most accurate allocation of the costs associated with [...] reducing losses is as a quadratic function of network users' contributions to line current, and also as a
function of their locations" (Perez-Arriaga and Bharatkumar 2014).
Energy is the product being delivered to customers. This is the cost of generating electricity by power plants. The most efficient way of billing customers for these costs would be through real-time locational-dependent prices for each kWh consumed.
Should the costs associated with energy reserves and future capacity procurement be considered energy costs or capacity and reliability costs? This thesis considers both to be part of the energy service. Energy reserves and capacity procurement costs are currently recovered through the energy portion of customers' bills. However, capacity markets are designed to protect against future energy shortages so related costs could be considered as part of the capacity or reliability service.
2.2
Tariff Elements
A single electric bill can have many different elements on it. Currently, most bills have a flat
monthly charge and a volumetric energy charge. Depending on the customer class, a demand charge that is dependent on the peak usage over the course of a month can be used, as in the case of many commercial customers. Monthly readings from old analogue meters were able to calculate both of these charges. They are unable to calculate any of the time dependent charges that would allow tariffs to be more cost reflective because they lack information on the time of electric withdrawals and injections.
"Detailed monitoring of electricity withdrawals and injections [...] facilitate more efficient prices and charges. Without more accurate consumption and injection data from all customers, it is impossible to capture the full value of electricity services" (P6tez-Arriaga et al. 2016).
The installation of advanced "smart" meters that record energy consumed over short time intervals can enable the use of many different time-dependent tariff components that have more granular formats. Joskow and Wolfram (2012) conclude that the benefits of smart meters outweigh the costs of installation,
"A substantial body of literature explores customer response to varying
granularity of energy prices, generally suggesting that the benefits to be realized from the responses of customers opting to utilize TOU or CPP rates justify costs of implementation such as advanced metering, communication, and control costs - which have fallen significantly in recent years as advanced metering rollout has expanded"(Joskow and Wolfram 201.2).
Several of the tariff elements discussed in this chapter rely on the information made available by smart meters. Time dependent charges include several energy charges: real-time prices, time-of-use charges, and critical peak pricing, as well as coincident capacity charges. These time dependent tariff elements can increase social welfare. MIT's the Utility of the Future Report states,
"The value or cost of electricity services can vary significantly at different times and at different locations in electricity networks. Progressively improving the temporal and locational granularity of prices and charges for these services can deliver increased social welfare. However, these benefits must be balanced against the costs, complexity, and potential equity concerns of implementation"
(PNrez-Arriaga et al. 2016).
The following section introduces different tariff elements and discusses the advantages and drawbacks of each. Many of the tariff elements presented are only made possible by smart meters.
2.2.1 Flat Monthly Charge
A flat monthly charge is a lump price payed every month. ComEd's flat monthly charge in 2016
was approximately $15 and it was designed to recover the costs of reading meters, creating and distributing bills, processing bills and other customer related expenses (ComEd 2016).
Perez-Arriaga and Bharatkumar (2014) advocate for recovering connection costs, which include all customer related charges and a significant percentage of tranmission and distribution charges, with a flat monthly rate. This would significantly increase the current $15 per month charge that covers only the customer related charges. A flat monthly charge will lower the marginal costs of energy for everyone and increase the economic argument to fuel switch from oil and gas to electricity. Increasing flat monthly charges is not without its detractors, as it would increase costs for low energy users and decrease costs for higher energy users (which will likely impact the poor). Additionaly many energy efficiency advocates do not want to increase flat monthly costs because it reduces the incentive to use less electrcity. These two concerns are both accurate.
A flat monthly charge that differs between income groups would be able to address the concerns
of consumer advocates that do not want electric bills to increase for low income households. The desire to design a tariff that promotes energy efficiency is however directly at odds with the desire to move more energy uses (tranport and space heating and cooling) onto electrcity. Energy efficiency can and should be accomplished outside of the tariff design. Rebates for home energy retrofits are a better method for promoting energy efficiency.
2.2.2 Flat Volumetric Energy Charge
The flat volumetric energy charge is the centerpiece of most residential retail tariffs currently in use. The average price per kWh charged by ComEd in 2016 was $0.10, which remained nearly the same regardless of the time or location of the electricity being consumed.
This type of tariff is responsible for inefficient investment, consumption, and operational decisions. High energy rates incentivize customers to move energy usage away from electricity switching from electric appliances to gas fueled ones like space heaters. In the worst-case scenario, high volumetric energy rates encourage grid defection whereby a user leaves the grid altogether. If this happens, network costs and policy costs are borne by fewer remaining customers which would see an increase in volumetric charges in order to recover the costs. This could in principle lead to a utility "death spiral," as customers defect from the grid, fewer customers remain to share the network costs, which lead to increased costs which lead to more customers defecting, and on and on jdison Electric Institute 2014).
The utility death spiral is still years away. The costs of an off-grid system are still significantly too high to warrant much fear. However, price forecast of photovoltaic and residential battery systems indicate that an off grid system could reach cost parity of a grid connection as soon as 2028 in California's market and by 2039 in northeastern US markets (Laclau 2018).
With flat volumetric energy charges there are no incentives for consumers to modify their demand profiles. In addition, "the recovery of fixed network costs through flat, volumetric tariffs, together with the practice of net metering of demand and behind-the-meter generation, results in skewed incentives for network users with embedded generation" (P6rez-Arriaga et al. 2016).
2.2.3 Capacity Charge
A non-coincident peak (NCP) demand charge is either calculated per year or per month. Many commercial customers in the US and residential customers abroad have a non-coincident peak demand charge. This charge is calculated by measuring the highest load (or averaging some number of highest load events) of a customer during a month (or year) and billing based on that load. NCP demand charges encourage users to reduce their peak load. This will sometimes reduce grid capacity requirements. If a user's individual peak load occurs when there are low levels of demand on the system, then this user does not necessarily impose added costs to the network.
An NCP charge can incentivize the adoption of load shifting and energy storage devices. A major drawback of an NCP demand charge is that it is not reflective of the system's conditions, as a customer's peak demand may occur when there is ample slack in the system, but they will still be charged for their individual peaks.
Similar to NCP, a coincident peak (CPC) capacity demand charge is calculated based on the customer load during the system's peak demand. Smart meters can record the users' demand level and calculate a bill based on each user's contribution to the system's peak.
CPC charges encourage customers to reduce their load during peak demand events. With a CPC charge, the price of energy during other times of year would be reduced compared to the default tariff. CPC charges could incentivize fuel switching from gas to electric for loads that can be controlled to be shut off during the system's peak demand.
If a system peak reduces as a result of customer responsiveness, the network's capacity
requirements could be relaxed which would reduce costs for the whole system. If fuel switching occurs and more load is brought on to the network, then the capacity factor of the network would improve and the average cost of the network per kwh of electricity would decrease.
2.2.4 Time Variant Energy Charges
Combining smart meter information with actual system operating conditions allow for the calculation of detailed locational and time variant prices (P6rez-Arriaga et al. 2016). If fact,
"some power systems, such as that in use in Spain, have started to apply wholesale day-ahead hourly energy prices to residential customers in the integral default tariff" (Pdrez-Arriaga et al. 2016).
Smart meters allow utilities to improve their design of prices and charges for different classes of customers, and to charge different per kWh rates based on different times. This section briefly introduces the most common time variant charges used by electric utilities.
Real Time Pricing (RTP) energy charges are based on the wholesale marginal costs determined
in the PJM markets. RTP incentivizes customers to reduce energy usage when prices are high and, importantly, it would provide incentives to customers to increase consumption when prices are low. This opens the door for smart controls on thermostats to shift load from high price periods to low price periods.
A simpler tariff scheme is the so-called Time of Use (TOU) pricing. Regulators and utilities have
been reluctant to expose residential consumers to volatile and unpredictable prices fearing customer backlash. In an attempt to try to gain some of the efficiency benefits of real time prices, many regulators and utilities have compromised by adopting TOU energy charges. These rates are easy for customers to understand and generally involve a predefined schedule of energy prices for two or three different periods in a day. TOU schedules may also include seasonal changes in price
(CPUC 2019).
However, time of use tariffs have many disadvantages. The MIT Utility of the Future states that, "The obvious shortcoming of TOU tariffs is that the time intervals in which the
different prices and charges apply are established long in advance, are fixed for long periods of time (e.g., a season or year), and may not correspond to the actual conditions in real time. This renders the temporal incentives provided by these tariffs inefficient in most cases. In addition, many TOU rates continue to bundle generation and network costs into the (time-varying) volumetric rate, which distorts incentives for network usage" (P6rez-.A\rriaga et al. 2016).
Another tariff component is Critical Peak Pricing (CPP) which introduces charges during a few "critical" hours of the year. Utilities are allotted a number of critical peaks that they can activate when they expect the system to be stressed or wholesale prices to be very high. Utilities generally notify consumers the day before CPP takes effect. CPP can be combined with a flat volumetric energy charge or with time-of-use energy charges. A well designed CPP tariff can effectively charge customers their marginal contribution to
"the systems costs during the few hours of the year that drive the largest share of system costs [...J CPP tariffs, however, fail to capture more regular, hour-to-hour, and day-to-day variations in the price of electricity services, and may lack sufficient locational granularity " (l36rez- Arriaga et al. 2016).
Peak Time Rebates (PTR) are very similar in function to CPP. For a few critical hours of the
year the utility offers rebates for reducing consumption. Customers are generally alerted the day before PTR go into effect (Portland General Electric 2019). This protects customers from being exposed to high CPP, but increases costs during all other hours of the year in order to pay for the rebate. A major challenge is that, the PTR program has to predict what a customer energy usage would have been in order to offer a rebate for reductions in energy use.
The design of a retail tariffs influences the behavior and investment decisions of customers. "Well-designed prices and charges can incentivize investments in and operation of DERs in ways that yield lower costs for customers and the system as a whole. Ill-designed prices and charges can incentivize outcomes that yield lower costs for some customers but may not necessarily yield lower costs system-wide" (P6rez-Arriaga et al. 2016).
Faruqui and Sergici (2013) reviewed a data base of 163 energy-only tariff trials. TOU was the least successful compared to other energy charges at reducing peak load as shown in Figure 2-1. When utilities offered smart thermostats along with a new tariff, much higher peak reduction occurred than with the new tariff alone.
10%
50%
1 163
Prichug Test
2.3
Drawbacks of Current Residential Tariff Designs
Residential tariffs that rely primarily on a flat volumetric energy charge lack the economic signals to efficiently and equitably deliver electricity to consumers. Consequently, consumer cross-subsidization, an inefficient electricity system, and lack of incentives for the adoption of distributed energy resources are some of the problems being experienced by systems relying in this tariff
system.
2.3.1 Economic Inefficiencies
Efficient markets have prices that reflect the social marginal cost of supply. In the electricity sector, social marginal cost is dependent on the marginal cost of fuel for generators, the marginal pollution externalities of generating electricity, and the marginal impact on grid capacity requirements. All of these marginal prices vary widely across hours of the day and from location to location. Retail electricity prices, on the other hand, are often neither locational or time dependent. Instead, utilities charge a flat rate that may vary a little from month to month. The largest source of difference between social marginal cost of energy and marginal retail cost of energy is the failure to adopt time variant prices (Borenstein and Bushnell 2018).
The difference between social marginal cost and a flat retail marginal cost can produce two forms of dead weight loss (DWL): consumers use more energy during peak times, and consumers use less energy during off peak hours than they would if they were charged time variant prices. Real-time locational marginal prices that include cost for pollution externalities can, theoretically, capture all of the DWL. Time of Use prices, critical peak prices, and coincident peak demand charges are all steps toward real-time location marginal prices, but at best they can only reduce 50% of the DWL associated with flat volumetric charges (Jacobsen et al. 2018).
2.3.2 Cross Subsidies and Equity
If one user group helps pay for the costs of another, then cross subsidies occur between the user
groups. Flat volumetric tariffs are not cost reflective; therefore, electricity bills may not accurately reflect the costs that customers impose on the system. This allows for several different cross subsidies to occur.
One of the largest cross subsidies that occurs is between flat energy users and peaky energy users.
A consumer's load factor is the ratio of a consumer's average power to their peak power across the
same period of time. Flat users will have a value close to 1:1. The capacity of the electric grid is determined by the peak demand, not by average power demand. Therefore, a user's peak demand, particularly if it aligns with the system's peak, will have a greater influence on the capacity of the system than their average energy demand. Furthermore, the wholesale price of power is often more expensive during off peak hours as shown in Figure 2-2.
Wholesale Price vs System Demand
80-
~60-Temp . - * 30 -, 20 40- -0 --1 10600 14600 1800ComEd System Demand (MW)
Figure 2-2: Wholesale Price and System Demand in the ComEd System Territory (S&P Global Market Inteligence 2018)
Electric devices that are inherently flat across all hours of the day include items like refrigerators, freezers, cable boxes, and clocks radios. The load factor of these devices will be close to 1: 1. Electric appliances like hot water heaters and clothes dryers can spike energy usage during a single hour of the day, because they only need to run for an hour or two, they may have a load factor of 1:24. Air conditioners will increase a user's summer time energy consumption but have no impact on a user's winter electricity consumption and are only operated when the temperature is high. Air conditioners may have a load factor of 1:50.
With current flat volumetric energy bills, both flat users and peaky users will have identical electric bills assuming the same level of consumption. The cost of the system's capacity is recovered across all hours of the year so the flat user and the peaky user will pay the same amount of money to the support the capacity of the system. From an economic perspective, the flat user is helping to subsidize the energy usage of the peaky user. A cost reflective electric tariff, that includes a capacity charge can efficiently charge users for the costs they impose on the system and eliminate the cross subsidy.
Another example of cross subsidization can be seen in full-time residents, versus vacation houses. Houses that are only occupied during certain periods of the year will have much lower load factors. The costs of connection, as discussed in section 2.1.1, does not change based on the amount of total energy the house consumes or the number of days a year that a building is occupied. Vacation