An Assessment of the Economic, Regulatory and Technical
Implications of Large-Scale Solar Power Deployment
by
James Hubert Merrick
B.E., Civil Engineering, University College Dublin (2006)
Submitted to the Engineering Systems Division and the Department of Electrical Engineering and Computer Science
in partial fulfillment of the requirements for the degrees of Master of Science in Technology and Policy
and
Master of Science in Electrical Engineering and Computer Science at the
MASSACHUSETTS INSTITUTE OF TECHNOLOGY September 2010
c
Massachusetts Institute of Technology 2010. All rights reserved.
Signature of Author . . . . Engineering Systems Division and the Department of Electrical Engineering and
Computer Science August 6, 2010 Certified by . . . . Joshua Linn, Ph.D. Executive Director, MIT Study of the Future of Solar Energy Thesis Supervisor Certified by . . . . Ignacio J. P´erez-Arriaga, Ph.D. Visiting Professor, Engineering Systems Division Thesis Supervisor Accepted by . . . .
Terry P. Orlando, Ph.D. Professor of Electrical Engineering Chair, Committee on Graduate Students, Department of Electrical Engineering and Computer Science Accepted by . . . .
Dava J. Newman, Ph.D. Professor of Aeronautics and Astronautics and Engineering Systems Director, Technology and Policy Program
An Assessment of the Economic, Regulatory and Technical Implications of Large-Scale Solar Power Deployment
by
James Hubert Merrick
Submitted to the Engineering Systems Division and the Department of Electrical Engineering and Computer Science
on August 6, 2010, in partial fulfillment of the requirements for the degrees of
Master of Science in Technology and Policy and
Master of Science in Electrical Engineering and Computer Science
Abstract
Electricity from solar energy has many favourable attributes. Despite its current high cost relative to other technology options, a combination of cost reductions and policy support measures could lead to increasing deployment of solar power technologies.
Should this pathway occur, the unique technical and economic characteristics of photovoltaics (PV) and concentrating solar power (CSP) technology will have implications for the wider electric power system. Similarly, the characteristics of the many elements that constitute electric power systems will have implications for the efficient deployment of these technologies. This thesis attempts to assess these technical and economic implications, and derive regulatory implications that result. A static cost-minimisation expansion model with an 8760 hour temporal resolution, adapted from the literature, was developed in order to undertake this investigation. Following analytical development of the model formulation, the model was numerically applied to a simplified repre-sentation of the ERCOT power system. This application involved assessing changes in investment, dispatch, prices and emissions across various solar power deployment scenarios. The final portion of the thesis then addressed the complexities associated with developing the necessary transmission that may accompany large-scale solar power deployment.
Findings from this work include: a) an explicit representation of the components that constitute the marginal system value of PV capacity under transmission constraints b) reasoning for why the optimal system with large scale solar power capacity includes less baseload capacity in the long term - and insights into how this may not be feasible in real systems, and c) a presentation of how solar power deployment paths diverge across capacity and energy support schemes, and across type of solar technology. In addition, it is found that: d) under perfect conditions, locational market prices will provide the adequate locational signals for ‘system-efficient’ deployment, provided that the solar generators ’see’ the signals in their objective functions, and e) the appropriateness of transmission charges for solar generators will vary by circumstance - any charge warranted should be considered in tandem with the system pricing mechanism and any renewable support scheme in place.
Thesis Supervisor: Joshua Linn, Ph.D.
Title: Executive Director, MIT Study of the Future of Solar Energy
Thesis Supervisor: Ignacio J. P´erez-Arriaga, Ph.D. Title: Visiting Professor, Engineering Systems Division
Acknowledgments
The Massachusetts Institute of Technology is a special place, and I have gained more from my experience here than I could have dared hope for upon my arrival. There are many people to acknowledge for their support in the intervening 2 years.
Of most immediate relevance to this document, I am indebted to my two thesis supervisors, Dr. Joshua Linn and Professor Ignacio P´erez-Arriaga for the advice, guidance, time, and encouragement they have provided me throughout this thesis process. I have learned an immense amount.
Particularly, I thank Joshua Linn for initially providing me with the opportunity to join the MIT Future of Solar Energy Study, while I thank Ignacio P´erez-Arriaga for supporting my dual degree petition, thus allowing this thesis to meet the requirements of a dual degree with Course 6.
I thank Professor Andr´es Ramos and Dr. Luis Olmos, from whose collaboration this thesis has benefitted significantly. This thesis has also benefitted from data and insights provided by fellow students Anya Castillo, Trannon Mosher, Diana Chiyangwa, and Yuan Yao.
I thank the people at NREL for their hospitality during my visit to Colorado in June of 2009 and I thank Mr. Steve Connors for helping to arrange that visit. In particular, I thank Mr. Matt Mowers of NREL for his assistance both during the visit and in the time that has passed since.
I thank the MIT Future of Solar Energy Study, and thus the Chesonis Foundation, for financial support during my time here. It was a privilege to work with, and learn from, the various faculty involved. I also wish to thank the staff at the MIT Energy Initiative for making the 3rd floor of E19 such a pleasant working environment.
I thank Ms. Sydney Miller and Mr. Ed Ballo at TPP for all their advice and for ensuring administrative matters were always fun to sort out. On the EECS side, I thank Ms. Janet Fischer for making the administrative organisation of the dual degree proceed so smoothly.
TPP is a unique program that I am fortunate to have been a part of, and I thank Professor Dava Newman and Dr. Frank Field for providing the leadership that makes TPP what it is. In addition, I thank all the faculty who put so much time and effort into teaching such demanding, yet ultimately rewarding, graduate level courses at MIT. A particular thank you to Professor Dave Marks for his invaluable advice when I was deciding whether to accept MIT’s offer (and on many occasions since). Meeting fellow students from across the Institute has been truly inspirational, and will likely endure as the highlight of my time at MIT. I thank them all for their friendship over the past two years. Particular mention should go to fellow students in E19, TPP, the MIT Energy Club, Sidney Pacific, and the MIT Irish Association.
The support of my USA-based friends prior to my arrival and throughout my time here has been invaluable. I particularly thank Ms. Bess Pierce for her friendship and support in this regard.
I would not be submitting this thesis without the encouragement and support I have received from all of my family throughout my life to date. I would like to especially acknowledge the kindness of my Godparents Noel and Helen.
Finally, I dedicate this work to my siblings, Brian and Caoimhe, and my inspirational parents, Matt and Catherine - to whom I owe the greatest thanks.
Contents
1 Introduction 17
1.1 Motivation . . . 17
1.2 Thesis Research Questions . . . 18
1.3 Approach . . . 18
1.4 Summary of Findings . . . 19
1.5 Structure of Thesis . . . 21
2 Context 23 2.1 Electric Power Systems . . . 23
2.1.1 Technologies . . . 23
2.1.2 Economics. . . 25
2.1.3 Policies / Regulatory Structure . . . 25
2.2 Electricity from Solar Energy . . . 26
2.2.1 Technologies . . . 26
2.2.2 Economics. . . 28
2.2.3 Policy . . . 29
2.2.4 Solar Electricity Characteristics. . . 32
2.3 Why Consider the Implications of Large-Scale Solar Power Deployment? . . 40
2.3.1 Justifications for Renewable Energy Deployment . . . 40
2.3.2 Why Solar Power? . . . 41
2.4 Chapter Summary . . . 43
3 Previous Work 45 3.1 Technical Implications . . . 45
3.3 Regulatory Implications . . . 50
3.4 Chapter Summary . . . 52
4 Modelling Methodology 53 4.1 Expansion Model Overview . . . 54
4.2 Approach Chosen . . . 55
4.2.1 Application of Model. . . 56
4.2.2 Modelling of Renewable Energy . . . 56
4.3 Limitations of Modelling . . . 58
5 Expan Model Formulation and Analytical Development 59 5.1 Model Structure . . . 60
5.1.1 Terminology . . . 60
5.1.2 Model Formulation . . . 61
5.1.3 Core Analytical Development . . . 62
5.2 Source of Nodal Price Differentiation . . . 64
5.3 Model Investment Decisions . . . 65
5.4 Marginal ‘System’ Value of PV or Wind Capacity Under Network Constraints 67 5.4.1 Framework Development. . . 67
5.4.2 Framework Discussion . . . 69
5.4.3 Comparison with Value of Dispatchable Conventional Capacity . . . 72
5.4.4 A Note on Curtailment . . . 73
5.5 Model Extensions . . . 73
5.5.1 Renewable Energy Support Mechanisms . . . 74
5.5.2 Carbon Constraints . . . 76
5.5.3 Role of Underlying System . . . 76
5.5.4 Concentrating Solar Power . . . 77
5.5.5 Transmission Losses . . . 78
5.6 Comment on Centralised Optimisation Framework . . . 79
5.7 Chapter Summary . . . 79
6 Expan Model Results 81 6.1 Application of Expan Model to ERCOT Systems . . . 81
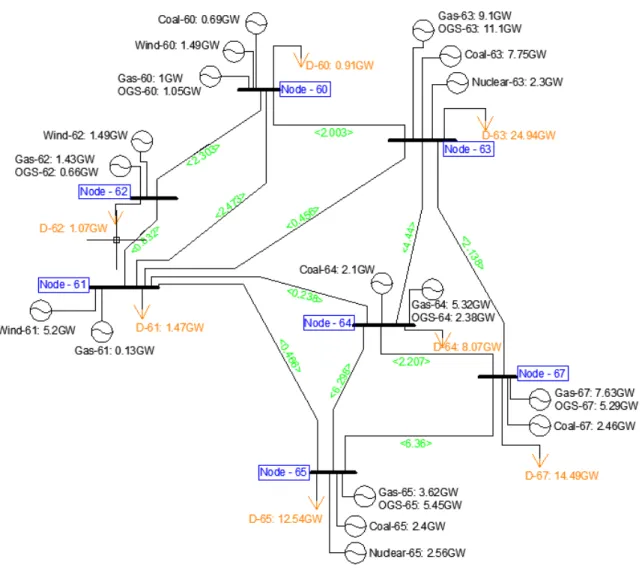
6.1.1 Representation of the ERCOT Power System . . . 81
6.1.2 Limitations of Expan model . . . 83
6.1.3 Implementation of Model . . . 85
6.1.4 Data . . . 85
6.2 Numerical Application of Chapter 5 Development . . . 86
6.2.1 Comparison of 4 Illustrative Cases . . . 87
6.2.2 Marginal System Value of a Remotely Located Renewable Generator 89 6.2.3 Further Consideration of Wind/Solar Interaction . . . 94
6.2.4 Comparison with Conventional (Gas) Capacity . . . 95
6.2.5 Qualification . . . 96
6.2.6 Discussion. . . 96
6.3 PV Deployment Results . . . 97
6.3.1 Investment . . . 99
6.3.2 Dispatch and Scheduling. . . 105
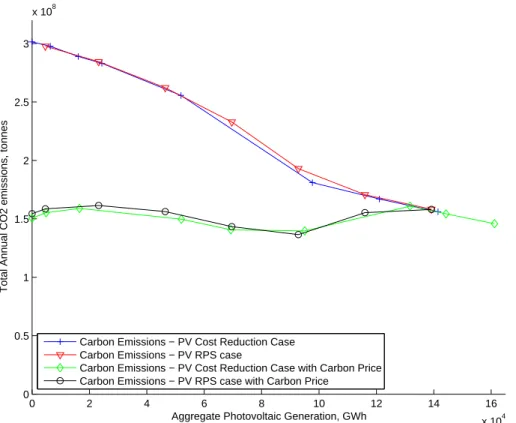
6.3.3 Carbon Emissions . . . 106
6.3.4 Nodal Pricing . . . 112
6.3.5 Components of Objective Function . . . 112
6.3.6 Discussion. . . 114
6.4 CSP Deployment Results . . . 116
6.4.1 Investment . . . 117
6.4.2 Dispatch and Scheduling. . . 120
6.4.3 Carbon Emissions . . . 124
6.4.4 Nodal Pricing . . . 125
6.4.5 Components of Objective Function . . . 127
6.4.6 Discussion. . . 127
6.5 A Note on Baseload Displacement . . . 129
6.6 Chapter Summary . . . 130
7 Application of ReEDS Model 135 7.1 Introduction and Qualifications . . . 135
7.2 ERCOT ReEDS Results . . . 136
7.2.2 Operation and Dispatch . . . 139
7.2.3 Evolution Across Time. . . 140
7.2.4 Transmission Investment. . . 143
7.3 USA Results . . . 143
7.4 Chapter Summary . . . 145
8 A Focus on Transmission 147 8.1 The Relevance of Transmission to Solar Power Deployment . . . 148
8.2 The Capacity of a Transmission Line . . . 148
8.2.1 Thermal Constraints . . . 149
8.2.2 Voltage Constraints . . . 150
8.2.3 System Operation Constraints . . . 150
8.3 Cost Recovery. . . 152
8.4 Cost Allocation . . . 153
8.4.1 Principles of Allocation . . . 154
8.4.2 Implementation Difficulties . . . 154
8.4.3 Proxies based on Network Utilisation. . . 155
8.5 Implications for Solar Power in Market Environment . . . 157
8.5.1 Objective Function of Photovoltaic Investors . . . 157
8.5.2 Margin on Solar Investment . . . 158
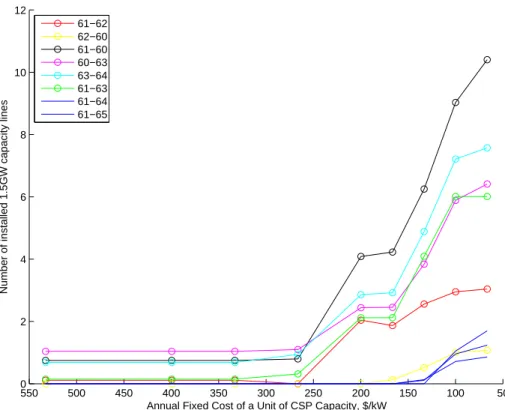
8.5.3 Effect of Transmission Charge on Generators . . . 158
8.6 Chapter Summary . . . 170
9 Conclusions, Findings and Recommendations 173
10 Future Work 183
Bibliography 191
A GAMS Code of Base Expan Model 193
B Sample MATLAB Code to Plot Figures 201
List of Figures
2-1 Schematic Representation of Typical P-V, I-V Relationships for a Photo-voltaic Cell . . . 33 2-2 Equivalent Electric Circuit of a Photovoltaic Cell . . . 34 2-3 Equivalent Electric Circuit and Phasor Diagram for a Synchronous Machine 35 2-4 Global Insolation Duration Curve for McCamey, Texas . . . 36 2-5 Extraction of 48 Sample Chronological Hours from Data of Figure 2-4 . . . 37 2-6 15-Minute 2005 Inverter Power Output for PV system at Florida Gulf Coast
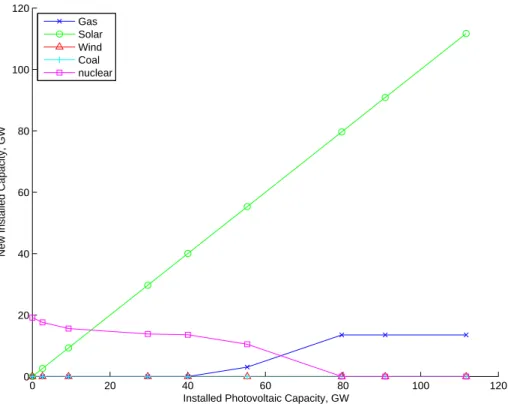
University . . . 37 6-1 Schematic Diagram of ERCOT System Representation . . . 82 6-2 Diagram Representing Existing ERCOT System as per Model Inputs . . . . 83 6-3 New Generation Capacity versus Declining PV Fixed Costs . . . 99 6-4 New Generation Capacity versus PV Capacity (cost reduction case) . . . . 100 6-5 Total Generation Capacity versus Declining PV Fixed Costs. . . 100 6-6 New Generation Capacity versus PV Capacity (for ERCOT system built anew)102 6-7 New Generation Capacity versus PV Capacity (RPS case) . . . 102 6-8 PV Capacity by Node versus Aggregate PV Capacity (cost reduction case) 103 6-9 PV Capacity by Node versus Aggregate PV Capacity (RPS case) . . . 103 6-10 New Generation Capacity versus PV Capacity under a Carbon Price of
$30/tonne (cost reduction case) . . . 104 6-11 New Generation Capacity versus PV Capacity under a Carbon Price of
$30/tonne (RPS case) . . . 104 6-12 Transmission Investment versus PV Capacity for Both Deployment Paths . 105 6-13 Generation by Technology versus PV Capacity (cost reduction case) . . . . 107 6-14 Generation by Technology versus PV Capacity (RPS case). . . 107
6-15 Load Duration Curves for different scales of PV Deployment. . . 108 6-16 Production Profile for 15 Sample Summer Days - Base Case . . . 108 6-17 Production Profile for 15 Sample Summer Days - 15% PV RPS (37GW
name-plate capacity) . . . 109 6-18 Production Profile for 15 Sample Summer Days - 30% PV RPS (79GW
name-plate capacity) . . . 109 6-19 Curtailment of Renewable Generation versus PV Capacity (cost reduction
case) . . . 110 6-20 Curtailment of Renewable Generation versus PV Capacity (RPS case) . . . 110 6-21 Carbon Emissions versus PV Generation (cost reduction and RPS cases). . 111 6-22 Price Duration Curve - Base Case (0 GWPV capacity) . . . 113 6-23 Price Duration Curve - 15% PV RPS case (37 GW PV capacity) . . . 113 6-24 Change in Objective Function Components Across Model Runs (PV capital
cost reducing from left to right) . . . 114 6-25 Change in Objective Function Components Across Model Runs (RPS
in-creasing from left to right) . . . 115 6-26 New Generation Capacity versus Declining CSP Fixed Costs . . . 118 6-27 New Generation Capacity versus CSP Capacity . . . 118 6-28 New Generation Capacity versus CSP Capacity under a Carbon Price of
$30/tonne . . . 119 6-29 CSP Capacity by Node versus Aggregate CSP Capacity . . . 119 6-30 Transmission Investment versus CSP Capacity . . . 120 6-31 New Transmission Capacity by Corridor versus Declining CSP Fixed Costs 121 6-32 Generation by Technology versus Declining CSP Fixed Costs . . . 121 6-33 Generation by Technology versus CSP Capacity. . . 122 6-34 Generation by Technology versus CSP Capacity under a Carbon Price of
$30/tonne . . . 123 6-35 Load Duration Curve (24.5GW CSP Capacity) . . . 123 6-36 Production Profile for 15 Sample Summer Days (25GW CSP capacity) . . . 124 6-37 Production Profile for 15 Sample Summer Days (37% of annual electrical
energy provided by CSP) . . . 125 6-38 Carbon Emissions versus CSP Capacity (with and without a carbon price). 126
6-39 Price Duration Curve - Base Case (0GW CSP capacity) . . . 126
6-40 Price Duration Curve (24.5GW CSP capacity) . . . 127
6-41 Change in Objective Function Components Across CSP model runs. . . 128
6-42 Screening Curve Methodology Applied to PV Load Duration Curve. . . 131
7-1 2030 ERCOT ReEDS Installed Capacity versus Declining PV Capital Costs 137 7-2 Change in Capacity by Technology from 2006 to 2030 versus 2030 PV capacity137 7-3 Distribution of Installed PV Capacity . . . 139
7-4 2030 ReEDS Generation by Technology versus PV Generation. . . 140
7-5 ReEDS Generation Profile for 0GW of Installed PV Capacity in 2030 . . . 141
7-6 ReEDS Generation Profile for 34GW of Installed PV Capacity in 2030 . . . 141
7-7 Evolution of Installed Capacity for Base Case PV Costs . . . 142
7-8 Evolution of Installed Capacity for Case with 60% Uniform Reduction in PV Cost Pathway . . . 142
7-9 ReEDS Transmission Investment versus Declining PV Costs . . . 143
7-10 2030 USA ReEDS Installed Capacity versus Declining PV Costs . . . 144
7-11 2030 USA ReEDS Generation by Technology versus Declining PV Costs . . 144
8-1 Generation, Demand, and Flows at Sample Hour 2869 . . . 163
8-2 Results of Average Participations Methodology Applied to Generation at Node 61 (in hour 2869) . . . 164
8-3 Results of Average Participations Methodology Applied to Demand at Node 63 (in hour 2869) . . . 165
9-1 Global Insolation Duration Curve for McCamey, Texas . . . 175
9-2 New Generation Capacity versus PV Capacity (cost reduction case) . . . . 177
9-3 Transmission Investment versus PV Capacity for Both Deployment Paths . 178 9-4 Production Profile for 15 Sample Summer Days . . . 179
9-5 Production Profile for 15 Sample Summer Days . . . 179
List of Tables
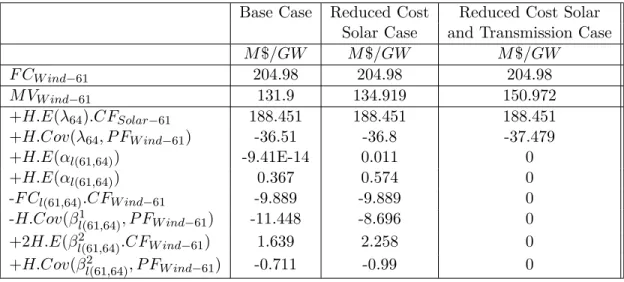
2.1 Costs of Electricity Generation . . . 29 2.2 PV and CSP Generation Characteristics Compared . . . 39 6.1 Solar Resource Information for ERCOT System (as applied in Expan model) 84 6.2 New Generation Capacity across 4 Illustrative Cases . . . 87 6.3 New Power Transmission Capacity across 4 Illustrative Cases . . . 89 6.4 Marginal Value of PV Capacity at Node 61 under Transmission Constraints 92 6.5 Marginal Value of PV Capacity at Node 61 (3.7% RPS case) . . . 93 6.6 Marginal Value of Wind Capacity at Node 61 under Transmission Constraints 93 6.7 Correlation Between PV Production Factor and Wind Production Factor . 95 6.8 Marginal Value of Gas Capacity at Node 61 across 3 Illustrative Cases . . . 95 8.1 Transmission Cost Recovery Comparison for a Chosen Case . . . 153 8.2 Beneficiaries of Additional Line Installation Between Nodes 61 and 63 . . . 161 8.3 Losers from Additional Line Installation Between Nodes 61 and 63 . . . 161 8.4 Allocation by Node of Generator’s Portion of (New) 61-63 Line Cost under
Allocation to Beneficiaries Method . . . 162 8.5 Extent of Generator’s Use of Transmission Corridor 61-63 by AP method . 162 8.6 Extent of Demand’s Use of Transmission Corridor 61-63 by AP method . . 163 8.7 Contribution Per Unit of Generation (at each node) to Power Flow on Line
61-63 by Modified AP Method . . . 164 8.8 Allocation Amongst Contributing Generation of Table 8.7 . . . 165 8.9 Comparison of AP and AB Allocation of Generator’s Portion of Costs . . . 166 8.10 Profit Per Unit of PV Capacity at Each Node Under Flat PV Feed-in-Tariff
List of Acronymns
AB Allocation to Beneficiaries
AC Alternating Current
AP Average Participations
CaISO California Independent System Operator
CC Combined Cycle
CO2 Carbon Dioxide
CSP Concentrating Solar Power
CT Combustion Turbine
DC Direct Current
DNI Direct Normal Insolation
ERCOT Electricity Reliability Council of Texas
EU European Union
FIT Feed-in-tariff
GHI Global Horizontal Insolation
GW Gigawatt
GWh Gigawatt-hour
kW Kilowatt
kWh Kilowatt-hour
MIT Massachusetts Institute of Technology MITEI MIT Energy Initiative
MW Megawatt
MWh Megawatt-hour
NREL National Renewable Energy Laboratory NYISO New York Independent System Operator
PV Photovoltaics
ReEDS Regional Energy Deployment System RPM Revolutions Per Minute
RPS Renewable Portfolio Standard USDOE/DOE United States Department of Energy
Chapter 1
Introduction
1.1
Motivation
Of humankind’s many technological advances of the 20th century, the National Academy of Engineering has classified Electrification as the greatest engineering achievement of the century [1]. Electricity undoubtedly has brought huge benefits to society, becoming an integral part of people’s lives. As the second decade of the 21st century commences, electric power systems are potentially on the cusp of unprecedented technical change. This can be attributed to a number of factors, including; a) environmental and security externalities associated with conventional forms of electricity generation, b) the finite nature of the fossil fuels that provide the energy for the majority of current conventional generation, and c) the ongoing development and deployment of renewable energy technologies with characteristics different to those of conventional generators.
Solar power represents a subset of these renewable energy technologies, with a produc-tion profile, unlike convenproduc-tional technologies, that is a funcproduc-tion of temporal and spatial distributions. Due to the vast quantity and self-sustaining nature of the solar resource [2], and ongoing cost reductions of the associated technologies, it is reasonable to expect that solar power will contribute to the evolution of electric power systems to meet 21st century needs. Due to solar power’s differing characteristics, an expansion of solar power deploy-ment, whether by policy or market forces or both, will have implications for power systems. In addition the characteristics of the broader power system will have implications for the extent and distribution of solar power deployment.
of these implications is crucial to informing both the array of policies affecting renewable en-ergy and power system development, and the many investment decisions that will determine the evolution of the capital stock of electric power sectors worldwide.
As will be seen throughout this thesis, locational effects matter in this discussion, and thus ‘large-scale’ could refer to ‘large-scale’ on a local level up to ‘large-scale’ on a continent-wide level.
1.2
Thesis Research Questions
Considering the above, the underlying goal of this thesis is to gain an understanding of these implications in order to inform what an efficient path to large-scale solar power deployment may involve. This goal leads to the following set of more specific research questions:
• How do the technical characteristics of power systems, in particular transmission network effects, impact upon the long term value of remotely located solar energy generation?
• How will increasing deployments of solar power affect the optimum generation and transmission mix, under technology cost reduction scenarios and various support poli-cies? What differences can be expected between photovoltaic and concentrating solar power deployment?
• How does pricing of transmission affect solar power deployment outcomes?
1.3
Approach
In order to address the questions of this thesis, the chosen approach has consisted of the following steps:
• How electricity from solar energy is generated was analysed from a technical and economic perspective.
• A linear cost minimisation model of a power system, adapted from the literature, and incorporating both generation and transmission expansion and operation variables, was designed, developed and applied.
• The formulation of this model, entitled Expan, was analytically studied in order to a) understand the tradeoffs that are behind the model results and b) gain insight into the underlying components of the long term marginal benefit of a solar generator in a network system.
• The Expan model was applied to a simplified version of the ERCOT (Texas) power system for a range of scenarios where large quantities of photovoltaics or concentrating solar power may be deployed - because of decreasing cost of technology, application of solar-specific Renewable Portfolio Standards, or existence of a carbon price. Insights into the questions of the thesis were gained by the comparison of patterns across results.
• In an attempt to gain further insight into these issues, the NREL ReEDS model was employed to consider outcomes using a different model structure and input parame-ters.
• Appropriate means to efficiently allocate network investment costs among agents were analysed. In particular, the ‘Average Participations’ network usage estimation methodology was applied to the findings of the Expan model by the interpretation, development and application of the associated algorithm.
1.4
Summary of Findings
The findings, as explained through the document, can be represented as follows:
• A framework for assessing the marginal value a PV (or wind) capacity under transmis-sion constraints was developed. The covariances between the pattern of production of the PV generator with the system price and with the transmission constraint dual variables were found to be significant components.
• The framework allows explicit consideration of the tradeoff between developing poorer quality solar resources close to demand and higher quality solar resources in remote locations. In such a system the cost of transmission reduces the value of solar power -but the extent to which it does so was found to be influenced by the above mentioned covariances. The absolute effects will vary from system-to-system depending on the
nature of the underlying system and the profile of the wind and solar resources in that system.
• The framework allows the cross-effects of wind and photovoltaic power to be con-sidered. For the ERCOT system, photovoltaics were found to slightly increase the marginal value of a unit of wind capacity.
• Under the framework of the Expan model, baseload generating capacity was found to be displaced by large-scale deployment of solar power. Use of the larger ReEDS model highlighted the relevance of what capacity is installed in base case scenarios, with solar power displacing the avoided investment. What technology is displaced by solar power deployment, directly affects the impact of the deployment on carbon emissions.
• The method of PV deployment (cost reductions or policy capacity support versus policy energy support) affects the distribution of the solar power deployment, with implications for associated transmission requirements. A similar divergence was not noted for CSP.
• Increased penetrations of solar power will lead to shifts in the shape of the price duration curve at each node, leading to reductions in wholesale electricity prices. The price duration curves associated with photovoltaic deployment and with CSP deployment differed.
• The benefits of storage to solar power deployment were illustated by the consideration of a number of CSP deployment scenarios.
• Studying the benefits of transmission lines illustrates that the benefits of transmission corridors are not confined to the associated end-generators and end-loads but users throughout the network to varying degrees. The example results presented indicate that the findings are non-intuitive.
• The circumstances where it may, or may not, be appropriate to allocate transmission charges to solar power generators were identified.
• The inefficiency of not including locational signals in the objective functions of renew-able energy generators was explicitly shown.
1.5
Structure of Thesis
The structure of the thesis is as follows: Chapter2provides context to the issues addressed, Chapter 3 discusses previous work in the literature relevant to this multi-disciplinary the-sis, and Chapter 4 concludes the introductory chapters by discussing the thesis modelling methodology. As for the chapters based on analytical and numerical analysis: Chapter 5 presents the Expan model structure, along with associated analytical development, Chap-ter 6 presents results of the application of this model to the ERCOT system, Chapter 7 discusses the NREL ReEDS model, while Chapter 8 considers one issue of importance in depth - transmission of solar power.
The thesis concludes with the findings and recommendations of Chapter 9, followed by a discussion of future work (Chapter 10), the Bibliography and Appendices.
Chapter 2
Context
In order to provide context for this thesis document, this chapter outlines the technical, economic, and regulatory characteristics of both generation of electricity from solar energy and the electric power sector in general. In particular, the core elements that differentiate solar electricity generation from traditional modes of electricity generation are discussed, focussing on the temporal and spatial resolution of the solar resource.
2.1
Electric Power Systems
Many comprehensive references exist relating to the broad array of technical, economic and policy issues relevant to the huge industrial structures that are modern electric power systems.1. This section thus only aims to provide a brief overview of the primary points relevant to this thesis document.
2.1.1 Technologies
Generation
Practically all of the world’s electricity is currently generated by synchronous machines. To generate the required voltage to drive current through the circuits, transformers, and resistive and inductive loads that constitute a power system, the rotor component of these machines is rotated by means of energy provided by a prime mover resource. The source of this energy has traditionally come from the combustion of fossil fuels, the extraction of
1
the potential energy of water in a reservoir, nuclear fission and more recently, from wind energy and thermal energy collected from the sun. As will be discussed later, photovoltaics are an alternate means of electricity generation.
Power systems have evolved as Alternating Current systems, with the ability to increase and decrease voltages with transformers a reason for this evolution. Thus the systems are driven by a sinusoidal waveform of 50 to 60 cycles per second, depending on the region of the world, requiring a 2-pole generator in a 60Hz system to rotate at 3600 RPM or a 4 pole generator to rotate at 1800 RPM.
A relevant point about the current paradigm of electricity generation is that it is largely controllable and dispatchable in line with system requirements, subject to technical and economic ramping constraints of certain technologies.
Transmission and Distribution
Infrastructure is required to connect the electricity generated to the loads on the system. This infrastructure can be categorised as transmission and distribution. In general, trans-mission refers to the high-voltage 3 phase lines that connect large geographic areas whereas distribution refers to local networks that connect homes and businesses with a transmission substation via medium or low voltage and possibly on a 1 phase basis. The distinction between the two categories can be somewhat blurred at medium voltages. Traditionally, generators connect directly to transmission grids and not distribution grids.
Operational and Reliability Considerations
Supply must match demand each instant in the operation of a power system. Considering that users of the power system can freely switch on and off lights, appliances and industrial machinery, operational strategies have been designed to provide a quality electricity service under these conditions. The first step is the forecasting of the aggregate demand on the network, a practice well-honed by experience, to dispatch generation economically with the expected demand. This is followed by a system of primary, secondary, and tertiary reserves, differentiated by timescale - that require generators to increase and decrease output in response to mismatches on the system between generation and demand.
In addition, faults can occur on systems, and components can fail. Thus there are numer-ous security constraints that design redundancy into the system in order to prevent system
collapse in the event of a component failure. These criteria have largely been developed for traditional systems with large quantities of conventional generation.
2.1.2 Economics
It is the imperative of a power system to provide electrical energy in line with market demand and typically, governmental objectives also. To do so in an economically efficient manner appears to be a reasonable paradigm in organising behaviour to meet this imperative. How this translates into modern power systems depends on the organisational structure of a particular system, which will be discussed in the next section. But the main economic decisions that must be made by the market or by a traditional utility can be divided by timescales -long term, medium term and short term.
Decisions in the long term can relate to a timescale of approximately 3 to 30 years into the future. Such long term planning is required due to the long economic lifetimes of generation and transmission assets within the power sector, and thus these long term economic decisions generally relate to investments. Decisions in the medium term can relate to a timescale of 6 months in advance to a number of years in advance. Decisions on this timescale can relate to fuel supply contracts, power purchase agreements, maintenance programs etc. Decisions in the short term generally are in the timescale from hours to weeks into the future and typically relate to the optimal dispatch of technologies in a given hour to the optimal dispatch for the next day to the hydro management plans for the next number of weeks.
2.1.3 Policies / Regulatory Structure
Traditionally, all the technical and economic activities of a given power system were man-aged by a centralised utility within a certain geographic scope (with the possibility of trans-mission between neighbouring utilities). In the 1980s, and through to today, these activities have been de-bundled around the world with the formation of electricity markets for gen-erators, and with transmission and distribution activities remaining regulated monopolies. The overall system is then overseen operationally by one or a combination of entities from the following list: Independent System Operator (ISOs), Market Operators (MOs), and Transmission System Operators (TSOs). Of course design details of each market vary by location. The move from centralised decision making to decentralised decision making by
market agents is a theme that will be of relevance throughout this document in the context of discussing the implications of solar power for electric power systems.
2.2
Electricity from Solar Energy
2.2.1 Technologies
There are two primary categories of technologies to generate electricity from sunlight; a) Photovoltaics (PV) and b) Concentrating Solar Power (CSP). How each of these two classes of technology generates electricity is described in the following paragraphs.2
Photovoltaics
The harnessing of the sun’s energy to generate electricity using photovoltaic panels relies on a principle known as the photovoltaic effect, first identified by Becquerel in 1839, when he noticed that certain materials would produce a small amount of current when exposed to light. It was the mid 20th century by the time it was understood how to harness the photovoltaic effect to produce usable electricity, with the creation of the first operating photovoltaic cell by Bell Laboratories.
A precise explanation of the physics of the solar cell is provided by [12]. In this section the main principles of how photovoltaic cells generate electricity are outlined, with attention paid to points of particular interest to the broad questions of this thesis.
As a brief summation, a photovoltaic cell is composed of two semiconductors, a p-type semiconductor, and an n-type semiconductor, joined together to form a p-n junction. The material primarily used to create these semiconductors, silicon, is a very common material, albeit in a much purified form from its natural state. When the P-N junction is exposed to light, photons in the incoming solar radiation provide the energy to electrons to enable movement from the valence to the conduction band. The charge separation effect of the P-N junction then allows the free electrons to flow around any external circuit connected to the cell, creating a current flow. This current flow can then be harnessed to do useful things. The characteristics of the power produced by this process are discussed in Section 2.2.4.
2
Types of PV Technologies
The different types of PV technologies are differentiated here by category - a) semiconductor material and configuration, b) light collection mechanism, and c) application.
Differentiating by cell material and configuration, the range of semiconductor materials and configurations include: thin-film silicon solar cells, amorphous silicon-based solar cells, CU(InGa)Se2 solar cells, GaInP/GaAs multijunction solar cells, cadmium telluride solar
cells, and dye-sensitised solar cells.
Differentiating by light collection mechanisms, photovoltaic modules (formed from the connection of a range of cells) can be placed in a fixed position at a chosen angle, or to increase the quantity of incoming solar radiation striking the cell, placed on a single or dual axis tracker. Another means of increasing the quantity of sunlight collected is by means of ‘concentrating photovoltaics’, where sunlight is focussed onto the cell by mirrors.
Photovoltaic cells are used for a wide range of applications from spaceships to rooftops to ‘utility-scale’ power plants. Different grid connected applications have different impacts. All of these different options have their own particular properties but for the level of resolution of the modelling in this thesis, a differentiation is not made amongst different types of photovoltaic technologies. The modelling of solar power in this thesis is described in Section4.2.2.
Concentrating Solar Power
Concentrating solar power technologies are a different means of generating electricity than photovoltaics. The CSP electricity generation process can be summarised as follows: i) sunlight is focussed using mirrors onto a common point, ii) at this point a fluid is heated to high temperatures by the concentrated solar energy, iii) the heated fluid is then transferred through a heat exchanger to create steam, iv) the steam is used to create a mechanical torque as per classical thermal cycles such as the Rankine cycle, v) the mechanical torque is then used to rotate the rotor and create the relative fluxes to induce a voltage as per well understood electric machine theory.
Dissimilarly to photovoltaics, only the Direct Normal Insolation (DNI) component of global insolation can be utilised in concentrating solar power plants. This is because DNI, coming in straight parallel lines from the sun, can be accurately directed by the reflector onto
the heat collector. In contrast, the diffuse component of solar radiation has by definition been previously reflected and thus could be approaching the reflector from any number of angles, and thus in turn can be reflected in any number of angles, with only a small probability of being reflected onto the desired focal point.
Types of CSP Technologies
There are three main approaches to concentrate sunlight onto a heat collection area: Linear Concentrator Systems, Dish Systems, and Power Tower Systems. CSP systems also have the capability to thermally store the heated fluid in order to store the energy for conversion to electricity when it may be more financially attractive to do so.
2.2.2 Economics
The economics of solar electricity generation by both photovoltaics and concentrating solar power are dominated by the following characteristics - high upfront capital costs, low oper-ation and maintenance costs, a zero variable cost of production, and for photovoltaics, the less-dispatchable / less-controllable nature of the technology.
Table2.13 shows the capital and operating costs of different generation capacity invest-ment options.
While this table allows comparison between the relative fixed and variable costs of each technology, a full valid comparison cannot be made here between the technology options. This stems from the fact that a number of important factors vary by technology - in par-ticular, hours of production per year and economic life. The ‘levelised cost of electricity’ (LCOE) is a metric commonly used to incorporate these factors.4 An LCOE comparison is not included here as the LCOE of a renewable generator varies considerably by area depend-ing on the quality of the renewable resource in that area. The main point as regards this section however is that, at current costs, solar power is an expensive option for electricity capacity investment in most areas.
Finally, another important component to the economics of a solar energy project is the level and distribution of local electricity prices. Depending on the type of a photovoltaic
3
The numbers above come from [13] with the exception of wind power and solar power costs which come from the NREL ReEDS model (as used in Chapter 7). The NREL numbers are more favourable toward wind and solar power than the EIA numbers from [13]. Note that the CSP number includes a large collector area and 6 hours of thermal storage.
4
Table 2.1: Costs of Electricity Generation
Technology Overnight Annual Fixed Variable Cost Capital Costs Operation Costs of Production5
$/kW $/kW $/M W h Coal 2223 28.15 23 Gas6 968 11.96 41.5 Nuclear 3820 92.04 7 Wind 1740 30.98 0 Solar Photovoltaic 2580 11.94 0 Concentrating Solar 6220 43.86 0 Thermal Power
plant, the relevant metric could be the local wholesale electricity price or the local retail price.
Finally, CSP facilities appear naturally to be a centralised generation technology with strong economies of scale present in their design, installation and operation costs. PV has traditionally been considered a distributed generation technology, with limited economies of scale, as the amount of equipment and area required are directly proportional to energy output [9]. However, this appears to have been counteracted in recent years with the construction of a large number of MW scale plants. Plants at this scale undoubtedly have economies of scale benefits for costs such as permitting, administration, and labour. This trend can be represented by noting that 12 photovoltaic plants greater than 30MW in capacity have been constructed since the start of 2008 [15], and that two plants in California have a planned installed capacity of 550MW and 250MW respectively [16].
2.2.3 Policy
As may be apparent from the preceding discussion, and for reasons that are expanded upon in Section2.3below, solar power has many attractive attributes to policy-makers. Consid-ering this, and the high costs outlined in Table 2.1, much of solar energy development to date has been policy driven. While noting that many possible variants in design and imple-mentation exist, policies that have been implemented in different jurisdictions to support solar energy development include:
5
Assuming heatrates from the same data source.
6Gas here represents gas combined-cycle. Gas combustion turbines have lower capital costs and higher
• Research and Development Support: To reduce the relative cost of still-developing solar power technology in order to boost its market competitiveness, a central compo-nent of solar energy support policies must be research and development. Due to the nature of research, the benefits of the research often accrue to those outside whom the costs directly occur, thus justifying a role for government in providing this ser-vice. Research & Development for solar energy spans from funding basic research on solar energy technologies at universities and at public and private laboratories to sup-porting companies at the initial stage of commercialising a technology, to developing demonstration projects to foster best practice and dissemination of knowledge.
• Feed-in-tariffs: The implementation of feed-in-tariffs is a market stimulation method where the government sets the price rate that producers of renewable electricity re-ceive. Typically, there is a tiered pricing structure with a different price level set by technology. This price (per kWh) is guaranteed to producers for a significant period of time, e.g. to the order of 20 years. There is an incentive for the profit-maximising solar energy producer to reduce costs as much as possible (and install solar capacity in the best locations) in order to maximise the difference between the feed-in-tariff received and the cost per kWh. An alternate scheme involves the payment of a fixed premium above the energy market price for each unit produced. Feed-in-tariffs are popular throughout the European Union, gaining most attention for their first implementa-tion in Germany, and subsequently in Spain. More recent feed-in-tariff programs now in place are in high solar insolation locations such as Italy, Greece and France.
• Solar-specific Renewable Portfolio Standards: The setting of Renewable Portfolio Standards (RPS) is a policy in which a minimum amount of supplied electricity is mandated by legislation to come from renewable energy sources. RPS standards vary in their implementation from authority to authority, however the general form is as follows: - the regional or national government specifies that electricity from sources classified as renewable provide a specified portion of electricity generated by a speci-fied year in their jurisdiction. RPS policies have been popular with states throughout the United States, and a national RPS was included in the energy legislation passed by the U.S. House of Representatives in June of 2009 (this bill has not subsequently advanced through the senate).
Solar-specific RPS policies have been implemented where a portion of supplied elec-tricity is specifically required to come from solar elecelec-tricity, termed a carve-out, or alternatively, a multiplier is applied to electricity produced from solar energy under the RPS scheme (where 1 MWh of solar energy counts as (1τ ) MWh, with τ > 1).
• Tax Credits: Tax credits come in two primary forms - investment tax credits and production tax credits. Investment tax credits allow renewable energy developers to offset a certain percentage of their investment in solar systems from their tax bill. Production tax credits allow renewable energy developers to earn a certain tax credit per kWh produced for the first X years of operation of the system.
In addition, policies in different regions of the world have included rebates and direct subsidies on capital investment to installers of solar energy generating capacity.
In addition, solar energy development is impacted by broader economy and power system policies also, namely:
• A Carbon Price: Policies to address the broader issue of climate change have been implemented, or are in the legislative process, throughout the developed world. These policies vary from market based carbon pricing proposals such as ‘Cap & Trade’ or a carbon tax through to ‘command & control’ policies (which may include RPS measures). In the EU, a ‘cap & trade’ scheme is currently in place. A price on carbon will have a positive impact upon the cost of solar electricity relative to other sources. As deploying solar energy technology in many cases will be more expensive than other carbon emission reducing measures, in the short-term this positive effect may be limited, however a price on carbon is likely to provide a suitable long term signal to the value of solar electricity in a carbon constrained world.
• Power System Operating Rules: How electricity from solar energy is treated under the regulations, standards and grid code of a power system can influence its deploy-ment. Considering the particular characteristics of solar electricity generation, rules that apply to conventional generation may not be appropriate for solar electricity generation - examples include penalties for deviating from market bids, the dura-tion of the window between bid and dispatch, assessment burdens for connecting to transmission and distribution systems, and capacity credit evaluation measures.
A policy of this category that can be favourable to solar (and wind) power are pri-ority dispatch orders that require renewable generation to be accepted at all times, regardless of whether it is the economically efficient thing to do or not.
• Transmission Policy: An area that is discussed in detail later in this thesis (Chapter 8) is access to, and pricing of, transmission in a market environment. This is of particular relevance to locationally constrained generation technologies such as wind and solar power.
2.2.4 Solar Electricity Characteristics
This section describes the power output from both PV and CSP generating technologies, outlines the environmental impact of the technologies and assesses the time-varying char-acteristics of their output.
Power Output from a Photovoltaic Cell
At a given temperature and level of solar radiation, taking the voltage that can be measured across the open circuit terminals of the solar cell, Voc, and current that can be measured by
short circuiting the terminals, Isc, the maximum theoretical power of the solar cell, Pthe,
can be calculated as follows:
Pthe= ISC.VOC (2.1)
Pmax is defined by the greatest possible product of V and I at any point and is defined
as follows:
Pmax = Imp.Vmp (2.2)
Where the combination of (Imp, Vmp) represents the MPP (maximum power point) of
the cell for the given conditions. Figure2-1 graphically represents the above relationships. Figure2-1shows a relatively constant current output from the cell for a range of voltages across the cell. It is thus clear why a photovoltaic cell is typically modelled as a current source. An equivalent electrical circuit for a solar photovoltaic cell can thus be represented as in Figure 2-2. The terminology of Figure2-2is as follows:
Figure 2-1: Schematic Representation of Typical P-V, I-V Relationships for a Photovoltaic Cell
• Id= Current through the Diode - a function of the diode’s saturation current, electron charge, the Boltzmann constant, temperature and a curve fitting constant. The diode component of the PV cell model above is included to model the asymmetry that arises due to the charge separation process at the P-N junction.
• I = Current at the Output Terminals
• V = Voltage at the Output Terminals
• Rs = Series Resistance that represents internal resistance to current flow - depending on the P-N junction depth, impurities and contact resistance
• Rsh = Shunt Resistance is inversely related to leakage current to ground, and can be typically ignored for most applications of the circuit model.
Relationship to Insolation and Temperature
In addition, there are two further noteworthy factors to mention in relation to the pho-tovoltaic cells P-V and I-V characteristics; a) how the cell’s characteristics change with
Figure 2-2: Equivalent Electric Circuit of a Photovoltaic Cell Adapted from [10]
incoming solar radiation (insolation), and b) how the cell’s characteristics change with tem-perature. For changes in insolation, Imp changes linearly while the voltage, Vmp, holds
relatively constant, with the general trend being that power produced is generally directly proportional to the level of insolation. For changes in temperature, both Impand Vmpvary
with the general trend being the power produced by the cell increases as the temperature decreases( for a given level of solar radiation).
As described above, photovoltaic cells produce direct current at low voltages. To be useful to run the electrical devices we are all familiar with, or to provide power to the AC power grid, this electricity typically needs to be converted to alternating current. This is the inverter’s role. Modern inverters are based on power electronics and in addition to converting DC to AC can provide additional services to the grid. Examples of such services include allowing connection at a phase angle that is most beneficial to the local system and the correction of deviations in the sinusoidal wave of the local system.
Power Output of CSP
The equivalent electric circuit of a synchronous machine is as shown in Figure 2-3. Note that it is in this manner that the vast majority of the world’s electricity is generated. The difference in the case of CSP is that the energy that provides the torque to drive the rotor component of the electric generator comes from the sun as opposed to fossil fuel combustion, nuclear fission, or water gravitational difference.
Different relationships then exist between power output and both insolation and temper-ature for CSP compared to PV. As CSP is driven by a thermal cycle, electricity production
Figure 2-3: Equivalent Electric Circuit and Phasor Diagram for a Synchronous Machine Adapted from [10]
per unit electricity generating capacity is a non-linear function of incoming solar radiation, with the function largely depending on the field collector area, the quantity of thermal storage, and turbine capacity. The main points to note are: a) the greater the magnitude of incoming solar radiation, the greater the energy collected to drive the steam cycle, and b) the greater the temperature, the greater the power produced (as the power production thermodynamic cycle is driven by temperature difference).
Time-Varying Characteristics of Photovoltaic Electricity
Previous discussion has focussed on the generation of solar electricity under a static frame-work - given a certain level of insolation how the solar technology generates electricity. Of concern to those managing dispatch on a power system however is how the magnitude of the electricity generated varies over time. The traditional paradigm has been to dispatch conventional thermal generation in accordance with varying demand - well characterised demand which varied on the basis of predictable cyclical daily and seasonal patterns. The entrance of zero variable cost wind and solar photovoltaics onto the system entails that the conventional generation is dispatched in accordance with demand less the time-varying renewable energy production.
Here we consider these time-varying characteristics of photovoltaic electricity under two classifications; a) variability and b) uncertainty.
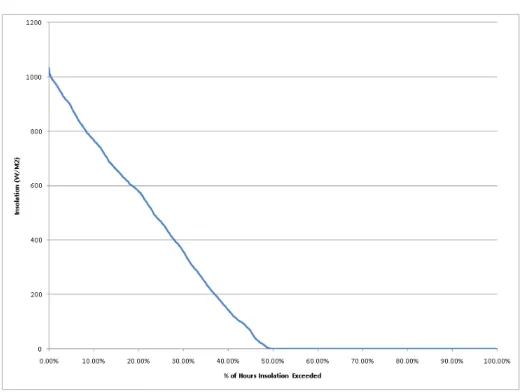
Variability: Variability here is defined as how the power production varies over the hours of the year. The variability of the underlying solar resource is the primary factor of the PV plant’s production variability. One way of presenting the nature of the variability of the solar resource over the year is the ‘insolation duration curve’ of Figure2-4. Figure 2-5 extracts a sample 48 chronological hours from the same dataset, showing how the chronology
Figure 2-4: Global Insolation Duration Curve for McCamey, Texas Hourly data from 1998
of the solar profile is important, due to its potential variability from day to day. While this data is for one location for one year, it does provide an indication of the nature of the solar resource in an area with good solar resources at a southern latitude location in the United States.
Consolidating this insolation duration curve, Figure 2-67 displays the duration curve of the actual power output of a PV system for the year 2005 at Florida Gulf Coast University. It is apparent from these figures that very large-scale solar power deployment will require accompanying technologies if electricity demand is to be satisfied - for example, for 50% of the hours of the year a PV plant will not produce any electricity.
This characterisation relates to hourly and quarter-hourly variability. Variability of solar insolation at shorter timescales (e.g. minute and sub-minute) is also an important consideration. Limited work has been undertaken on the extent of short-term variability but studies have shown that geographic diversity reduces the most extreme ramping cases [17]. [17] also highlight the need for more high-resolution data to characterise solar variability to a greater extent.
Uncertainty: With a given quantity of installed capacity, variability in output can be
7
Figure 2-5: Extraction of 48 Sample Chronological Hours from Data of Figure 2-4
Figure 2-6: 15-Minute 2005 Inverter Power Output for PV system at Florida Gulf Coast University
adjusted for in system operations if the variability of production can be perfectly predicted. However similarly to how weather cannot be perfectly predicted, PV production has some degree of forecast error. This level of forecast error is a function of the climate of a particular area along with the amount of time before the predicted hour. Also predicting aggregate solar output for a region is subject to less error than predicting the output of each particular plant. [18] and [19] quantify the magnitude of forecast errors across different circumstances while [20] provides a comprehensive overview of the forecasting of solar (and wind) power.
Time-Varying Characteristics of Concentrating Solar Power Electricity
While a cloudy day will entail less collected solar energy to drive a steam cycle, the thermal and mechanical inertia inherent in a CSP plant ensures power output will not be as variable over the course of a day as is the case for photovoltaics [21]. Similarly, and for the same reasons CSP power output is not as uncertain as, and more predictable than, PV output.
Environmental Impact
Photovoltaics: As may be apparent when considering the above information, once a pho-tovoltaic plant is in place it has an extremely low impact on the environment, with zero emissions of any kind, and zero requirements for fuel collection and delivery. For those who choose to wash solar panels to maximise performance some water is used.
Producing a finished, operating solar panel from raw earth materials however does re-quire a significant labour, capital and energy input, with associated environmental impacts. It has been shown that the energy payback period for a solar panel can take place in a number of years, depending on the manufacturing process and the incoming solar radiation profile of the location.8 The production process also involves carbon emissions, however these have been found to be offset many times by the carbon-emitting production displaced by the photovoltaic generation over its lifetime [23].
Additional environmental impacts of photovoltaics include those associated with land use and the lifecycle aspects of some chemicals that photovoltaic cells can contain.
Concentrating Solar Power:
Similarly to photovoltaics the energy produced by a CSP plant offsets the energy required
8For example [22] finds an energy payback time of 1 to 2.7 years across a range of Southern European
Table 2.2: PV and CSP Generation Characteristics Compared
Photovoltaics Concentrating Solar Power Equivalent electric circuit Current source Voltage source
representation
Distributed / Centralised Distributed, also recent Large scale centralised generation trend toward centralised
Fuel source Global irradiation Direct normal irradiation Effect of temperature The cooler the better The hotter the better
on performance under (to drive thermal cycle)
a given solar irradiance
Storage No inherent storage Thermal inertia present plus additional thermal storage possible Mechanical inertia No inertia Inertia (synchronous to grid) Power quality Inverter can improve/ Similar to conventional generators
disimprove power quality
Financing Modular nature can Advantage of economies of scale ease financing process can make financing challenging Environmental impact No emissions, some No emissions, water
(primary) impact in manufacturing requirements may be a constraint
to manufacture and construct the plant. [24] finds an energy payback time of 1-2 years for a number of studied plants in Spain.
An environmental impact of CSP production is water use, with the greatest water use coming from cooling requirements. As CSP plants are best suited to areas of high insolation, often desert or desert-like regions, this may be a constraint on CSP deployment. Air cooling can reduce the cooling requirements of a CSP plant by 97% but leads to increased costs in order to install and power the associated fans, in addition to reducing the performance of the steam cycle itself [25].
PV and CSP Characteristics Summarised
Finally, Table 2.2 summarises the characteristics of photovoltaic and concentrating solar power technology presented in this chapter of the thesis.
2.3
Why Consider the Implications of Large-Scale Solar Power
Deployment?
Considering the cost of solar power relative to other technologies displayed above, and the degree of extra complication it brings to the power system, the question might be asked: is there any relevance to understanding the possible implications of large quantities of solar electricity on the power system? A number of reasons are offered below as to why understanding this topic could become increasingly relevant, commencing with commonly cited justifications for renewable energies.
2.3.1 Justifications for Renewable Energy Deployment
Environmental Externalities
Climate change is now widely recognised to be a major challenge facing human kind. Cli-mate change has been attributed to anthropogenic-sourced greenhouse gas emissions [26]. Approximately 55% [26] of the positive radiation forcing of greenhouse gases can be at-tributed to carbon dioxide.9 Carbon dioxide emitting ‘conventional thermal’ electricity generators provide the majority of society’s electricity with some 66.3% of world supply and 70.85% of US supply in 2006 [29]. In contrast, solar power provides a carbon-free way of generating electricity. The benefits of solar electricity in particular in terms of climate change can be seen in [30], where solar photovoltaic capacity is prescribed as one of the 15 ‘wedges’ that can contribute to humankind meeting necessary carbon reductions by mid century. Thus concern about climate change is a potential reason why large-scale solar power deployment may occur.
In addition to climate change, there are a number of additional environmental exter-nalities associated with conventional power generation that are not associated with solar electricity. Fossil fuel burning facilities also emit particles with more direct adverse effects such as SO2 and N OX. Other examples include scarring of natural landscapes by coal
mining, the risk of ecological disaster created by drilling for natural gas, the extremely long-term waste by-products created by nuclear power or the adverse environmental impact associated with the creating of reservoirs for hydro power use.
9
Security Externalities
Energy independence and abstraction from volatility and uncertainty in supply of fossil fuels are an important component of energy policy in western nations.
Solar power provides a means for countries to generate electricity without the uncertain-ties and geopolitical implications of being dependant on fuel from other parts of the world, thus providing the potential to offset what represents a security externality associated with some classes of generation. Perhaps the most striking example in the electricity sector is the high dependence of the European Union on natural gas from Russia.
A point that could fit under a number of categories is that energy from the sun is infinite relative to the finite quantities of conventional generation fuels on the earth. If the scarcity rent of the finite nature of fossil fuels was not included in the fuel price, then their finite nature would represent an additional security externality to conventional electricity generation.
Green Economy / Rural Development
A commonly cited reason to support renewable energy development is of the potential to create new industries and associated job growth.10. In addition, renewable energy support policies can often fit within broader government rural development objectives, providing the potential to bring investment and tax revenues to remote locations. Areas which stand to benefit are thus likely to send representatives to capital cities with renewable energy support measures on their agenda.
2.3.2 Why Solar Power?
The possible reasons outlined above why solar power could become a greater part of the power system could all also be applied to other sources of renewable energy. Considering the lower cost and more advanced state of maturity for wind technology for example, it is valid to ask why focus on solar energy. There are numerous reasons:
• In some areas of the world, solar energy is the greatest resource, and thus will be the focus of any renewable energy investment. Additionally, the solar resource is far greater than the wind resource worldwide [2].
10
• The implications of solar power deployment have been less studied than the implica-tions of wind power deployment.
• Solar power has different characteristics from those of wind power - with a different resource variability profile and a wider spectrum of technologies to convert the resource to electrical energy.
• As [33] states, the cost of PV is decreasing and there are ambitious deployment targets by governments throughout the world - for example, the DOE solar program goals. This has been matched with a large growth in solar power deployment in some areas of the world.
• If a large scale transformation of the world’s electricity systems are to occur in this century, it is very unlikely that this will occur with one technology solely, but will occur with an array of solutions working together cohesively, of which solar power has the potential to play a part.
• Numerous plans have proposed large-scale solar power development [34], [35], [36]. It is useful to think about some of the implications of such plans in the context of the real, functioning power systems that exist today.
There is no certainty that large-scale solar power deployment will occur however reasons exist, as expressed in this section, why such a development may. If it does occur, it will not occur in a vacuum - transmission infrastructure will be required, electrical energy will be in demand when the sun is not shining, power quality will need to be maintained, other forms of electricity generation will be displaced, and regulatory instruments may help or hinder an efficient transformation. In addition, it is likely that large scale solar power development will occur in world where wind power is also a major component of power systems - potentially leading to interesting interactions between these technologies.
This thesis, at a high level, thus attempts to assess the implications of these issues. This assessment can then be used as a framework for analysing the system-specific implications of large-scale solar power deployment across a range of timescales.
2.4
Chapter Summary
The goal of this chapter has been to provide a context for the remainder of this thesis by providing and disseminating background information on electric power systems and on the relevant technologies, policies and economics of solar power. The unique characteristics of solar power were outlined, why solar power may play an increasingly important role in future power systems was discussed, and reasons were presented why the study of the implications of solar power deployment is an interesting and relevant topic.
Chapter 3
Previous Work
This chapter briefly outlines previously undertaken works that address the multi-disciplinary issues that are the focus of this thesis. Much of the literature in relation to the interactions between renewable energies and power systems focuses on wind power.1 Due to a number of similar characteristics between wind and solar power, portions of this literature are relevant here.
In line with the title of this thesis, the discussion below is broadly categorised into three boxes: a) technical implications, b) economic implications and c) regulatory implications. At the core of this thesis is the assertion that these implications are inter-related, and this will be reflected in the discussion below.
Finally, a general distinction can be made in the literature between studies that are system-specific, i.e. have been prepared to assess the impact of renewable generation on a particular system, and those that contain more general findings. This delineation will be noted where relevant.
3.1
Technical Implications
The coarsest technical implication of large-scale wind or solar power deployment for a power system is the necessity for significant transmission investment beyond basic grid-connection requirements. Findings to this effect for U.S. systems include [38], [39] and [40], whilst European examples include [41] and [35]. Large-scale transmission of solar electricity is focussed upon in Chapter 8.
1
For finer, but very relevant technical implications, a distinction can be made between solar energy converted to electrical energy using photovoltaic technology or concentrating solar power technology. Due to PV’s unique characteristics from a power systems perspec-tive the focus of the literature relates to photovoltaics.
The National Renewable Energy Laboratory (NREL) undertook a Renewable Systems Interconnection study with the goal of outlining the technical and analytical challenges that may need to be addressed in order to enable large quantities of distributed renewable energy technologies to enter the power system smoothly. As part of the broader RSI study, [42] outlines a number of technical implications of high penetration levels of photovoltaics on the grid. Findings include a reduction in system inertia and frequency regulation capabilities as conventional generation is ramped down, operation of thermal units in a less efficient manner (more cycling of production), and again due to the advent of variable, less-controllable generation, risks to the dynamic stability of the system.
An issue that is also highlighted by the study is that the current requirement2 for PV systems to disconnect from the grid during times of fault would, in a world with large quantities of PV installed, lead to a large amount of generation disconnecting from the system at the time of the fault, thus propagating the fault. As a precedent, grid codes have evolved in a number of countries to address this very issue - by mandating wind generators to have ‘low voltage ride through’ capabilities.
[42] and [43] highlight the important role inverters have in a world with large amounts of photovoltaics connected to the power system. This important role stems from the fact that it is the inverter that controls the interaction between the photovoltaic facility and the broader power system, and the ability of inverter power electronics to control the phase angle of the output and to correct deviations in the sinusoidal wave of the actual grid voltage. Implicit in this discussion is the requirement for the development of a more active, dynamic transmission / distribution system with real time communication between control centres and agents connecting to the grid to ensure optimum system operation. This is in contrast to the paradigm currently in place where a system is generally designed for a static worst-case scenario.
Another implication of increased quantities of variable and somewhat uncertain
gener-2Under IEEE 1547 ‘Standard for Interconnecting Distributed Resources with Electric Power Systems,