Publisher’s version / Version de l'éditeur:
Journal of Ophthalmology, 2016, 2016
READ THESE TERMS AND CONDITIONS CAREFULLY BEFORE USING THIS WEBSITE.
https://nrc-publications.canada.ca/eng/copyright
Vous avez des questions? Nous pouvons vous aider. Pour communiquer directement avec un auteur, consultez la première page de la revue dans laquelle son article a été publié afin de trouver ses coordonnées. Si vous n’arrivez pas à les repérer, communiquez avec nous à [email protected].
Questions? Contact the NRC Publications Archive team at
[email protected]. If you wish to email the authors directly, please see the first page of the publication for their contact information.
This publication could be one of several versions: author’s original, accepted manuscript or the publisher’s version. / La version de cette publication peut être l’une des suivantes : la version prépublication de l’auteur, la version acceptée du manuscrit ou la version de l’éditeur.
For the publisher’s version, please access the DOI link below./ Pour consulter la version de l’éditeur, utilisez le lien DOI ci-dessous.
https://doi.org/10.1155/2016/5893601
Access and use of this website and the material on it are subject to the Terms and Conditions set forth at
from texture analysis of fundus images
Phan, Thanh vân; Seoud, Lama; Chakor, Hadi; Cheriet, Farida
https://publications-cnrc.canada.ca/fra/droits
L’accès à ce site Web et l’utilisation de son contenu sont assujettis aux conditions présentées dans le site LISEZ CES CONDITIONS ATTENTIVEMENT AVANT D’UTILISER CE SITE WEB.
NRC Publications Record / Notice d'Archives des publications de CNRC:
https://nrc-publications.canada.ca/eng/view/object/?id=0cbb5c28-7c1a-48bc-8cee-a33dade6f153 https://publications-cnrc.canada.ca/fra/voir/objet/?id=0cbb5c28-7c1a-48bc-8cee-a33dade6f153Research Article
Automatic Screening and Grading of Age-Related Macular
Degeneration from Texture Analysis of Fundus Images
Thanh Vân Phan,
1,2Lama Seoud,
3Hadi Chakor,
3and Farida Cheriet
41Biomedical Engineering Institute of ´Ecole Polytechnique de Montr´eal, Montr´eal, QC, Canada H3C 3A7 2Universit´e Libre de Bruxelles, 1050 Brussels, Belgium
3Diagnos Inc., Brossard, QC, Canada J4Z 1A7
4Department of Computer and Sotware Engineering of ´Ecole Polytechnique de Montr´eal, Montr´eal, QC, Canada H3C 3A7
Correspondence should be addressed to Lama Seoud; [email protected]
Received 27 November 2015; Revised 29 February 2016; Accepted 21 March 2016
Academic Editor: Xinjian Chen
Copyright © 2016 hanh Vˆan Phan et al. his is an open access article distributed under the Creative Commons Attribution License, which permits unrestricted use, distribution, and reproduction in any medium, provided the original work is properly cited.
Age-related macular degeneration (AMD) is a disease which causes visual deiciency and irreversible blindness to the elderly. In this paper, an automatic classiication method for AMD is proposed to perform robust and reproducible assessments in a telemedicine context. First, a study was carried out to highlight the most relevant features for AMD characterization based on texture, color, and visual context in fundus images. A support vector machine and a random forest were used to classify images according to the diferent AMD stages following the AREDS protocol and to evaluate the features’ relevance. Experiments were conducted on a database of 279 fundus images coming from a telemedicine platform. he results demonstrate that local binary patterns in multiresolution are the most relevant for AMD classiication, regardless of the classiier used. Depending on the classiication task, our method achieves promising performances with areas under the ROC curve between 0.739 and 0.874 for screening and between 0.469 and 0.685 for grading. Moreover, the proposed automatic AMD classiication system is robust with respect to image quality.
1. Introduction
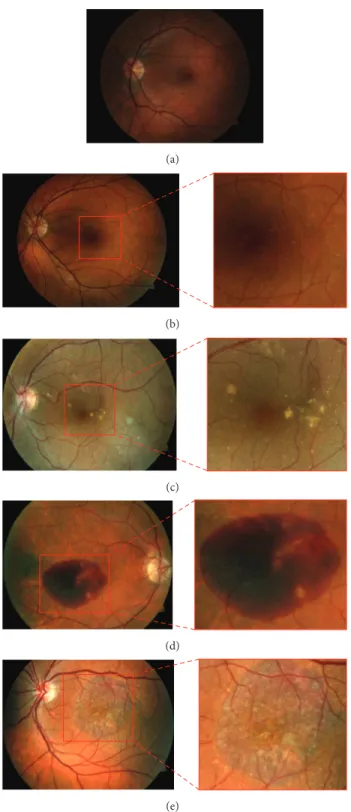
Age-related macular degeneration (AMD) is the main cause of visual deiciency and irreversible blindness in the elderly in Western countries [1]. It combines a variety of disorders afecting the macula. he early stage of AMD is asymp-tomatic, but small lesions, called drusen, can be revealed through examination of the retina. An increase in the size or number of drusen is a sign of the progression of the disease, leading eventually to the presence of hemorrhages (wet AMD) or to the development of geographic atrophy (late dry AMD). he Age-Related Eye Disease Study (AREDS) [2] proposed a simpliied AMD clinical classiication based on its stages. It comprises four categories which are illustrated in Figure 1: non-AMD{1}, mild {2}, moderate {3}, and advanced {4} AMD.
Currently, there is no approved treatment to recover from AMD. However, treatments to slow its progression exist and
are diferent depending on the stage of the disease. hese include prevention of oxidative damage, a treatment strategy based on supplements containing lutein, zeaxanthin, omega-3, vitamins C and E, and zinc, recommended for early stages [2, 3], while anti-VEGF therapy or surgical operations are used for more advanced stages [4].
With an aging population, there is urgent need for routine retinal examinations for early detection of AMD and for long-term follow-up strategies. Telescreening using fundus imaging has been extensively used for conditions like diabetic retinopathy [5, 6]. However, for AMD, it is still in its infancy. Combined with a telemedicine platform, automatic screening and grading from fundus images ofer many inherent advan-tages. hey allow clinicians to monitor susceptible individuals from an early age and to carry out preventive treatment.
Previous works focus mostly on dry AMD screening, based on the detection and quantiication of drusen in fundus images [7]. he drusen segmentation techniques are
Volume 2016, Article ID 5893601, 11 pages http://dx.doi.org/10.1155/2016/5893601
(a)
(b)
(c)
(d)
(e)
Figure 1: Images of macula area for diferent AMD categories: (a) healthy case in category{1}, (b) category {2} with hard drusen, (c) category {3} with sot drusen, and (d) category {4} with hemorrhages and (e) with geographic atrophy.
categorized into methods based on either texture analysis, thresholding, clustering, edge detection, or template match-ing. A number of texture-based methods use Gabor ilters [8], wavelet transform [9, 10], amplitude and frequency modulation [11, 12], statistical structure information [13], or gray-level cooccurrence matrix [14]. he segmentation is based on the response of drusen to the applied texture
method, which is assumed to be diferent from the response of the background. hresholding-based methods aim to ind the appropriate threshold for separating the drusen from the background. his threshold can be set empiri-cally [15] or automatiempiri-cally with Otsu’s method [16]. Some image preprocessing is performed before thresholding using median or Gaussian ilters [17], homomorphic ilters [18], or
morphological operations [19]. Methods based on clustering are used for AMD phenotype-genotype correlation [20] or for identifying AMD [21]. Drusen segmentation can also be achieved through edge detection by identifying abrupt intensity variations using gradient or Laplacian ilters [22]. Finally, template matching methods use circular or Gaussian templates [23] to model and detect drusen using similarity measurements.
Other methods irst detect drusen regions and a classi-ication based on drusen features, using, for example, linear discriminant analysis, �-nearest neighbors, gentle boost, random forest, or support vector machine classiiers, is then performed for AMD screening or assessing the risk of progression to the advanced stage [24–26]. he results show good performance, comparable to trained human observers. However, drusen segmentation does not provide suicient information for a complete AMD grading. In fact, in its advanced stages, drusen are oten not observed, especially when there are large hemorrhages or atrophies. Moreover, even if these methods show high accuracy for hard drusen detection (up to 100%, with the best methods [12, 18]), the segmentation of sot drusen, which characterize the moderate cases, is highly challenging because of their difuse shape [24, 25].
Other works focus on structures characterizing advanced stages, such as what is proposed in [27] which used machine learning for GA detection and segmentation. All these works on drusen and geographic atrophy detection and classiica-tion are useful for a deep analysis of speciic stage of the disease. However, a combination of segmentation methods corresponding to each AMD structure may be computation-ally complex for screening and grading in a telemedicine context, where a large number of images must be analyzed.
To address these limitations, automatic AMD classiica-tion methods were performed based on directly computed image features, without prior segmentation. Kankanahalli et al. proposed a method based on visual context using SURF key points as features and a random forest (RF) for classiica-tion [28]. Diferent binary classiicaclassiica-tions such as{1&2} versus {3&4} or {1} versus {3} and a trinary classiication ({1&2} versus {3} versus {4}) were considered to discriminate the moderate cases. Indeed, close attention to moderate cases is important because even though the patient still has adequate visual acuity, there is a considerable risk of progression to a more severe stage. he proposed method achieves a good accuracy (above 90%) for AMD severity classiication. However, the evaluation was conducted on 2772 images out of 11344 available in the AREDS database (24.4% of the database), selected for their good quality. Since it was trained solely on good quality images, the classiier might not be as efective on images of lower quality. In a telemedicine context, in which the acquisition conditions are not always optimal, poor quality images are oten encountered.
Prior preliminary studies [29, 30] conducted by our group for the evaluation of new features demonstrated promising results with local binary patterns (LBP) in multiresolution for AMD detection. However, the validation was conducted on small datasets and the diferent feature subsets were evaluated individually without considering any combination thereof.
Moreover, these preliminary studies were limited to a binary classiication aimed only at distinguishing images with and without AMD.
he aim of this paper is to propose and to evaluate an automatic approach for clinical AMD screening and grading in a telemedicine framework. hus, it is important to develop a system which is robust to variable image quality. To do so, various features based on texture, color, and visual context were computed, evaluated for their relevance, and used to classify the images according to the diferent AREDS categories. he validation was performed on a highly heterogeneous set of 279 fundus images, acquired through an existing telemedicine platform (CARA for Computer-Aided Retina Analysis, Diagnos Inc., Canada). Additionally, the robustness of the classiication system to poor quality images was evaluated.
he organization of the paper is as follows. In Section 2, the main steps of the proposed AMD classiication method are described in detail. he experimental setup is explained in Section 3. he results are presented in Section 4, followed by a discussion in Section 5 and a conclusion in Section 6.
2. Materials and Methods
Fundus images acquired in a real screening context oten show uneven illumination and poor contrast. To address these issues, a preprocessing step was required. hen, difer-ent features based on texture, color, and visual context were extracted to characterize the fundus image. Next, a classiier modeling step allowed us to measure the relevance of the features. Finally, two classiiers, SVM and RF, were tested on a database of 279 fundus images for performance assessment. 2.1. Image Preprocessing. Image normalization is required to correct the illumination drit introduced by the geometry of the eye and the bright lash of light used by the fundus camera. Contrast enhancement is also necessary to improve the information on details in the fundus images.
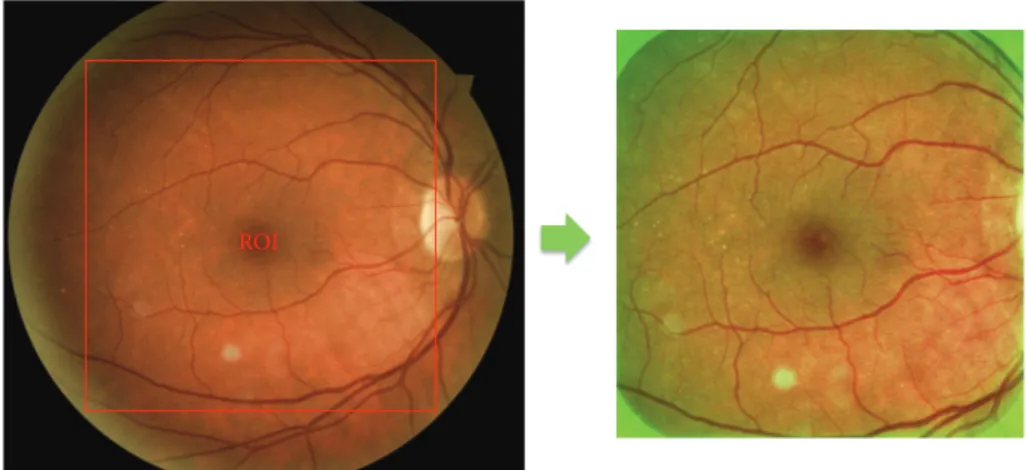
To perform these preprocessing steps, we used the same methodology as proposed in [28] for a fair comparison with their results. First, the region of interest (ROI) was deined as the square inscribed in the circle formed by the retina. hen, the green channel was extracted for preprocessing. A median ilter with a kernel size of one-fourth the size of the ROI was applied in order to estimate the background illumination. he iltered image was then subtracted from the green channel of the original image. Finally, the green values were multiplied by 2 for contrast enhancement and shited by the mean of their intensity range for visualization purposes (Figure 2).
2.2. Feature Extraction. Several features based on color, texture, and visual context were chosen because they proved to be efective in fundus image analysis. Color information is an intuitive feature, since AMD-related structures are char-acterized by speciic colors. he texture and local gradient information also relect the state of the retina. he image features considered in this study and their parameter settings are presented in the following subsections.
ROI
Figure 2: Preprocessing method: ROI corresponding to the square inscribed in the circle formed by the retina and the result of preprocessing with illumination normalization and contrast enhancement in green channel.
2.2.1. Color Histograms. Blood vessels and lesions ofer the highest contrast in the green channel. hat is why most of the methods proposed in the literature for fundus image analysis focus solely on this channel. Still, even though the red channel is considered as saturated and with low contrast and the blue channel as very noisy in fundus images [31], all three color channels should be considered, especially to discriminate drusen from exudates, which are highly similar lesions but do not characterize the same disease [32]. In this study, the RGB and�∗�∗�∗ spaces were used. In RGB, the red and blue channels provide additional information to the green one. he�∗�∗�∗ space was also chosen because the luminance (lightness) and chrominance (colors) components are independent and color diferences can be measured by a Euclidean distance.
We computed the 8-bin histograms for each channel from both color spaces as image features. he number of bins was set to 8 because there were no improvements in the results with a larger number of bins; thus we considered this suicient for AMD classiication.
2.2.2. Local Binary Patterns (LBP) in Multiresolution. To obtain the multiresolution information, a Lemari´e wavelet transform was used with four levels of decomposition. For each level, an approximation coeicient and three detail coeicients were computed, containing, respectively, the low resolution image (original size divided by two) and the high resolution details in the horizontal, vertical, and diagonal directions. From the original image and the 16 coeicient images, textural information was extracted using LBP. his consisted in measuring the occurrence of local texture prim-itives, such as corners or edges. To do so, the LBP [33] was computed for each pixel of gray value��in a neighborhood of radius� and � neighbors with gray values ��:
LBP�,�= �−1 ∑ �=0� (��− ��) 2 �, With� (�) ={{ { 1, if � ≥ 0, 0, Otherwise. (1) In this study, the parameters were empirically set to� = 1 and� = 8. he magnitude component of the LBP [34] was also computed from the absolute diferences of gray intensity between the central pixel and its neighbors��= |��− ��|:
LBPM�,�= �−1 ∑ �=0� (��, �) 2 �, With� (�, �) ={{ { 1, if � ≥ �, 0, Otherwise. (2)
he threshold� was set to the image mean value.
From the sign and magnitude components of LBP, two histograms were computed by measuring the occurrence of the diferent patterns in the image. For each RGB color channel, LBP were computed and generated a vector of 2006 features.
2.2.3. Histograms of Oriented Gradients (HOG). he his-togram of oriented gradients is a feature generally used for edge detection [35], but it also contains local directional information which can be used for classiication.
he horizontal and vertical gradients were computed by applying a 1D point-centered derivative kernel[−1 0 1] to the color image. hen, local histograms of the four main directions were constructed by dividing the RGB color image into16×16 cells, with 2×2 cells for block normalization. he constructed vector contained 3600 features.
2.2.4. SURF Key Points. Starting from the hypothesis that all AMD manifestations (drusen and other lesions) were
represented in the subset of images presenting AMD, SURF key points were computed on that subset of images, previ-ously converted into�∗�∗�∗. he key points were detected using ten octaves, three layers per octave, and a Hessian threshold of 600. Using the SURF features (sign of Laplacian, orientation, scale of detection, and strength of detected feature), a�-means clustering selected centroids on which the vocabulary was based to construct the features vector. For binary classiications,� was set to 100, while for multiclass classiications, � was set to 300. All parameters used to compute the SURF key points and to construct the vocabulary were set empirically. Once the vocabulary was established, a histogram was constructed by measuring the occurrence of key points depending on the nearest centroid. hese features are implemented as proposed in [28] with unchanged parameters values.
2.3. Dimensionality Reduction and Features Importance. On one hand, a dimensionality reduction is necessary to avoid overitting. Indeed, we have 6018 LBP features (2006 on each channel), 96 color histograms features, 3600 HOG features, and 100 or 300 SURF features. Considering the size of our dataset, a dimensionality reduction step is required before training a classiier. On the other hand, we believe that some of the features used might be more relevant than others in the discrimination between AMD stages. hus, in order to evaluate features relevance and to select optimal subsets of features for classiication, we used two approaches.
2.3.1. Fisher’s Criterion. We determined the feature’s rele-vance using the approach based on the Fisher criterion, which must be maximized [36]. his criterion measures the divergence between two classes� and � based on the estimate of their means� and standard deviations � when they are projected on the feature axis�:
� (�) = (��− ��) 2 �2
� + ��2 .
(3) he maximum number of features for classiier modeling was set to one-tenth the number of training samples [37]. he inal number of features retained was determined based on the best SVM performance obtained by varying the number of features and testing on validation samples.
2.3.2. Features Importance Using Gini Index. We also used the features’ relevance assessment performed in random forest training [38]. We considered the mean decrease in Gini index to measure the features’ relevance. his parameter measures the loss in Gini index on the out-of-bag samples when the feature is removed or permuted. he larger the decrease is, the more relevant the feature is. In this experiment, we used 3000 trees and we set the number of features to be selected at each node to 25 to ensure that all features are considered in the model to evaluate its importance.
2.4. Classiier Modeling. Two diferent classiiers were used in this study to verify if the choice of classiier has a signiicant
impact on the results: a support vector machine (SVM) and a random forest (RF).
2.4.1. Support Vector Machine (SVM). he training of an SVM consists in inding the decision boundary that max-imizes the margin that is the space between the elements nearest to the boundary [39].
In this study, a Gaussian kernel was chosen for the SVM because it is more eicient for systems with complex separations than a linear classiier. In addition, SVMs are useful for systems with a small number of samples because only the elements near the boundary, that is, the support vectors, contribute to the SVM modeling. For classiier modeling, the parameters to be set are�, the parameter of the Gaussian kernel, and�, the number of elements accepted in the margin. hese parameters were set according to a performance assessment using a grid search strategy with 10-fold cross-validation to ind the best pair of values in gamma =[0.001, 0.01, 0.1, 1, 10] and � = [1, 10, 50, 100].
To consider more than two classes, we used the one-against-all approach. In the training phase, one SVM per class is constructed to discriminate the samples of that class from all the others. he label of a new observation is then determined by the SVM classiier that returns the highest value.
2.4.2. Random Forest (RF). he training of an RF consists in constructing decision trees, using randomly selected training samples and features. hen, the classiication of new samples is determined by aggregating the votes of the diferent trees [40]. his method is quite simple to use since only two parameters need to be set: the number of features in the random subset at each tree node and the number of trees in the forest [41]. he irst parameter was set to the square root of the total number of features. he second parameter was set to 1,000 decision trees for binary classiication and 2,500 decision trees for multiclass classiication, such as what is proposed in [28].
3. Experimental Setup
3.1. Materials. he validation was conducted on a database of 279 images, all provided by Diagnos Inc. (Brossard, QC, Canada) using their telemedicine platform. he images were collected from clients in the United Arab Emirates, Mexico, Poland, India, and Canada. he devices used for the acquisitions are diferent models of Zeiss, DRS, Topcon, and Canon retinal cameras. All the images are in JPEG compressed 10 : 1 format and acquired with a 45∘ield-of-view. Depending on the camera used, the size of the images varies between 1,400, 2,200, and 3,240 pixels along the diameter of the retinal images (circular imaged region excluding black background).
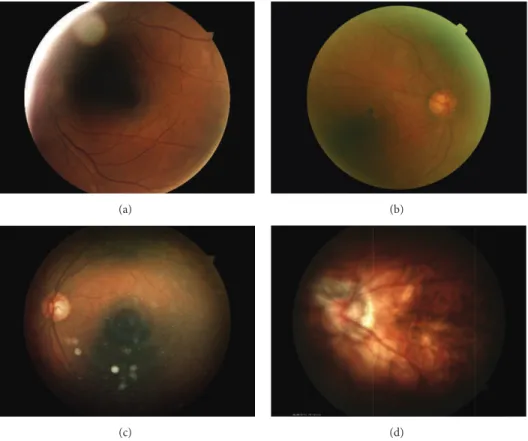
Depending on the acquisition conditions, the images vary in terms of resolution and illumination both of which afect the image quality [42]. Diferent artefacts, illustrated in Fig-ure 3, can be encountered in fundus photography: shadows, intense relections, specular relections, blur, haze, or arcs. In this study, we used an automatic image quality assessment
(a) (b)
(c) (d)
Figure 3: Examples of poor quality images: (a) shadows and intense relections, (b) haze, (c) arc and specular relections, and (d) blur.
Table 1: Number of images in each AREDS category and for each image quality level.
Category {1}
Non-AMD Early{2} Moderate{3} Advanced{4} Good quality 50 43 24 22 Poor quality 29 36 41 34
method described in [43]. he algorithm determined if an image is of good or poor quality based on its measured color distribution and sharpness.
Two human graders were instructed to label the images into one of the four AREDS categories. he irst grader (Grader A) is an ophthalmologist with 10 years of experience working on fundus images. He has expertise in AREDS classiication. he second grader (Grader B) has 2 years of experience working on fundus images and was trained to classify fundus images following the simpliied AMD classi-ication proposed by the AREDS.
he number of images in each AREDS category (as labeled by Grader B) and their distribution according to quality level are shown in Table 1.
3.2. Experiments
3.2.1. Dimensionality Reduction and Features Relevance. To reduce the feature space dimension, we used, on one hand, the feature selection based on Fisher’s criterion and, on the
other hand, the features’ relevance assessment based on mean decrease of Gini index for each classiication task. hen, we counted the number of selected features in each feature category to highlight the most relevant features for AMD classiication.
3.2.2. Performance Assessment for Screening. To assess the performance of our method for AMD screening, we evalu-ated several binary classiication tasks, using a 10-fold cross-validation approach. his consisted in taking one-tenth of the dataset as a testing set, and the rest was used to train the clas-siier. he prediction result from this classiication was kept and the process was repeated for all the elements. Receiver Operating Characteristic (ROC) curves were obtained by varying the threshold on the probabilities given by both classiiers (SVM and RF) and by reporting the sensitivity and speciicity corresponding to this threshold. he corre-sponding areas under the ROC curves (AUC) were then computed. We also tested statistically how the results are signiicantly diferent from a random classiier [44].
3.2.3. Performance Assessment for Grading. In the same way as for screening, the performance for AMD grading was assessed using a 10-fold cross-validation approach for mul-ticlass classiications using SVM and RF. he results were then compared to the intergrader variability. hese results are reported using the confusion matrix, the classiication accuracy (number of elements that are well classiied), and the weighted Kappa coeicient [45].
Table 2: Number of selected features per category.
Classiications Features selection Features categories
LBP red LBP green LBP blue RGB hist. Lab hist. HoG SURF
All None 2006 2006 2006 48 48 3600 100 1 234 Fisher 4 4 0 0 0 0 0 RF Gini 92 114 27 1 1 31 0 12 34 Fisher 2 6 0 0 0 0 0 RF Gini 63 79 18 0 0 17 0 12 3 4 Fisher 0 8 0 0 0 0 0 RF Gini 74 94 23 1 1 23 0 1 23 4 Fisher 0 5 0 0 0 0 0 RF Gini 82 106 25 1 1 29 0 1 2 3 4 Fisher 0 7 0 0 0 0 0 RF Gini 92 114 29 1 1 31 0
3.2.4. Robustness to Image Quality. Selecting good quality images to train a classiication system does not guarantee its eiciency for processing images of variable quality, for exam-ple, in a telemedicine context. To evaluate and to compare the robustness to variations in image quality, an assessment using only good quality images for training and poor quality images for testing was performed. In this experiment, we also performed SVM and RF training and testing using only the SURF features as proposed in [28] for ends of comparison.
Our overall approach for performance assessment aimed at determining the best solution for robust AMD classiica-tion.
4. Results
4.1. Features Relevance. he features relevance was evaluated for screening and grading to highlight the most relevant features for an automatic classiication following the AREDS criteria. Table 2 shows the number of features selected according to Fisher’s criterion and Gini index. For both features selection methods, LBP features are the most selected for any classiication tasks, especially LBP features computed in green channel. hese features are the most relevant for AMD classiication.
It is also to be noted that SURF features are never selected by neither the Fisher based method nor the RF Gini method. It appears that these features are not the most relevant to discriminate between the diferent AMD stages.
4.2. Performance Assessment for Screening. he AMD clas-siication for screening{1} versus {2&3&4} was assessed for both classiiers, with and without a features selection step (see Table 3). he best results were obtained with the features selected based on Gini index, with an AUC of 87.7% for SVM and an AUC of 86.9% for RF. In Figure 4, the speciicity and sensitivity corresponding to mild{3}, moderate {3}, and severe{4} are presented along with the ROC curve. It shows that cases in categories{3} and {4} are better detected as AMD than category{2}.
In light of these results, we decided to assess the clas-siication {1&2} versus {3&4}, since a large proportion of
Table 3: Performance assessment (AUC) for screening.
Classiier SVM RF
Features selection None Fisher Gini None Fisher Gini 1 234 AUC 0.494 0.743∗ 0.877∗ 0.791∗ 0.812∗ 0.869∗ 12 34 AUC 0.491 0.879∗ 0.899∗ 0.867∗ 0.843∗ 0.898∗
∗: statistically diferent from random classiier (0.5 not included in 95% CI of AUC).
Proportion of {2}, {3}, and {4} detected as AMD Proportion of {2} detected as AMD
Proportion of {3} detected as AMD Proportion of {4} detected as AMD 0 0.1 0.2 0.3 0.4 0.5 0.6 0.7 0.8 0.9 1 S ens it iv it y 0.1 0.3 0.4 0.7 0.9 0 0.2 0.5 0.6 0.8 1 1 − specificity
Figure 4: Screening performance for {1} versus {2&3&4} using SVM classiier and features selected using RF Gini.
cases in category {2} were considered as non-AMD. his classiication task corresponds to distinguishing cases that require treatment (moderate and advanced cases) from cases that are not at risk (healthy and mild cases). he performance is better than previously mentioned with an AUC of 89.9% for SVM and an AUC of 89.8% for RF.
4.3. Performance Assessment for Grading. he results of performance assessment for grading are shown in Table 4. For each classiication task, the best results were obtained with the features selected based on Gini index and the SVM classiier. For the automatic classiication according to AREDS protocol ({1} versus {2} versus {3} versus {4}), the method achieved an accuracy of 62.7%. Accuracies of 75.6% and 72.4% were obtained, respectively, for{1&2} versus {3} versus {4} and for {1} versus {2&3} versus {4}. he results demonstrate that the classiication gives better performance when the number of categories to classify is lower.
Table 5 presents the confusion for{1} versus {2} versus {3} versus {4} using features selected by Gini index. Most of the misclassiications happen between categories{1} and {2}. hat explains why the performance was better when we considered {1&2} as one category. We also compared the results with intergrader variability. he latter was assessed on a subset of 176 images annotated by both Graders A and B and measured with weighted Kappa coeicient. he results (see Table 5) showed a weighted Kappa coeicient of 73,6%, which corresponds to a substantial agreement between graders [45]. he automatic method does not reach a performance on the same order as the intergrader variability.
However, we can notice that, even for graders, most dis-agreements happen between classes{1} and {2} and between {2} and {3}.
From these results, we also tested a classiication in two steps. First, we classiied all images into three categories {1&2}, {3}, and {4}, since trinary classiication gives better results. hen, the cases in{1&2} are classiied into {1} and {2}. he results are shown in Table 6 and, indeed, improved with a weighted Kappa of 66.2% for SVM and of 61.0% for RF, which corresponds to a substantial agreement. For the SVM clas-siier, the weighted Kappa is in the 95% conidence interval of the intergrader Kappa which means that there is no sig-niicant diference between the performance of the automatic SVM classiier and Grader B, when compared to Grader A. 4.4. Robustness to Variable Image Quality. he robustness was assessed by measuring the performance of the system when trained with only good quality images and tested on poor quality images. We compared our results with the method proposed in [28] which is based solely on the SURF features as described in Section 2.2.4. Table 7 shows the robustness assessment for AMD screening. he resulting AUCs are in the same range as in the 10-fold cross-validation on the whole dataset (Table 4). Table 8 shows the robustness assessment for AMD grading. Here, the classiication accuracy decreases compared to the assessment by 10-fold cross-validation on the whole dataset (Table 5), yielding accuracies of 0.207–0.557 with SVM and 0.393–0.693 with RF.
he experiments revealed that the best results for AMD screening and grading were obtained with LBP in multires-olution applied to the green channel. hese features were considered as the most relevant for AMD classiication and were favored by the Fisher criterion and Gini index. he present work conirms that these features are robust with respect to image quality, as suggested in our prior studies [29, 30], and extends those results from AMD detection to AMD severity classiication. Even with small learning samples, the systems using SVM classiier and features selected by Gini index achieved AUCs between 0.877 and 0.899 for AMD screening, which is especially good considering the large proportion of poor quality images (50.2% of the database). Our best result for AMD grading was an accuracy of 75.6% for the trinary classiication task{1&2} versus {3} versus {4}. he automatic grading following AREDS protocol was in the same order as intergrader variability while using SVM and features selected based on Gini index.
LBP is a powerful tool for characterizing the texture and that is why these features are the most suitable for this application. First, a local characterization of the texture is more efective than a global feature such as color histograms. hen, LBP measures the proportions of the diferent uniform patterns contained in the image (such as edges, borders, or points), which seem to be more informative than the local gradients computed in HOG or the SURF key point features. In fact, these latter features seem to be less robust to poor quality images, since they are based on detecting local maxima which can be sensitive to noise. hus, LBP are the most reliable features taking into account the types of structures characterizing AMD images at diferent severity degrees. Finally, the multiresolution approach helps us to characterize the stage of the disease by identifying lesions at diferent scales. Indeed, a lesion detected at high resolution could correspond to large drusen or an atrophy, both being related to more advanced AMD stages.
We have proposed a method that is adapted to a real telemedicine context. his means that we processed images from variable quality levels, coming from diferent locations and diferent cameras, whereas major studies on AMD in the literature have used homogeneous datasets. Furthermore, our results compare well against those of other methods. For AMD screening, a study carried out in [24] aimed to evaluate if cases were at low or high risk to progress to an advanced stage, based on drusen segmentation. heir system achieved a Kappa coeicient of 0.760–0.765. his is similar to our classiication performance for {1&2} versus {3&4}, which obtained AUCs of 0.899. Nevertheless, it is diicult to compare these diferent methods one on one since there is no publicly available database for AMD grad-ing containgrad-ing fundus images labeled accordgrad-ing to AREDS protocol.
Table 5: Confusion matrix in percentage for grading ({1} versus {2} versus {3} versus {4}).
% SVM (Gini) RF (Gini) Grader B
Nb img 279 279 176 Grader A 1 2 3 4 1 2 3 4 1 2 3 4 1 20.1 6.8 1.1 0.4 19.7 6.5 1.4 0.7 31.2 9.5 0.6 0.0 2 6.5 15.8 4.7 1.4 7.2 16.5 2.9 1.8 4.5 19.3 6.2 0.6 3 1.4 4.7 13.3 3.9 2.2 5.7 13.3 2.1 0.0 3.4 7.4 2.8 4 0.7 0.7 5.0 13.6 0.7 2.2 5.0 12.2 0.0 1.1 1.1 13.1 Accuracy 62.7 61.6 71.5 Weighted� (95% CI) 63.7 (57.3–70.2) 59.4 (52.3–66.5) 73.6 (66.1–80.2)
Substantial Moderate Substantial
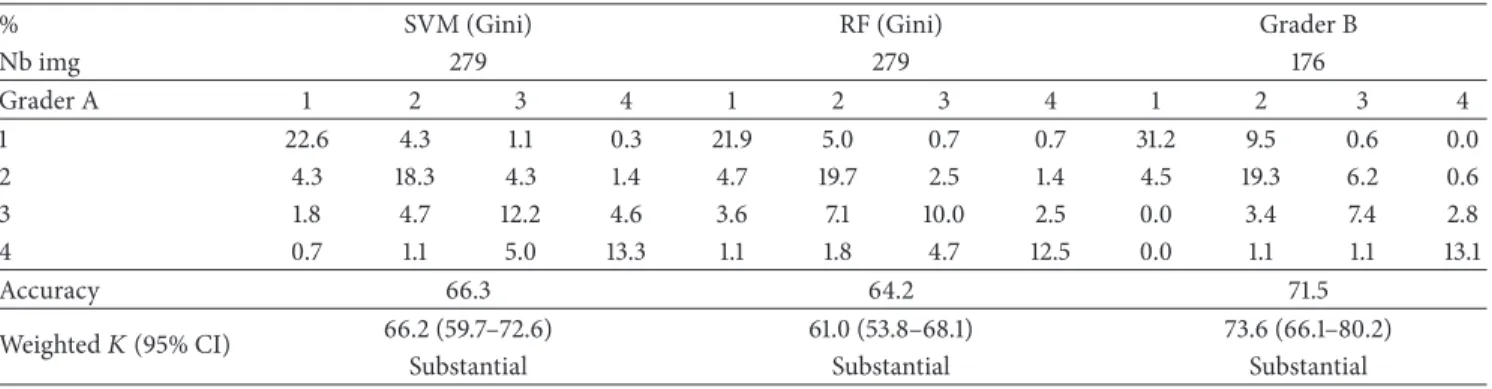
Table 6: Confusion matrix in percentage for grading in two steps ({1&2} versus {3} versus {4} and then {1} versus {2}).
% SVM (Gini) RF (Gini) Grader B
Nb img 279 279 176 Grader A 1 2 3 4 1 2 3 4 1 2 3 4 1 22.6 4.3 1.1 0.3 21.9 5.0 0.7 0.7 31.2 9.5 0.6 0.0 2 4.3 18.3 4.3 1.4 4.7 19.7 2.5 1.4 4.5 19.3 6.2 0.6 3 1.8 4.7 12.2 4.6 3.6 7.1 10.0 2.5 0.0 3.4 7.4 2.8 4 0.7 1.1 5.0 13.3 1.1 1.8 4.7 12.5 0.0 1.1 1.1 13.1 Accuracy 66.3 64.2 71.5 Weighted� (95% CI) 66.2 (59.7–72.6) 61.0 (53.8–68.1) 73.6 (66.1–80.2) Substantial Substantial Substantial
Table 7: Quality robustness assessment (AUC) for screening.
Classiier SVM RF
Features selection None SURF [28] Fisher RF Gini None SURF [28] Fisher RF Gini 1 234 AUC 0.500 0.500 0.588 0.874∗ 0.797∗ 0.436 0.807∗ 0.889∗ 12 34 AUC 0.500 0.530 0.882∗ 0.812∗ 0.819∗ 0.472 0.875∗ 0.816∗
∗: statistically diferent from random classiier (0.5 not included in 95% CI of AUC).
Table 8: Quality robustness assessment (accuracy) for grading.
Classiier SVM RF
Features selection None SURF [28] Fisher RF Gini None SURF [28] Fisher RF Gini 12 3 4 Acc. 0.466 0.464 0.529 0.557 0.607 0.493 0.571 0.586 1 23 4 Acc. 0.550 0.550 0.550 0.550 0.643 0.329 0.557 0.693 1 2 3 4 Acc. 0.207 0.300 0.450 0.507 0.486 0.350 0.393 0.521
For AMD grading, the method proposed in [28] reports an accuracy of 91.5% for classifying{1&2} versus {3} versus {4} on selected images of good quality. Our method achieved an accuracy of 75.6%, which is signiicantly lower; however all images were processed including images of poor quality. To support that furthermore, the experiment on robustness to image quality clearly demonstrates that AMD screening and grading using SURF features as proposed in [28] is not applicable in a telemedicine setting where image quality is not always guaranteed.
Our method demonstrates considerable robustness with respect to image quality. In a telemedicine context, where
acquisition conditions are not strictly controlled, to only select good quality images is not adequate for AMD evalu-ation because we want a maximum of cases to be handled. To demonstrate the robustness to image quality, we assessed the classiication systems performance by training them on good quality images and testing them on poor quality ones. Our system still performed well, presenting results of the same order as the ones obtained in the leave-one-out cross-validation.
In regard to the classiication tasks, it is recommended to use the classiication{1&2} versus {3&4} for AMD screening, which presented a better result using our method. he clinical
Our database contained a relatively small number of samples in each category. his may be the reason why a good performance for grading could not be demonstrated in this study. Moreover, even the human graders had some diiculty agreeing on the database’s labeling, with an intergrader weighted Kappa of 0.736. A validation on a larger database could improve the grading results.
Future work will focus on the preprocessing step. In fact, in this study, we used a preprocessing procedure intro-duced in [28] for ends of comparison. Nevertheless, several improvements could be made to it. he background illumina-tion was estimated with a median ilter, but the convoluillumina-tion with a high resolution image has a large computational cost. his aspect could be improved by using spectral iltering instead. Also, our previous work demonstrated that a local analysis focused on the macular area can improve the system performance. Indeed, features of AMD are mainly located in this area. his idea could be further explored by using an automatic detection of the macular region based on the detection of the fovea and the radius of the optic disc.
6. Conclusion
We have developed and validated an automatic clinical classi-ication system for AMD screening and grading in a telemed-icine context. he validation of our method reveals promising results in terms of robustness to image quality and accuracy for diferent AMD severity classiication tasks. Our experi-mental results highlight the discriminating strength of LBP features over other tested features, whether the classiier is an RF or an SVM. Further validation must be conducted on a database containing more samples in each category in order to conirm these results. Nevertheless, the proposed approach represents an important step toward providing a reliable AMD diagnostic tool for patient monitoring and for clinical trials. Early AMD detection can facilitate timely access to treat-ment and consequently improve the therapeutic outcome.
Competing Interests
he authors declare that they have no competing interests.
Acknowledgments
he authors would like to acknowledge the contribution of Philippe Debann´e for revising this paper. his work was funded by Diagnos Inc. and Natural Sciences and Engineer-ing Research Council of Canada.
References
[1] D. T. Kasuga, Y. Chen, and K. Zhang, “Genetics of age-related degeneration,” in Age-Related Macular Degeneration Diagnosis and Treatment, pp. 1–14, Springer, Philadelphia, Pa, USA, 2011.
Ho and C. D. Regillo, Eds., pp. 65–78, Springer, New York, NY, USA, 2011.
[4] F. M. Penha and P. J. Rosenfeld, “Management of neovascular AMD,” in Age-Related Macular Degeneration Diagnosis and Treatment, A. C. Ho and C. D. Regillo, Eds., pp. 79–98, Springer, New York, NY, USA, 2011.
[5] C. M. Oliveira, L. M. Crist´ov˜ao, M. L. Ribeiro, and J. R. Faria Abreu, “Improved automated screening of diabetic retinopathy,” Ophthalmologica, vol. 226, no. 4, pp. 191–197, 2011.
[6] L. Seoud, T. Hurtut, J. Chelbi, F. Cheriet, and J. M. Langlois, “Red lesion detection using dynamic shape features for diabetic retinopathy screening,” IEEE Transactions on Medical Imaging, vol. 35, no. 4, pp. 1116–1126, 2016.
[7] Y. Kanagasingam, A. Bhuiyan, M. D. Abr`amof, R. T. Smith, L. Goldschmidt, and T. Y. Wong, “Progress on retinal image anal-ysis for age related macular degeneration,” Progress in Retinal and Eye Research, vol. 38, pp. 20–42, 2014.
[8] S. S. Parvathi and N. Devi, “Automatic drusen detection from colour retinal images,” in Proceedings of the International Con-ference on Computational Intelligence and Multimedia Applica-tions, pp. 377–381, IEEE, Sivakasi, India, December 2007. [9] L. Brandon and A. Hoover, “Drusen detection in a retinal
image using multi-level analysis,” in Medical Image Computing and Computer-Assisted Intervention—MICCAI, pp. 618–625, Springer, Berlin, Germany, 2003.
[10] R. Priya and P. Aruna, “Automated diagnosis of Age-related macular degeneration from color retinal fundus images,” in Pro-ceedings of the 3rd International Conference on Electronics Com-puter Technology (ICECT ’11), pp. 227–230, Kanyakumari, India, April 2011.
[11] E. S. Barriga, V. Murray, C. Agurto et al., “Multi-scale AM-FM for lesion phenotyping on age-related macular degeneration,” in Proceedings of the 22nd IEEE International Symposium on Computer-Based Medical Systems (CBMS ’09), Albuquerque, NM, USA, August 2009.
[12] C. Agurto, E. Barriga, V. Murray et al., “Automatic detection of diabetic retinopathy and age-related macular degeneration in digital fundus images,” Retina, vol. 52, no. 8, pp. 5862–5871, 2011. [13] C. K¨ose, U. S¸evik, O. Genc¸alio˘glu, C. ˙Ikibas¸, and T. Kayıkıc¸ıo˘glu, “A statistical segmentation method for measuring age-related macular degeneration in retinal fundus images,” Journal of Medical Systems, vol. 34, no. 1, pp. 1–13, 2010.
[14] A. R. Prasath and M. M. Ramya, “Detection of macular drusen based on texture descriptors,” Research Journal of Information Technology, vol. 7, no. 1, pp. 70–79, 2015.
[15] W. H. Morgan, R. L. Cooper, I. J. Constable, and R. H. Eikel-boom, “Automated extraction and quantiication of macular drusen from fundal photographs,” Australian and New Zealand Journal of Ophthalmology, vol. 22, no. 1, pp. 7–12, 1994. [16] R. T. Smith, J. K. Chan, T. Nagasaki et al., “Automated detection
of macular drusen using geometric background leveling and threshold selection,” Archives of Ophthalmology, vol. 123, no. 2, pp. 200–206, 2005.
[17] P. Soliz, M. P. Wilson, S. C. Nemeth, and P. Nguyen, “Computer-aided methods for quantitative assessment of longitudinal changes in retinal images presenting with maculopathy,” in Proceedings of the SPIE 4681 Medical Imaging, International Society for Optics and Photonics, pp. 159–170, 2002.
[18] K. Rapantzikos, M. Zervakis, and K. Balas, “Detection and seg-mentation of drusen deposits on human retina: potential in the diagnosis of age-related macular degeneration,” Medical Image Analysis, vol. 7, no. 1, pp. 95–108, 2003.
[19] Z. Liang, D. W. K. Wong, J. Liu, K. L. Chan, and T. Y. Wong, “Towards automatic detection of age-related macular degener-ation in retinal fundus images,” in Proceedings of the Annual International Conference of the IEEE Engineering in Medicine and Biology Society (EMBC ’10), pp. 4100–4103, IEEE, Buenos Aires, Argentina, September 2010.
[20] G. Quellec, S. R. Russell, and M. D. Abramof, “Optimal ilter framework for automated, instantaneous detection of lesions in retinal images,” IEEE Transactions on Medical Imaging, vol. 30, no. 2, pp. 523–533, 2011.
[21] M. Hanai, A. Hijazi, F. Coenen, and Y. Zheng, “Retinal image classiication for the screening of age-related macular degener-ation,” in Proceedings of the SGAI International Conference on Artiicial Intelligence, Cambridge, UK, December 2010. [22] A. D. Mora, P. M. Vieira, A. Manivannan, and J. M. Fonseca,
“Automated drusen detection in retinal images using analytical modelling algorithms,” BioMedical Engineering Online, vol. 10, article 59, pp. 1–15, 2011.
[23] B. Remeseiro, N. Barreira, D. Calvo, M. Ortega, and M. G. Penedo, “Automatic drusen detection from digital retinal images: AMD prevention,” in Computed Aided Systems heory-EUROCAST, pp. 187–194, Springer, Berlin, Germany, 2009. [24] M. J. J. P. Van Grinsven, Y. T. E. Lechanteur, J. P. H. Van De
Ven, B. Van Ginneken, T. heelen, and C. I. S´anchez, “Automatic age-related macular degeneration detection and staging,” in Proceedings of the SPIE Medical Imaging 2013: Computer-Aided Diagnosis, Orlando, Fla, USA, February 2013.
[25] M. U. Akram, S. Mujtaba, and A. Tariq, “Automated drusen seg-mentation in fundus images for diagnosing age related macular degeneration,” in Proceedings of the 10th International Confer-ence on Electronics, Computer and Computation (ICECCO ’13), pp. 17–20, Ankara, Turkey, November 2013.
[26] V. Sundaresan, K. Ram, K. Selvaraj, N. Joshi, and M. Sivaprak-asam, “Adaptative super-candidate based approach for detec-tion and classiicadetec-tion of drusen retinal fundus images,” in Pro-ceedings of the Ophthalmic Medical Image Analysis Second Inter-nation Workshop (OMIA ’15), pp. 81–88, Munich, Germany, 2015.
[27] A. K. Feeny, M. Tadarati, D. E. Freund, N. M. Bressler, and P. Burlina, “Automated segmentation of geographic atrophy of the retinal epithelium via random forests in AREDS color fundus images,” Computers in Biology and Medicine, vol. 65, pp. 124– 136, 2015.
[28] S. Kankanahalli, P. M. Burlina, Y. Wolfson, D. E. Freund, and N. M. Bressler, “Automated classiication of severity of age-related macular degeneration from fundus photographs,” Investigative Ophthalmology & Visual Science, vol. 54, no. 3, pp. 1789–1796, 2013.
[29] M. Garnier, T. Hurtut, H. B. Tahar, and F. Cheriet, “Automatic multiresolution age-related macular degeneration detection from fundus images,” in Medical Imaging: Computer-Aided Diagnosis, vol. 9035 of Proceedings of SPIE, 2014.
[30] T. V. Phan, L. Seoud, and F. Cheriet, “Towards an automatic clas-siication of age-related macular degeneration,” in Proceedings of the International Conference on Image Analysis and Recognition, Niagara Falls, NY, USA, July 2015.
[31] T. Walter, P. Massin, A. Erginay, R. Ordonez, C. Jeulin, and J.-C. Klein, “Automatic detection of microaneurysms in color fundus images,” Medical Image Analysis, vol. 11, no. 6, pp. 555–566, 2007. [32] M. J. J. P. van Grinsven, A. Chakravarty, J. Sivaswamy, T. hee-len, B. van Ginneken, and C. I. Sanchez, “A Bag of Words approach for discriminating between retinal images containing exudates or drusen,” in Proceedings of the IEEE 10th Interna-tional Symposium on Biomedical Imaging (ISBI ’13), pp. 1444– 1447, San Francisco, Calif, USA, April 2013.
[33] T. Ojala, M. Pietik¨ainen, and T. M¨aenp¨a¨a, “Multiresolution gray-scale and rotation invariant texture classiication with local binary patterns,” IEEE Transactions on Pattern Analysis and Machine Intelligence, vol. 24, no. 7, pp. 971–987, 2002.
[34] Z. Guo, L. Zhang, and D. Zhang, “A completed modeling of local binary pattern operator for texture classiication,” IEEE Transactions on Image Processing, vol. 19, no. 6, pp. 1657–1663, 2010.
[35] N. Dalal and B. Triggs, “Histograms of oriented gradients for human detection,” in Proceedings of the IEEE Computer Society Conference on Computer Vision and Pattern Recognition (CVPR ’05), pp. 886–893, IEEE, San Diego, Calif, USA, June 2005. [36] R. O. Duda, P. E. Hart, and D. G. Stork, “Maximum-likelihood
and Bayesian parameters estimation,” in Pattern Classiication, pp. 84–159, Wiley-Interscience, New York, NY, USA, 2nd edi-tion, 2009.
[37] A. R. Webb, Statistical Pattern Recognition, John Wiley & Sons, 2003.
[38] L. Breiman, Manual on Setting Up, Using and Understanding Random Forests V3.1, University of California, Berkeley, Calif, USA, 2002.
[39] I. Steinwart and A. Christmann, Support Vector Machines, Springer, 2008.
[40] L. Breiman, “Random forests,” Machine Learning, vol. 45, no. 1, pp. 5–32, 2001.
[41] A. Liaw and M. Wiener, “Classiication and regression by ran-dom forest,” R News, vol. 2, no. 3, pp. 18–22, 2002.
[42] H. Bartling, P. Wanger, and L. Martin, “Automated quality eval-uation of digital fundus photographs,” Acta Ophthalmologica, vol. 87, no. 6, pp. 643–647, 2009.
[43] M. Fasih, J. M. P. Langlois, H. B. Tahar, and F. Cheriet, “Retinal image quality assessment using generic features,” in Proceedings of the SPIE 9035 Medical Imaging 2014: Computer-Aided Diag-nosis, San Diego, Calif, USA, February 2014.
[44] E. R. DeLong, D. M. DeLong, and D. L. Clarke-Pearson, “Com-paring the areas under two or more correlated receiver operat-ing characteristic curves: a nonparametric approach,” Biomet-rics, vol. 44, no. 3, pp. 837–845, 1988.
[45] A. J. Viera and J. M. Garrett, “Understanding interobserver agreement: the kappa statistic,” Family Medicine, vol. 37, no. 5, pp. 360–363, 2005.
Submit your manuscripts at
http://www.hindawi.com
Stem Cells
International
Hindawi Publishing Corporation
http://www.hindawi.com Volume 2014
Hindawi Publishing Corporation
http://www.hindawi.com Volume 2014
Behavioural
Neurology
Endocrinology
International Journal of Hindawi Publishing Corporationhttp://www.hindawi.com Volume 2014
Hindawi Publishing Corporation
http://www.hindawi.com Volume 2014
BioMed
Research International
Oncology
Journal ofHindawi Publishing Corporation
http://www.hindawi.com Volume 2014
Hindawi Publishing Corporation
http://www.hindawi.com Volume 2014
Oxidative Medicine and Cellular Longevity
Hindawi Publishing Corporation
http://www.hindawi.com Volume 2014
PPAR Research
Immunology Research
Hindawi Publishing Corporation
http://www.hindawi.com Volume 2014 Journal of
Obesity
Journal ofHindawi Publishing Corporation
http://www.hindawi.com Volume 2014
Hindawi Publishing Corporation
http://www.hindawi.com Volume 2014
Computational and Mathematical Methods in Medicine
Ophthalmology
Journal ofHindawi Publishing Corporation
http://www.hindawi.com Volume 2014
Hindawi Publishing Corporation
http://www.hindawi.com Volume 2014 Research and Treatment
AIDS
Hindawi Publishing Corporation
http://www.hindawi.com Volume 2014