Publisher’s version / Version de l'éditeur:
BMC Public Health, 11, Supplement 1:S2, 2011-02-25
READ THESE TERMS AND CONDITIONS CAREFULLY BEFORE USING THIS WEBSITE. https://nrc-publications.canada.ca/eng/copyright
Vous avez des questions? Nous pouvons vous aider. Pour communiquer directement avec un auteur, consultez la première page de la revue dans laquelle son article a été publié afin de trouver ses coordonnées. Si vous n’arrivez pas à les repérer, communiquez avec nous à [email protected].
Questions? Contact the NRC Publications Archive team at
[email protected]. If you wish to email the authors directly, please see the first page of the publication for their contact information.
NRC Publications Archive
Archives des publications du CNRC
This publication could be one of several versions: author’s original, accepted manuscript or the publisher’s version. / La version de cette publication peut être l’une des suivantes : la version prépublication de l’auteur, la version acceptée du manuscrit ou la version de l’éditeur.
For the publisher’s version, please access the DOI link below./ Pour consulter la version de l’éditeur, utilisez le lien DOI ci-dessous.
https://doi.org/10.1186/1471-2458-11-S1-S2
Access and use of this website and the material on it are subject to the Terms and Conditions set forth at
Public health interventions for epidemics : implications for multiple
infection waves
Wessel, Lindsay; Hua, Yi; Wu, Jianhong; Moghadas, Seyed M.
https://publications-cnrc.canada.ca/fra/droits
L’accès à ce site Web et l’utilisation de son contenu sont assujettis aux conditions présentées dans le site LISEZ CES CONDITIONS ATTENTIVEMENT AVANT D’UTILISER CE SITE WEB.
NRC Publications Record / Notice d'Archives des publications de CNRC:
https://nrc-publications.canada.ca/eng/view/object/?id=f8020f76-e555-476e-be1b-b9e30eb0f533 https://publications-cnrc.canada.ca/fra/voir/objet/?id=f8020f76-e555-476e-be1b-b9e30eb0f533R E S E A R C H
Open Access
Public health interventions for epidemics:
implications for multiple infection waves
Lindsay Wessel
1, Yi Hua
1, Jianhong Wu
2, Seyed M Moghadas
1,3*Abstract
Background: Epidemics with multiple infection waves have been documented for some human diseases, most notably during past influenza pandemics. While pathogen evolution, co-infection, and behavioural changes have been proposed as possible mechanisms for the occurrence of subsequent outbreaks, the effect of public health interventions remains undetermined.
Methods: We develop mean-field and stochastic epidemiological models for disease transmission, and perform simulations to show how control measures, such as drug treatment and isolation of ill individuals, can influence the epidemic profile and generate sequences of infection waves with different characteristics.
Results: We demonstrate the impact of parameters representing the effectiveness and adverse consequences of intervention measures, such as treatment and emergence of drug resistance, on the spread of a pathogen in the population. If pathogen resistant strains evolve under drug pressure, multiple outbreaks are possible with variability in their characteristics, magnitude, and timing. In this context, the level of drug use and isolation capacity play an important role in the occurrence of subsequent outbreaks. Our simulations for influenza infection as a case study indicate that the intensive use of these interventions during the early stages of the epidemic could delay the spread of disease, but it may also result in later infection waves with possibly larger magnitudes.
Conclusions: The findings highlight the importance of intervention parameters in the process of public health decision-making, and in evaluating control measures when facing substantial uncertainty regarding the
epidemiological characteristics of an emerging infectious pathogen. Critical factors that influence population health including evolutionary responses of the pathogen under the pressure of different intervention measures during an epidemic should be considered for the design of effective strategies that address short-term targets compatible with long-term disease outcomes.
Background
Epidemics of infectious diseases have been observed throughout history, with substantial variability in their dynamical patterns. The 1918 influenza pandemic is a notorious case documented as the most devastating epi-demic with over 50 million deaths and multiple out-breaks in many geographic areas worldwide [1,2]. Distinct pandemic infection waves were recorded with an 8 to 15 week interval; the latter were more severe than the first and were associated with the majority of deaths [2,3]. Although several factors may be involved, such as the effect of seasonal changes, demographics,
and evolution of the virus, the true mechanism by which subsequent waves occur is not fully understood. Nor is it clearly understood how different control mea-sures and strategies for deployment of limited health resources may interfere with disease dynamics and the occurrence of later infection waves.
Recent epidemiological and modelling studies have attempted to provide explanatory theories for the mechanisms of multiple outbreaks of an infectious pathogen capable of establishing an epidemic [2,4-10]. Spontaneous behavioural changes (e.g., a change in the number of contacts due to modified behaviour of sus-ceptible individuals) have been shown to affect the course of infection events and produce subsequent out-breaks in an epidemic episode [9]. This has been further investigated through modelling “concerned awareness”
* Correspondence: [email protected]
1
Institute for Biodiagnostics, National Research Council Canada, Winnipeg, Manitoba, R3B 1Y6, Canada
Full list of author information is available at the end of the article
© 2011 Wessel et al; licensee BioMed Central Ltd. This is an open access article distributed under the terms of the Creative Commons Attribution License (http://creativecommons.org/licenses/by/2.0), which permits unrestricted use, distribution, and reproduction in any medium, provided the original work is properly cited.
of individuals that may result in contagion dynamics of fear and disease [6], and the implementation of public health control measures (e.g., social distancing) that may interfere with the individuals’ contact patterns during the epidemic [5]. Co-infection has also been suggested as a possible explanation for multiple infection out-breaks as a result of increased transmissibility in co-infected individuals and non-synchronicity in the time course of the two co-circulating infections [8]. Other possible mechanisms include transient post-infection immunity and evolutionary changes that may occur in the characteristics of the infectious pathogens [2,4,10].
In this study, we consider the occurrence of multiple infection waves of a pathogen from a public health per-spective, and develop mathematical models to investi-gate how intervention measures may affect the transmission dynamics in a population. Specifically, we are interested in exploring the impact of changes in pol-icy-relevant parameters on the patterns of disease spread during the course of an epidemic. These parameters may reflect the effectiveness of intervention strategies (e.g., treatment or isolation of infected cases) in redu-cing disease transmission, or their epidemiological con-sequences (e.g., emergence of drug resistance), and may therefore play an important role in determining the out-come of disease control activities. The significance of this work thus relates to the process of public health decision-making, in particular when confronting the emergence of a novel infectious disease with substantial uncertainty regarding the epidemiological characteristics of the invading pathogen.
For the purpose of this investigation, we develop both mean-field and stochastic epidemiological models that describe the transmission dynamics of a disease in the population, and incorporate treatment and isolation of infected cases as control measures. We parameterize these models to simulate the spread of influenza as a case study, and determine the impact of control para-meters on disease dynamics. We illustrate the occur-rence of multiple infection waves associated with different treatment levels and the development of drug resistance in the population under the scenario of lim-ited capacity for treatment and isolation of infectious individuals. We compare the results obtained by simu-lating the mean-field model with those observed in the stochastic model, and discuss our findings in the context of epidemiology and public health.
Methods
The model structure
To formulate the models for describing disease epidemic, we assume that the population is initially entirely suscep-tible to the infectious pathogen. It is assumed that the infection can be treated with drugs, but the pathogen
may develop resistance during the course of treatment with potential for transmission. Since resistance emer-gence may impose fitness cost on pathogen replication and transmission [11], we assume that the drug-resistant pathogen is less transmissible than the drug-sensitive pathogen. Treatment is assumed to reduce transmissibil-ity of the drug-sensitive infection, but remains ineffective against drug-resistant infection. We also assume that the recovery from infection confers immunity to re-infection with either drug-sensitive or resistant pathogens. Consid-ering epidemics with relatively short time-courses, we ignore the effect of recruitment, natural death, and other demographic variables of the population.
With the assumption of homogeneous mixing, we divide the population into classes of susceptibles (S); individuals exposed (not yet infectious) to sensitive (E) and resistant (Er) infections; untreated individuals
infected with sensitive (I) and resistant (Ir) infections;
treated individuals infected with sensitive (IT) and
resis-tant (IT,r) infections; isolated individuals infected with
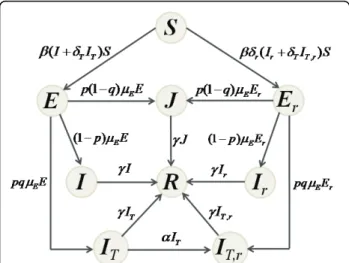
either sensitive or resistant infection (J); and recovered individuals (R). Figure 1 shows the movements of indivi-duals between these classes during the course of an epi-demic. With parameters described in Table 1, the dynamics of the mean-field model can be mathemati-cally expressed by the following system of differential equations: ′ = − + + + ′ = + − ′ = + S I I I I S E I I S E E I I T T r r T r T T E r r r T ( ( ) ) , ( ) , ( , ,,) , ( ) , ( ) , ( r E r E r E r r T E S E I p E I I p E I I pq E − ′ = − − ′ = − − ′ = − + 1 1 )) , , ( ) ( ) , ( , , I I pq E I I J p q E E J R I I T T r E r T T r E r T ′ = + + ′ = − + − ′ = + 1 ++Ir+IT r, +J) . (1)
Details of the model in its stochastic form are pro-vided in the Appendix.
Reproduction numbers
A key parameter in disease epidemiology is the basic repro-duction number of the invading pathogen, commonly denoted by R0, which is the average number of new
infec-tions generated by a single infected case introduced into an entirely susceptible (non-immune) population [12]. The quantity R0can be used to estimate the growth rate of an
epidemic (during the initial phase) and the total number of infections (final size of the epidemic) [13]. When public health interventions are implemented, the reproduction
Wessel et al. BMC Public Health 2011, 11(Suppl 1):S2 http://www.biomedcentral.com/1471-2458/11/S1/S2
number of disease is affected by parameters that determine the effectiveness of control measures; and we therefore introduce the control reproduction number ( Rc) to
evalu-ate the impact of such parameters on transmissibility of the pathogen and epidemic dynamics. Applying a previously established method [12,14], for model (1), we obtain
Rc Rc R s c r =max{ , } , where Rc s and Rc r are respectively
the reproduction numbers of the sensitive and resistant infections, expressed by R S p pq R S p q c s T c r r = − + + ⎛ ⎝ ⎜ ⎞ ⎠ ⎟ = ⎛ − − ⎝ ⎜ ⎞ ⎠ ⎟ 0 0 1 1 1 , ( ) , (2)
where S0is the size of the susceptible population at the
onset of the outbreak. In the absence of treatment and isolation, Rcreduces to the basic reproduction number of
the sensitive pathogen, given by R0= bS0/g. Using the
expression for Rcs in (2), one can easily calculate the cri-tical value p*at which
Rcs =1, and therefore the spread
of the sensitive infection can be contained for p >p*. Rewriting Rcs in terms of R0, the value p*is given by
p R R Tq ∗= − − + ⎛ ⎝ ⎜ ⎞ ⎠ ⎟ 0 0 1 1 .
However, the spread of disease caused by the sensitive pathogen cannot be controlled if R0 exceeds the
thresh-old R*= (g + a)/δTqg, which results in p*> 1. Since 0 ≤
q ≤ 1, for parameter values used in simulations (Table 1), disease control becomes infeasible if R0 > 2.5.
Simi-larly, there is a critical value pr
* at which
Rc r =
1, and the spread of the resistant pathogen is contained if
p>pr *. Letting R0r = rR0, the value of pr * can be expressed as p R R q r r r * ( ) , = − − 0 0 1 1
which highlights the importance of isolation for con-trolling the spread of resistant infection.
Simulations and results
To simulate the models, we considered influenza infec-tion as a case study, for which emergence and spread of drug-resistance during an outbreak can result from treatment of infected individuals. We assumed that the epidemic is triggered by a drug-sensitive influenza virus, and investigated the role of several key model para-meters in changing the epidemic patterns and generat-ing multiple waves of infection. These parameters include the fractions of infected individuals identified for treatment or isolation, and the basic reproduction number of disease which varies within the estimated range published in the literature (Table 1). Since public health resources may be limited during an epidemic, we
Figure 1 The model. Model diagram for the movements of individuals between population compartments.
Table 1 Parameter values
Parameter Description Value Source
b Baseline transmission rate of the sensitive infection variable
1/µE Expose period (duration between exposure and start of infectiousness) 1.25 days [4,15-18]
1/g Duration of infectiousness 4 days [4,15,16,18,19]
a Rate of developing drug resistance following start of treatment 10-4days-1 [16,18] δT Relative transmissibility of the sensitive infection following treatment 0.4 [15,16,18,20] δr Relative transmissibility of the resistant infection 0.8 [15,16,18] p Fraction of infectious individuals diagnosed for treatment or isolation variable
q Fraction of treated infectious individuals without isolation variable Tc Capacity for treatment and isolation of infectious individuals variable
R0 Basic reproduction number of the sensitive infection variable [3,19,20]
Baseline values of the parameters used for simulations of the models with sources from published literature. For a given value of R0, the baseline transmission rateb can be calculated using the expression R0=bS0/g.
also defined a parameter (Tc) as the capacity for
treat-ment of infected individuals including those who are isolated (i.e., the percentage of the total population that can be treated). To illustrate various scenarios, we initi-ally seeded a susceptible population of size S0 = 10,000
with E0 = 10 individuals exposed to the sensitive virus,
and assumed that treatment can result in the emergence of resistance with the relative transmissibility δr = 0.8
during the outbreak. Other parameter values are given in Table 1.
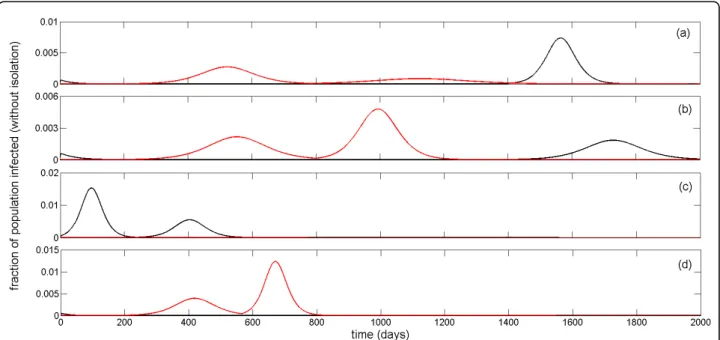
The mean-field model was simulated for a number of scenarios to show the occurrence of multiple infection waves during an epidemic episode (Figure 2). These simulations indicate that variation in the transmissibility of the pathogen (determined by R0 ), as well as
para-meters that govern the effectiveness of control measures can significantly impact the epidemic profile, leading to sequences of infection waves with different magnitudes and time-courses. To explore the causes of these multi-ple outbreaks, we plotted time-courses of treated and untreated sensitive (black curves) and resistant infec-tions (red curves), corresponding to epidemic profiles in Figures 2a-2d. As illustrated in Figures 2a-2b, a large scale use of treatment (combined with isolation) sup-presses the spread of the sensitive infection quickly, but leads to the emergence and spread of resistance that causes the first wave of infection. Due to the limited capacity of treatment and isolation (run-out scenario), a second wave of infection follows as a result of
wide-spread resistance (red curves), which declines once a siz-able portion of the susceptible population is infected and the level of susceptibility reduces below a threshold that is sufficient to block the transmission of the resis-tant pathogen with reduced fitness. However, this level of susceptibility may still be above the threshold required for disease containment, and therefore the sen-sitive pathogen can cause the third wave of infection (black curves).
As the reproduction number of the sensitive infection increases (Figures 2c-2d), higher treatment levels are required for the resistant infection to prevail and cause a significant outbreak [18]. For a reduced level of treat-ment and a higher transmissibility of the sensitive virus, corresponding to the epidemic profile in Figure 2c, we observed two infection waves, both of which are caused by the spread of the sensitive virus, with generation of very few cases of resistant infection. In this scenario, run-out occurs before epidemic is contained, and a sec-ond infection wave takes place. Similar dynamics can occur with two subsequent waves of resistant infections for a significantly higher treatment level (Figure 2d). However, the second wave that occurs after the treat-ment capacity is fully dispensed (run-out scenario) leads to a major reduction in susceptibility of the population; thereby ending the epidemic. These simulations indicate that multiple infection waves could occur due to limited resources for treatment/isolation of infected cases, the ways that such resources are deployed during the
Figure 2 Multiple infection waves during an epidemic episode. Simulations for the time-courses of epidemic using parameter values given in Table 1 with: (a) R0= 1.6; p = 0.68; q = 0.8; Tc= 12% (three infection waves); (b) R0=1.7; p = 0.66; q = 0.71; Tc= 11% (three infection waves);
(c) R0= 1.9; p = 0.47; q = 0.7; Tc= 18% (two infection waves); and (d) R0= 2; p = 0.8; q = 0.64; Tc= 18% (two infection waves). Black and red
curves correspond respectively to the total untreated and treated sensitive ( I + IT) and resistance ( Ir+ IT,r) infections without isolation.
Wessel et al. BMC Public Health 2011, 11(Suppl 1):S2 http://www.biomedcentral.com/1471-2458/11/S1/S2
outbreak, the evolutionary responses of the pathogen to control measures (e.g., emergence of drug resistance), or a combination thereof. We performed further experi-ments with small changes in these parameters, and observed significant influences on the epidemic dynamics that can be associated with the elimination or creation of an infection wave. It is worth noting that the above scenarios can take place even for sufficient drug stockpiles for which run-out does not occur, if a policy for adaptation (e.g., reduction) of treatment at the popu-lation level is implemented due to wide-spread drug-resistance [15].
For comparison purposes, we simulated the stochastic version of the model using a Markov Chain Monte Carlo method and observed sequences of infection waves for different sets of parameter values (see Appendix). Consis-tent with previous observations [4], the stochastic model displays a later peak time of infection waves (with lower magnitudes) than the homogeneous mean-field model. This depends not only on the treatment level, but also on other parameters involved in the spread of sensitive and resistant infections, such as the reduction in the poten-tially infectious contacts and the fitness of resistance. Furthermore, stochastic effects can play a significant role in determining disease dynamics even during the outbreak well past the initial establishment phase of the epidemic. This is illustrated in Figure 4c of the Appendix that the epidemic dies out after the first outbreak in the stochastic model; whereas a second wave of infection
takes place in the mean-field model with a larger magni-tude compared to the first outbreak.
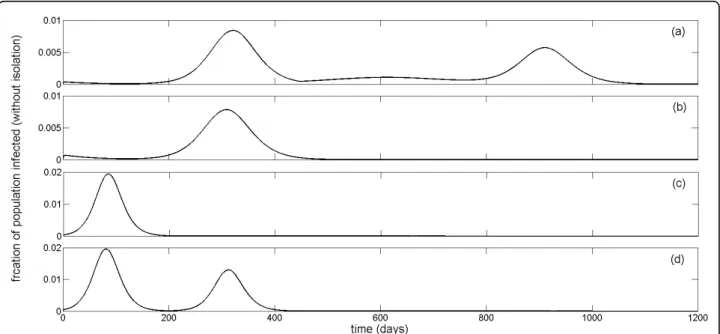
In addition to parameters pertaining to the nature of dis-ease and effectiveness of interventions, the number of infected cases at the onset of an epidemic can greatly influ-ence the dynamics of disease. Our simulations (Figure 3) indicate that small changes in the initial number of infec-tions may result in different epidemic profiles exhibiting more than one infection wave. This suggests that the true dynamics of an emerging disease (with unknown initial number of infections) may not be predicted with certainty, even when reliable estimates of other pathogen-related and intervention parameters are available.
Discussion
Stellar advances in the prevention and management of infectious diseases have been achieved since the great influenza pandemic of 1918. Yet, emerging pathogens often inflict incalculable devastation to humanity. The glo-bal mobilization with rapid international transportation between populations makes the impact of such diseases even more dramatic with potential socioeconomic uphea-val. This was recognized in 2003 with the appearance of severe acute respiratory syndrome (SARS) as the first major infectious disease threat of the 21stcentury [21], and was recently experienced with the worldwide spread of a swine-origin influenza A virus H1N1, that led the World Health Organization to declare this virus as the cause of an influenza pandemic on June 11, 2009 [22].
Figure 3 The effect of changes in the initial number of infections on epidemic profiles. Simulations for the time-courses of epidemic (total number of infections without isolation: I + IT+ Ir+ IT,r) using parameter values given in Table 1. Other parameters are: (a,b) R0=1.9; p = 0.72; q =
0.71; Tc= 22.2% and initial infected cases of (a) E0= 6 (three infection waves) and (b) E0= 12 (single infection wave); (c,d) R0= 2.5; p = 0.55; q =
Public health responses to the emergence of new diseases often involve difficult decisions on optimal use of health resources over very short timelines. Such decisions are further confounded by substantial uncertainties regarding the epidemiological characteristics of the novel infectious pathogen, the effectiveness of public health intervention strategies, and the evolutionary responses of the pathogen under the pressure of control measures [23]. From a popu-lation health perspective, it is therefore imperative to look beyond short-term targets and account for long-term dis-ease outcomes in strategy development and implementa-tion. This is particularly important for preventing multiple infection outbreaks that may result from imprudent use of resources or unintended adverse consequences of disease containment strategies.
Given the historical evidence for the occurrence of multiple infection waves [2,3,7], several modelling stu-dies have attempted to provide explanatory theories for these events in a single epidemic course [2,5,6,8-10]. In this study, we developed mean-field and stochastic models to investigate possible causes of sequential out-breaks from a public health perspective. Our results show that epidemic dynamics can be substantially affected by factors that influence policy design and implementation (e.g., treatment level or isolation of infected individuals), and parameters that determine the effectiveness and consequences of control measures (e.g., reduction in infectiousness due to treatment or emergence of drug-resistance). Furthermore, the initial
number of infections can influence disease outcomes. While mean-field and stochastic models may exhibit similar epidemic behaviour, we also observed differ-ences in their predictions in terms of the speed with which disease spreads through the population (with further delay in the peak time of outbreaks in the sto-chastic model); the magnitudes of infection outbreaks; and more importantly, the occurrence of infection waves (see Appendix). The latter is particularly influ-enced by stochastic effects, in addition to the structure of contact patterns and heterogeneity in population interactions [4]. Previous work [4,24] provides a solid foundation for extension of this study through the development of network dynamical models of disease transmission in which heterogeneous contacts between individuals are accounted for.
In this study, we simplified the models and included compartments corresponding to some possible stages of a disease; yet we understand that different patho-gens may cause infections with different clinical mani-festations and infectiousness periods. For example, influenza is known to have a short latent period of less than 2 days before becoming infectious [17], fol-lowed by a pre-symptomatic infection during which disease can be transmitted without showing clinical symptoms; however, the latent period of SARS is esti-mated to be longer and may be comparable to the duration of a complete course of influenza infection [17]. It is also well-documented that influenza can be
0 100 200 300 400 500 600 700 800 900 1000 0 20 40 60 80 100 0 50 100 150 200 250 300 350 400 0 50 100 150 200 total number o f in fections (without isolation ) 0 100 200 300 400 500 600 0 50 100 150 time (days) (a) (b) (c)
Figure 4 Stochastic simulations. Stochastic simulations for the time-courses of epidemic (including sensitive and resistant infections without isolation) using parameter values given in Table 1 of the main text with: (a) R0= 1.9, p = 0.65, q = 0.72, Tc= 19.5% (three infection waves); (b)
R0= 1.9, p = 0.5, q = 0.65, Tc= 15% (two infection waves); and (c) R0= 1.9, p = 0.5, q = 0.66, Tc= 16% (one infection wave). Black and red
curves correspond respectively to the sensitive (untreated and treated: I + Iτ) and resistant (untreated and treated: Ir+ IT,r) infections. Blue curves
illustrate the corresponding scenarios for the total number of infections (I + IT+ Ir+ IT,r) during epidemic simulated in the mean-field model. In
all simulations, initial number of infected cases is E0= 10.
Wessel et al. BMC Public Health 2011, 11(Suppl 1):S2 http://www.biomedcentral.com/1471-2458/11/S1/S2
transmitted in asymptomatic form without developing clinical symptoms [25]; while evidence for asympto-matic transmission of SARS is rather scant. These dis-crepancies in infection stages of human diseases, combined with the ability of the pathogens to over-come the pressures that are applied to limit their replication and spread, can profoundly impact not only the feasibility and effectiveness of control mea-sures, but also the dynamics of disease over the course of an epidemic. Our study highlights these considera-tions for further investigation, while demonstrating possible mechanisms for the occurrence of multiple infection waves in a single epidemic. Future research in this direction should address some limitations of the present study, including a systematic exploration of parameter space to characterize which intervention parameter regimes are more likely to give rise to sequences of infection outbreaks, and to determine the sensitivity of model outputs (epidemic dynamics) on parameter changes.
Although models considered here are simulated for influenza infection as a case study, understanding the interplay between intervention parameters, evolutionary responses of the pathogens, and epidemic dynamics remains a critical objective of public health for many diseases [26], including HIV, tuberculosis, malaria, and several bacterial infections. Such diseases often share common features, including the emergence and preva-lence of drug resistant pathogens under the pressure of drug treatment. The initial rise of resistance is generally associated with fitness costs that make the resistant pathogen less capable of competing with the sensitive pathogen (as the dominant competitor) in a given host population [11]. However, evolutionary mechanisms (e.g., compensatory mutations [27]) may improve the fit-ness of resistant pathogens, and therefore intervention measures may result in further selection of resistance, as has been documented for the global spread of seasonal influenza drug resistance that appears to be associated with fitness enhancement processes [28]. This suggests that future modelling efforts should integrate factors that govern pathogen-host interactions with the mechanisms of disease epidemiology to guide public health in devising novel and effective means of infection control.
Appendix: Stochastic model
With the same population compartments as defined in the mean-field model described in the main text, we develop a stochastic model for disease transmission dynamics to investigate the epidemic patterns with random effects. We consider time t as a continuous variable, and define the following random vector for t Î [0, ∞)
X t( )=( ( ) , ( ) ,S t E t E tr( ) , ( ) ,I t IT( ) ,t Ir( ) ,t IT r,( ) , ( ) ) ,t J t with ΔX t( )= X t( + Δ −t) X t( ) that represents changes that occur to the random vector at ∆t units of time. We define the transition probability as
Pr(Δ ( ) )=( ( ) , ( ) , ( ) , ( ) , ( ) , ( ) , ( ,) , ( ) ) X t ΘS ΘE ΘEr ΘI ΘIT ΘIr ΘIT r ΘJ ||Δ ( ) ) , X t (3) where Θ( )⋅ =
−1 decrease in the class ( )⋅ 0 no change in the class (⋅⋅
⋅ ⎧ ⎨ ⎪ ⎩ ⎪ ) 1 increase in the class ( )
The function Θ(·) describes the status of an individual in a subpopulation (i.e., Θ(·) = –1: an individual leaves the subpopulation; Θ(·) = 0: no changes occur to the indi-viduals’ status in the subpopulation; Θ(·) = 1: an indivi-dual enters the subpopulation). We assume that ∆t is sufficiently small, so that at most one change of status can occur during the time interval ∆t, which can be viewed as a Markov chain process. The resulting stochas-tic model can be described as a continuous time Markov model, with the transition probabilities given in Table 2.
Algorithm for stochastic simulations
For simulating the stochastic model, we used the Markov Chain Monte Carlo method, with an initial E(0) = 10 exposed individuals to sensitive infection in a population of S0 = 10, 000 susceptibles. A key parameter in these
simulations is the step-size of the Monte Carlo method. Using a fixed step-size requires a large number of steps to guarantee that the transitions between subpopulations take place and disease transmission can occur, which is computationally very demanding in terms of both timing and resources. To reduce such a computational load, we implemented an adaptive step-size method [29] to esti-mate the transition time to the next event (∆t) by calcu-lating the sum of the frequencies of all possible events, given by h = b(I + δTIT)S(t) + δrb(Ir+ IT,r)S(t) + (1 – p)µE
(E + Er) + pqµE(E + Er) + aIT+ p(1 – q)µE(E + Er) + g(I +
Ir+ IT,r+ J + IT). Then, by choosing ∆t = U1/h, where U1
is uniform distribution in the interval [0,1], we ordered all possible events as an increasing fraction of h and gen-erated another uniform deviate (U2Î[0,1]) to determine
the nature of the next event. For the convergence of the results, we ran these simulations for 1000 samples, and considered the average of sample realizations of the sto-chastic process to generate infection curves.
Stochastic simulations
We ran stochastic simulations with parameter values given in Table 1 to illustrate the possibility of multiple
infection waves for different scenarios with variation in the basic reproduction number, fractions of treated and isolated ill individuals, and the capacity for treatment and isolation. Figure 4a shows that, since the transmis-sion of the sensitive infection is largely blocked by a high treatment level, resistance emerges and causes the first infection wave of the outbreak. The second wave of resistant infections follows after the capacity of treat-ment and isolation (Tc) is exhausted, and declines when
susceptibility of the population falls below a certain threshold that is sufficient to end the resistant outbreak (red curve). However, due to higher fitness of the sensi-tive infection, a third wave of outbreak occurs which results in depletion of the susceptible population to levels sufficient for ending the epidemic (black curve). We observed similar behaviour in the mean-field model, as illustrated by the blue curve in Figure 4a. When treatment level is reduced by a significant margin, gen-erated resistant infection is out-competed by the sensi-tive infection which has a higher fitness advantage (Figure 4b), and only outbreaks of the sensitive infection occur; the second wave takes place after the capacity of treatment is fully dispensed (black curve). While, the mean-field model also produces similar results (blue curve), we observed differences in the behaviour of the stochastic model. A small reduction in the fraction of isolated individuals leads to the elimination of the sec-ond wave in the stochastic model, while mean-field model still produces a second wave with even a larger magnitude than the first wave of the outbreak (Figure 4c). This suggests that not only are stochastic effects important during the early stages of disease outset, but they also can play a critical role in shaping the epidemic well beyond the establishment phase of the disease.
Acknowledgements
This research was supported by the Natural Sciences and Engineering Research Council of Canada (NSERC), and the Mathematics of Information Technology and Complex Systems (MITACS).
This article has been published as part of BMC Public Health Volume 11 Supplement 1, 2011: Mathematical Modelling of Influenza. The full contents of the supplement are available online at http://www.biomedcentral.com/ 1471-2458/11?issue=S1.
Author details
1Institute for Biodiagnostics, National Research Council Canada, Winnipeg,
Manitoba, R3B 1Y6, Canada.2Centre for Disease Modelling, York Institute of Health Research, York University, Toronto, Ontario, M3J 1P3, Canada.
3Department of Mathematics and Statistics, University of Winnipeg,
Winnipeg, Manitoba, R3B 2E9, Canada. Authors’ contributions
Developed mean-field model and performed simulations: LW, SM. Developed stochastic model and performed simulations: YH, SM. Designed the study and wrote the paper: JW, SM. All the authors have read the final version of the paper and approved it.
Competing interests
The authors declare that they have no competing interests. Published: 25 February 2011
References
1. Cox NJ, Tamblyn SE, Tam T: Influenza pandemic planning. Vaccine 2003, 21:1801-1803.
2. Taubenberger JK, Morens DM: 1918 influenza: the mother of all pandemics. Emerg Infect Dis 2006, 12:15-22.
3. Gani R, Hughes H, Fleming D, Griffin T, Medlock J, Leach S: Potential impact of antiviral drug use during influenza pandemic. Emerg Infect Dis. 2005, 9(11):1355-1362.
4. Alexander ME, Dietrich SM, Hua Y, Moghadas SM: A comparative evaluation of modelling strategies for the effect of treatment and host interactions on the spread of drug resistance. J Theor Biol. 2009, 259:253-263.
5. Caley P, Philp DJ, McCracken K: Quantifying social distancing arising from pandemic influenza. J R Soc Interface 2008, 5:631-639.
6. Epstein JM, Parker J, Cummings D, Hammond RA: Coupled contagion dynamics of fear and disease: mathematical and computational explorations. PLoS ONE 2008, 3:e3955, doi:10.1371/journal.pone.0003955.
Table 2 Possible transitions between model compartments that can occur in ∆t units of time
event transition during ∆t transition rate
infection of a susceptible S(t) ® S(t) – 1 b(I + δTIT+ δr(Ir+ IT,r))S(∆t) + o(∆t)
increase in exposure (sensitive infection) E(t) ® E(t) + 1 b(I + δTIT)S(∆t) + o(∆t)
decrease in exposure (sensitive infection) E(t) ® E(t) – 1 µEE(∆t) + o(∆t)
increase in exposure (resistant infection) Er(t) ® Er(t) + 1 δrb(Ir+ IT,r)S(∆t) + o(∆t)
decrease in exposure (resistant infection) Er(t) ® Er(t) – 1 µEEr(∆t) + o(∆t)
increase in untreated sensitive infection I(t) ® I(t) + 1 (I – p)µEE(∆t) + o(∆t)
recovery from treated infection I(t) ® I(t) – 1 gI(∆t) + o(∆t) increase in untreated resistant infection Ir(t) ® Ir(t) + 1 (I – p)µEEr(∆t) + o(∆t)
recovery from untreated resistant infection Ir(t) ® Ir(t) – 1 gIr(∆t) + o(∆t)
increase in treated sensitive infection IT(t) ® IT(t) + 1 pqµEE(∆t) + o(∆t)
recovery from treated sensitive infection IT(t) ® IT(t) – 1 (a + g)IT(∆t) + o(∆t)
increase in treated resistant infection IT,r(t) ® IT,r(t) + 1 pqµEE(∆t) + aI∆t + o(∆t)
recovery from treated resistant infection IT,r(t) ® IT,r(t) – 1 gIT,r(∆t) + o(∆t)
increase in isolated infection J(t) ® J(t) + 1 p(1 – q)µE(E + Er)(∆t) + o(∆t)
recovery from disease in isolation J(t) ® J(t) – 1 gJ(∆t) + o(∆t) Wessel et al. BMC Public Health 2011, 11(Suppl 1):S2
http://www.biomedcentral.com/1471-2458/11/S1/S2
7. Hsieh Y.-H, Chen CWS: Turning points, reproduction number, and impact of climatological events for multi-wave dengue outbreaks. Trop Med Int Health. 2009, 14(6):628-638.
8. Merler S, Poletti P, Ajelli M, Caprile B, Manfredi P: Coinfection can trigger multiple pandemic waves. J Theor Biol. 2008, 254:499-507.
9. Poletti P, Caprile B, Ajelli M, Pugliese A, Merler S: Spontaneous behavioural changes in response to epidemics. J Theor Biol. 2009, 260:31-40. 10. Rios-Doria D, Chowell G: Qualitative analysis of the level of
cross-protection between epidemic waves of the 1918-1919 influenza pandemic. J Theor Biol. 2009, 261:584-92.
11. Domingo E, Holland JJ: RNA viruses mutations and fitness for survival. Annu Rev Microbiol 1997, 51:151-178.
12. Diekmann O, Heesterbeek JAP: Mathematical Epidemiology of Infectious Diseases. Chichester: Wiley; 2000.
13. Brauer F, Castillo-Chavez C: Mathematical Models in Population Biology and Epidemiology. Text in Applied Mathematics New York: Sprringer-Verlag; 2001.
14. van den Driessche P, Watmough J: Reproduction numbers and subthreshold endemic equilibria for compartmental models of disease transmission. Math Biosci 2000, 180:29-48.
15. Arino J, Bowman CS, Moghadas SM: Antiviral resistance during pandemic influenza: implications for stockpiling and drug use. BMC Infect Dis 2009, DOI:10.1186/1471-2334-9-8.
16. Moghadas SM: Management of drug resistance in the population: influenza as a case study. Proc R Soc B 2008, 275:1163-1169. 17. Lessler J, Reich NG, Brookmeyer R, Perl TM, Nelson KE, Cummings DA:
Incubation periods of acute respiratory viral infections: a systematic review. Lancet Infect Dis 2009, 9:291-300.
18. Moghadas SM, Bowman CS, Röst G, Wu J: Population-wide emergence of antiviral resistance during pandemic influenza. PLoS ONE 2008, 3:e1839. 19. Longini IM Jr, Nizam A, Xu S, Ungchusak K, Hanshaoworakul W,
Cummings DAT, Halloran ME: Containing pandemic influenza at the source. Science 2005, 309:1083-1087.
20. Ferguson NM, Cummings DAT, Cauchemez S, Fraser C, Riley S, Meeyai A, Iamsirithaworn S, Burke DS: Strategies for containing an emerging influenza pandemic in Southeast Asia. Nature 2005, 437:209-214. 21. Gumel AB, Ruan S, Day T, Watmough J, Brauer F, van den Driessche P,
Gabrielson D, Bowman C, Alexander ME, Ardal A, Wu J, Sahai BM: Modelling strategies for controlling SARS outbreaks. Proc R Soc B 2004, 271:2223-2232.
22. World now at the start of 2009 influenza pandemic [press release]. Geneva (Switzerland): World Health Organization, http://www.who.int/ mediacentre/news/statements/2009/h1n1_pandemic_phase6_20090611/en/ index.html; accessed April 7, 2010.
23. Moghadas SM, Day T, Bauch C, Driedger SM, Brauer F, Greer AL, Yan P, Wu J, Pizzi NJ, Fisman DN: Modelling of pandemic influenza: a guide for the perplexed. CMAJ. 2009, 181:171-173.
24. Débarre F, Bonhoeffer S, Regoes RR: The effect of population structure on the emergence of rug resistance during influenza pandemics. J R Soc Interface 2007, 4:893-906.
25. Fraser C, Riley S, Anderson RM, Ferguson NM: Factors that make an infectious disease outbreak controllable. Proc Natl Acad Sci USA 2004, 101:6146-6151.
26. Moghadas SM: Gaining insights into human viral diseases through mathematics. Eur J Epidemiol 2006, 21:337-342.
27. Handel A, Regoes RR, Antia R: The role of compensatory mutations in the emergence of drug resistance. PLoS Comput Biol. 2006 Oct;2(10):e137 2006, 2(10).
28. Simonsen L, Viboud C, Grenfell BT, Dushoff J, Jennings L, Smit M, Macken C, Hata M, Gog J, Miller MA, Holmes EC: The genesis and spread of reassortment human influenza A/H3N2 viruses conferring adamantane resistance. Mol Biol Evol 2007, 24:1811-1820.
29. Rohani P, Keeling MJ, Grenfell BT: The interplay between deterministic and stochasticity in childhood diseases. Am Nat 2002, 159:469-481.
doi:10.1186/1471-2458-11-S1-S2
Cite this article as: Wessel et al.: Public health interventions for epidemics: implications for multiple infection waves. BMC Public Health 2011 11(Suppl 1):S2.
Submit your next manuscript to BioMed Central and take full advantage of:
• Convenient online submission
• Thorough peer review
• No space constraints or color figure charges
• Immediate publication on acceptance
• Inclusion in PubMed, CAS, Scopus and Google Scholar
• Research which is freely available for redistribution
Submit your manuscript at www.biomedcentral.com/submit