HAL Id: hal-01986499
https://hal.archives-ouvertes.fr/hal-01986499
Submitted on 29 Jan 2021
HAL is a multi-disciplinary open access
archive for the deposit and dissemination of
sci-entific research documents, whether they are
pub-lished or not. The documents may come from
teaching and research institutions in France or
abroad, or from public or private research centers.
L’archive ouverte pluridisciplinaire HAL, est
destinée au dépôt et à la diffusion de documents
scientifiques de niveau recherche, publiés ou non,
émanant des établissements d’enseignement et de
recherche français ou étrangers, des laboratoires
publics ou privés.
Eye and Mouse Coordination During Task: From
Behaviour to Prediction
Alexandre Milisavljevic, Kevin Hamard, Coralie Petermann, Bernard
Gosselin, Karine Doré-Mazars, Matei Mancas
To cite this version:
Alexandre Milisavljevic, Kevin Hamard, Coralie Petermann, Bernard Gosselin, Karine Doré-Mazars,
et al.. Eye and Mouse Coordination During Task: From Behaviour to Prediction. International
Conference on Human Computer Interaction Theory and Applications, Jan 2018, Funchal, Portugal.
pp.86-93, �10.5220/0006618800860093�. �hal-01986499�
Eye and Mouse coordination during task: from behaviour to prediction
Alexandre Milisavljevic
1,2,3, Kevin Hamard
3, Coralie Petermann
3, Bernard Gosselin
1Karine
Dor-Mazars
2and Matei Mancas
11Numediart institute, University of Mons, Mons, Belgium
2Psychology institute, VAC EA7326 team, Paris Descartes University, Paris, France 3Research and Development department, Sublime Skinz, Paris, France
Keywords: Behaviour, Visual Attention, Webpages, Mouse-tracking
Abstract: The study of web users’ behaviour is of crucial importance for understanding people reaction when browsing websites. Eye-tracking is a precise tool for this purpose, but it is hard to scale up when trying to apply it to a wide range of situations and websites. On the other hand, mouse-tracking fulfills these requirements. Unfor-tunately, mouse data provides a limited approximation of the eye position as it was shown in the literature. In this paper, we investigated the relationship between mouse and eye behaviour on several kind of websites with three different tasks to create models based on these behaviours. Our findings were that 1) saliency Pearson’s correlation is not suitable to analyse eye and mouse coordination, 2) this coordination is altered according to the task, 3) scroll speed directly influence where the eyes are during the scroll, 4) amplitude vary according to eyes position before the scroll and 5) by using the X axis variations it is possible to find the moments where it is easier to model eyes location from mouse location.
1
Introduction
Understanding why a user visits a webpage has been a central question since the beginning of the twenty first century. To answer this question, Eye-tracking has been used as a precise tool to estimate intention impact on users gaze. However, these kinds of studies are hard to scale up and apply it to a wide user panel is difficult. That is why mouse-tracking emerged as an efficient proxy to determine users at-tention. Since then, correlation between mouse move-ments and eye movemove-ments has been found (Mueller and Lockerd, 2001; Chen, 2001; Rodden and Fu, 2007; Rodden et al., 2008; Cooke, 2006; Guo and Agichtein, 2010; Huang and White, 2012; Naval-pakkam et al., 2013) and modelling attempts followed (Guo and Agichtein, 2010; Huang and White, 2012; Navalpakkam et al., 2013; Boi et al., 2016).
Nevertheless, a majority of these studies focused on SERP (SEarch Result Pages) from search engines putting aside the rest of the web and tasks. In addition, eye-mouse and eye-task relationships have been stud-ied separately (Yarbus, 1967; Castelhano et al., 2009; Mills et al., 2011) but rarely together. That is why, the goal of this study was to explore the eye-mouse-task relationship in a more diversified environment.
Chen (2001) was the first to show that areas vis-ited by the mouse were also visvis-ited by the eye in free-viewing condition. Rodden and Fu (2007) also showed that regions visited by the mouse were also visited by the eye but they were the first to high-light the better correspondence on Y axis between mouse and eye. Unlike previous work, they set-up an experiment with pre-defined search queries on a search engine. Guo and Agichtein (2010) confirmed Rodden and Fu (2007) results about more accurate correlation on Y axis. Their main contribution was the first attempt to automatically infer the user’s eye position using mouse movements. They also sug-gested the presence of images did not have a signif-icant effect on eye-mouse coordination. Huang and White (2012) presented that amount of time spent on a search web page by a participant can affect where they were pointing and looking and then used this finding to enhance their algorithm. They showed that gaze-cursor alignment was distinct for each par-ticipant but did not highlight significant difference among women and men. Navalpakkam et al. (2013) updated previous work by investigating more recent SERP which now includes images and more complex content. They showed that this content induced differ-ent behaviour. Then they proposed a non-linear model
outperforming state-of-the-art models because of its non-linearity.
Our exploratory study aimed to investigate ef-fect(s) of user’s goal on eye and mouse coordination in ecological conditions (different categories of web sites, no scroll limitations). Our hypothesis was the following: there is a direct link between the eye, the mouse movements and the task which fluctuates ac-cording to the task. Thus, we could enhance the pre-cision of the current models.
This paper was structured as follows: experiment set-up was described in section 2 followed by the re-sults of the static and dynamic analyses in section 3. Finally we discussed and concluded the paper in sec-tion 4.
2
Method
We recruited five participants with normal or corrected-to-normal vision (4 males and 1 female) aged between 24 and 25 years from the local signal processing department. All participants were right-handed and fluent with computer operations. They were tested on 10 various websites including blogs, e-commerce platforms, etc. From the calibration phase at the beginning of the study to the end, the whole process took about 20 minutes per person.
2.1
Tasks
We used a set of five tasks distributed in three classes as presented in Table 1: free viewing, target finding and text reading. The number of pages that could be visited during Free viewing tasks was limited to two but was not limited in time and participants had full scroll possibilities. The reading task was specific enough to prevent any free interpretation in order to simulate participants’ willingness to read a specific paragraph. Finally, we chose two types of target find-ing tasks: one in which participants were instructed to find and buy an item, the second in which they had to find a given page.
2.2
Set-up
To record eye movements, we used a FaceLAB 5 eye-tracker at 60Hz without head constraint on a 17-inch screen set to a resolution of 1920X1080. Instructions and websites were displayed in Google Chrome max-imized with a resolution of 1920X955.
To record Mouse movements we developed a plug-in using WebExtensions1 standard. It took the 1https://developer.mozilla.org/Add-ons/WebExtensions
Category Description
Free viewing Browse the website by visiting at least two other pages
Browse two articles of your choice
Target finding Browse the following pages: cal-endar, team and news
Buy the specific given item Text reading Read the two first paragraphs
Table 1: Generic tasks used in the study.
form of an ON/OFF button on the browser top bar and has only been used by the operator. The ex-tension monitored the following metrics: time-stamp, event type (click, movement or scroll), mouse’s coor-dinates, offset induced by the scroll, URL and screen size. The plug-in developed in Javascript was upload-ing all mentioned metrics on the fly or every 50-60ms to a NodeJS2 server via a socket connection. The same server inserted in real time the data in a MySQL database without further processing. The server also kept track of the page to deliver to the participant.
2.3
Procedure
Participants started on a homepage describing the context of the study. To visit the next planned page by the study they had to click on a Javascript book-mark situated in the browser’s bookbook-mark top bar. The first click on it led them to the first task instruction. All tasks were stored in HTML format locally. After reading the instruction, participants could once again click on the bookmark and begin the task. When the task was completed participants had to click again on the bookmark to read the next instruction and so on. At the end of the study, participants were asked to answer to a survey about there knowledge of the web-sites.
3
Results
We ran three sets of analyses in order to high-light coordination between eye and mouse move-ments. First, we used 2D saliency metric PCC (Pear-son’s Correlation Coefficient) to check consistency between overall eye and mouse movements. Then we repeated the same analysis between participants’ eyes movements. Second, we applied literature’s tempo-ral and distance estimation to our task-related context to bring out tasks’ influence on eye and mouse
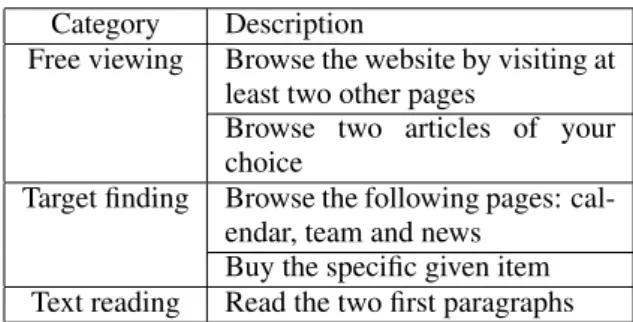
Figure 1: (a) eye fixation density map, (b) original website and (c) mouse fixation density.
ordination. Third, we analysed the participants’ be-haviour while scrolling because - at our knowledge - it has not been treated by the literature whereas it could be an essential information to the understand-ing of eye and mouse coordination. Finally, we used the results of the two first sets of observations to cre-ate two Gaussian-based models to approximcre-ate eye position from mouse position.
While the first approach focused on a static and spatial analysis, the second and third aimed for a dy-namic analysis taking into account the temporal evo-lution of both eye and mouse tracks.
3.1
Static fixation densities comparison
Pearson’s Correlation Coefficient (PCC) also known as the Pearson Product-Moment Correlation (1), is a metric used in saliency maps comparison by authors like Ouerhani et al. (2004) and Le Meur et al. (2007) and used to compare fixations and mouse movements by Tavakoli et al. (2017). PCC has a value between -1 and 1. When the coefficient is almost equal to 1, there is a strong relationship between the two vari-ables. The goal was to apply this metric to highlight eye and mouse coordination changes between tasks. The originality of this metric lies in the fact that it uses probability densities instead of raw variables values. To do so, we computed PCC between eyes density map and mouse density map. To obtain these maps, fixations from eye-tracking and mouse-tracking were convolved with a Gaussian filter. Thus PCC was com-puted between images (a) and (c) as shown in Figure
1.
PX,Y=
cov(X ,Y ) σXσY
(1) We obtained for our three tasks classes (free view-ing, target finding and text reading) defined in section 2.1 correlation scores as in Table 2, “inter” column. Both classes correlation and their relative difference remained small which showed that mouse-tracking could not be directly used to model eye movements. For this reason, we decided to refine the investigation based on motion dynamics in the next sections.
Furthermore, when comparing eye-tracking re-sults between different participants on the same stim-ulus, we obtained results in Table 2, “intra-eye” col-umn which showed a higher correlation for “Text reading” task than for the two others. This result con-firmed that if the task and its location were precise, then most of the participants would produce similar eye-gaze patterns. We observed the same behaviour for mouse tracks in Table 2, “intra-mouse” column, but with a lower overall correlation which showed that mouse behaviour remained less consistent than eye behaviour.
3.2
Dynamic analyses
Considering the dominant use of scroll in our exper-iment, modern vertically-based designs and the tend of Human eye to be more efficient horizontally, we separated X and Y coordinates to enhance granularity
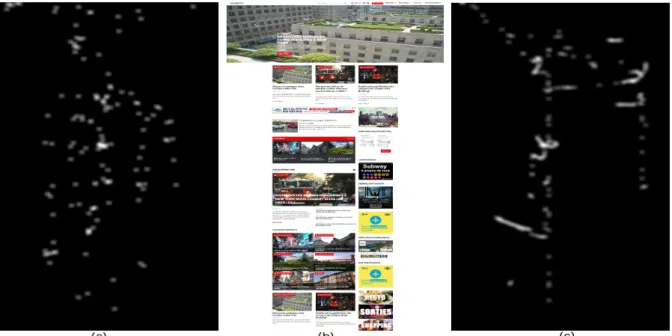
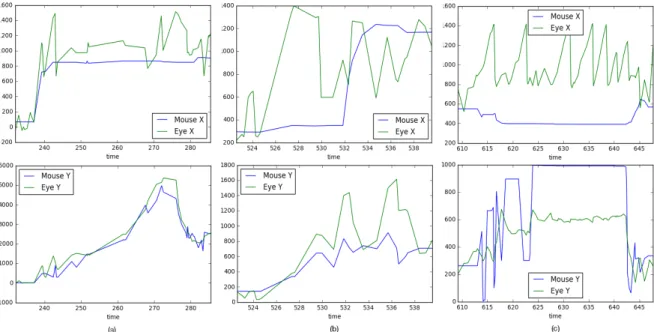
Figure 2: First column (a) is a free viewing task, second column (b) is a target finding task and third column (c) is a text reading task
Task inter intra-eye intra-mouse
Free viewing 0.132 0.036 0.082
Target finding 0.171 0.028 0.107
Text reading 0.176 0.440 0.162
Table 2: Pearson’s correlation coefficients for intra and inter analyses.
in our dynamic analyses. For each X and Y coordinate we got temporal vectors which were synchronized be-tween mouse and eye. To do so, we matched eye fixations with mouse events and then down-sampled mouse data to fit eye data. We chose to not interpo-late as in Deng et al. (2016) because it could have generated non-existing fixations and wrong results. 3.2.1 Temporal and distance estimation
We observed for some participants a time shift on Y axis between mouse and eye with the mouse be-ing delayed as in Figure 2 (a) and (c) right columns. This finding joined Huang and White (2012) previous work in which they detected a lag between the mouse and the eye. This could be explained by the fact that, in visual exploration context, the eye is the only mean of perception and leads the hand movements.
We computed euclidean distance (3) and obtained an eye-mouse distance of 554 pixels. This result was not in accordance with the average 229 pixels from state-of-the-art (Rodden and Fu, 2007; Guo and Agichtein, 2010; Huang and White, 2012). We then refined our analysis by separating the two axes.
Us-ing formula (2) we got a mean distance of 409 pixels for X axis and 291 pixels for Y axis. With this results we began to have a better consistency on Y axis as expected. However, Bejan (2009) demonstrated that our eyes scan horizontally faster than in the vertical dimension. Based on our results, we could assumed that participants kept their mouse vertically stationary to scroll down or up and used it as a vertical pointer, allowing them to horizontally browse without diffi-culties. Thus the participant could easily move his eye on X axis more often. That is why the participant tended to move it’s eye on X axis more often.
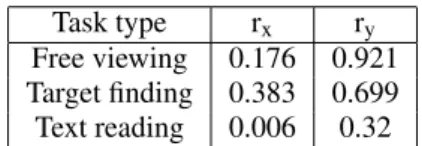
We then continued with separate axes to compute correlation. Compared to distances, correlation coef-ficients between mouse and eye were drastically dif-ferent. Chen (2001) obtained a correlation of 0.58 with more than 50% of the pages associated with cor-relations larger than 0.8. In our study, we measured a mean correlation of 0.64 on Y axis and 0.18 on X axis. Difference between axes got even more significant when we examined these correlations coefficients ac-cording to their corresponding task. As exposed in Table 3, free viewing task had the best correlation on Y with 0.9. This result reflected a greater trend to use the mouse as a vertical pointer as in other tasks. Co-efficients for target finding were more balanced with an increased correlation on X but a decrease on Y. Fi-nally, text reading correlations expressed the fact that participants did not used much the mouse during this task. We could assume that more the cognitive load of the task is important more the correlation drop on
Task type rx ry
Free viewing 0.176 0.921 Target finding 0.383 0.699 Text reading 0.006 0.32
Table 3: Pearson’s correlation on X and Y axes.
both axes.
d(i) = |xm(i) − xe(i)| (2)
d(X ,Y ) = q
(xm− xe)2+ (ym− ye)2 (3)
3.2.2 Scroll’s speed and direction influence As we previously exposed, mouse and eyes were more correlated on Y axis. In addition, scroll events are a barely studied subject while it is a common behaviour in all webpages browsing. We based all our calculus on scroll sessions which corresponds to a set of con-tinuous scroll events ended with a mouse movement. Scroll is an important feature providing good infor-mation about the degree of participants’ interest on a website. Another advantage is that the scroll is mea-surable on desktop and mobile. Through the follow-ing analyses, we highlighted influence of behaviour on scroll’s speed and amplitude.
We collected for each scroll session the direction (up or down) and the absolute speed. After empirical tries and errors and after taking into account the amount of data, we also separated the browser screen into 3 equals categories as in Figure 5 to detect patterns.
Figure 5: Screen’s three areas
For the current analyses we removed text reading tasks because it did not included enough scroll events. For both amplitude and speed influence test, we per-formed a one-way independent ANOVA (analysis of variance) (4) test. The ANOVA examines if the mean of numeric variables differs across levels of categor-ical variables. After checking all assumptions (nor-mality of errors, equal error variance across category, independence of errors), we hypothesized:
H0: µ0= µ1= µ2 (4)
H1: At least one mean is not equal to the others.
As shown in Table 4, we considered that all means were equal to each other. The statistic test we ran was the ratio of the between-category variance and the within-category variance. If this ratio was greater than the critical probability distribution F, we could reject the null hypothesis. After obtaining a p-value below the 0.05 threshold, we could affirm the rejec-tion of the null hypothesis with a confidence rate of 95 %. Thus, we can conclude that there is an effect of scroll speed on eyes category position.
Indicator Task Down Up
F-test Free viewing 4.26 7.07 Target finding 3.76 -P-value Free viewing 0.017 0.001
Target finding 0.031
-Table 4: Result test ANOVA with significance level (p-value) and F-score.
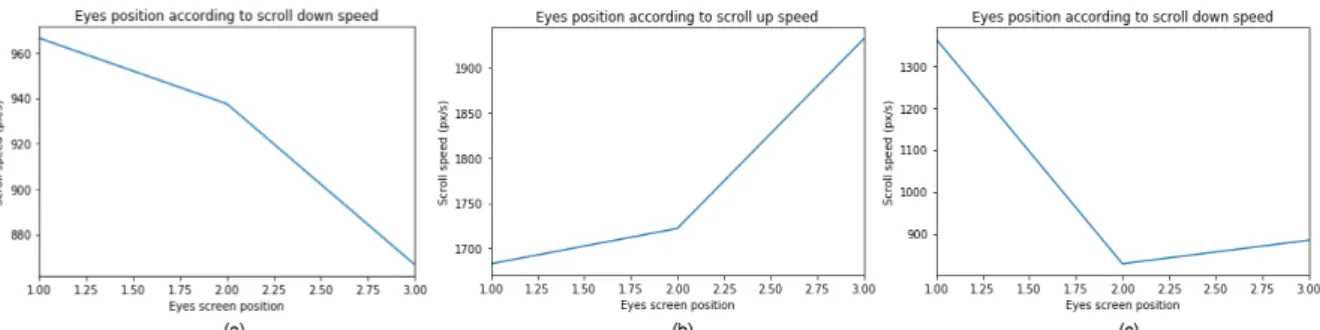
To go further, we had to determine and define this influence. We focused on means for each tasks using a Tuckey’s test. We observed that while scrolling quickly, participants positioned their eyes at the opposite side of the scroll’s direction to be able to detect bottom-up characteristics through peripheral vision as shown in Figure 3. Furthermore, when participants were looking for a specific information (target finding task), they tended to quickly look towards the center of the screen when the scroll speed decreased.
Then we focused on scroll’s amplitude, which is the distance between the start and the end of a scroll session. We wanted to know if participants adapted their eyes position before scrolling. Here again we differentiated the target finding and the free viewing tasks and calculated the means distance for each area before the participant scroll.
Indicator Task Down Up
F-test Free viewing 3.08 10.44
Target finding 0.09
-P-value Free viewing < 0.001 < 0.001
Target finding 0.9
-Table 5: Result test ANOVA with significance level (p-value) and F-score.
We could conclude using ANOVA test that for the free viewing task, when the eyes were located at the bottom of the screen and before scrolling up, the scroll amplitude increased with p-value < 0.05 as shown in Table 5. As expected, when the eyes were
Figure 3: Eyes position according to scroll speed, (a) and (b) corresponds to free viewing task, (c) corresponds to target finding task
Figure 4: Scroll amplitude according to screen area before scroll, (a) and (b) corresponds to free viewing task, (c) corresponds to target finding task
located on the top of the screen before scrolling down the scroll amplitude were much higher, see Figure 4 (a) and (b). About the target finding task, there was no significant impact (c) of amplitude on the screen area before scrolling (p-value > 0.05). However, we noticed that when searching specific information, par-ticipants did not have a long scroll amplitude in order to not miss an element (text, blocs, titles, etc) and to differentiate them.
The scroll event could improve the prediction of the localization of the eyes on Y axis using the com-bination of direction, amplitude and speed variables.
3.3
Model
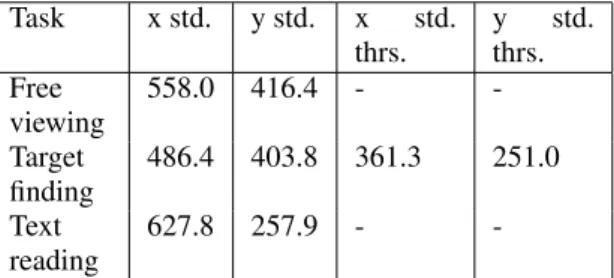
Previous analyses provided several insights about users behaviours on webpages given more or less spe-cific tasks. We built our models from these, more particularly from the eyes movements standard devia-tions. As in section 3.2.1, we separated X and Y axes to infer the parameters of a Gaussian model which predicted the eyes position based on the mouse posi-tion and cognitive load of the task. From these stan-dard deviations we were able to define a confidence area around the mouse in which the eyes had a 70% probability to be in it. We chose to base our calcu-lus on the 70thpercentile because it was the minimum
confidence rate we observed in the state of the art. As
shown in Table 6, columns “x std.” and “y std.”, the 70thpercentile (5) gave a first coarse pixel area around the mouse cursor.
percentile= µ ± Zσ (5)
But we were interested in a better model, so we fo-cused on specific behaviours during tasks. As shown in Figure 2 (a) target finding class, we identified sud-den changes on X axis. After analysing participants’ videos and comparing with several target finding tasks among them, we found that these sudden changes matched participant’s interest. When the participant had a target finding goal and found his target, he quickly moved his mouse to the point of interest.
Thus, we manually defined a threshold at the be-ginning of each sudden changes and we computed the standard deviation before and after every final sudden change on X. We obtained better results as shown in Table 6, column “x std. thrs.” and “x std. thrs.”. Area covered by the 70thwas reduced by around 150 pix-els for both axes. With this second model, we were able to increase the accuracy but only by focusing on a specific event.
Task x std. y std. x std. thrs. y std. thrs. Free viewing 558.0 416.4 - -Target finding 486.4 403.8 361.3 251.0 Text reading 627.8 257.9 -
-Table 6: Standard deviation (percentile 70%) normal and using only sudden X changes.
4
Conclusion and Discussion
We first compared eye and mouse data with the saliency metric PCC. We did not find significant con-sistency between participants’ eyes and mouse posi-tions (inter) and between participants’ eyes (intra). However, results showed that participants behaved in a more similar way when they had the same task with the same location (reading task).
Then, we got deeper with dynamic analyses. We showed that using distance and correlation, we were able to highlight more interesting coordinations be-tween eyes and mouse. We had better results on Y axis than X axis and succeed to demonstrate behaviour dif-ferences between tasks. In addition, scroll analyses, clearly showed a relation between eyes position and scroll speed while browsing and amplitude before the scroll.
Finally, we made a model for each task able to pre-dict the area around the mouse’s cursor in which the eyes had 70% chances to be located in. However, eyes location uncertainty compared to mouse position re-mained high, even if we succeed to enhance the model during target finding task by observing brutal changes on X axis.
In this paper, we presented results of a prelimi-nary study, used as a validation to conduct a bigger experiment, including more participants. This will al-low us to analyse the impact of participants’ age on their mouse movements. Moreover, we did not use scroll events analyses to enhance our models. In fu-ture work, we think that doing so, could boost the precision of the model by reducing the area around the mouse’s cursor. We could also investigate new re-lations between the scroll and the eyes by analysing scroll in 2D. Then, we could use machine learning models to integrate new features and more user be-haviours such as mouse patterns. Finally, our main objective is to propose the most accurate model in order to use it in real time to predict web user be-haviours.
5
Acknowledgement
We thank French Research and Technology As-sociation (ANRT) and Sublime Skinz for supporting this work.
REFERENCES
Bejan, A. (2009). The goldenratio predicted: Vision, cog-nition and locomotion as a single design in nature. Inter-national Journal of Design & Nature and Ecodynamics, 4(2):97–104.
Boi, P., Fenu, G., Davide Spano, L., and Vargiu, V. (2016). Reconstructing User’s Attention on the Web through Mouse Movements and Perception-Based Content Iden-tification. Transactions on Applied Perception, 13(3):1– 21.
Castelhano, M. S., Mack, M. L., and Henderson, J. M. (2009). Viewing task influences eye movement control during active scene perception. Journal of Vision, 9(3):1– 15.
Chen, M.-c. (2001). What can a mouse cursor tell us more? Correlation of eye / mouse movements on web browsing. In Conference on Human Factors in Computing Systems, pages 281–282.
Cooke, L. (2006). Is the Mouse a” Poor Man’s Eye Tracker”? Annual Conference-Society for Technical Communication, 53:252 – 255.
Deng, S., Chang, J., Kirkby, J. A., and Zhang, J. J. (2016). Gazemouse coordinated movements and depen-dency with coordination demands in tracing. Behaviour & Information Technology, 35(8):665–679.
Guo, Q. and Agichtein, E. (2010). Towards predicting web searcher gaze position from mouse movements. In Ex-tended Abstracts of Conference on Human Factors in Computing Systems, pages 3601–3606.
Huang, J. and White, R. (2012). User See, User Point: Gaze and Cursor Alignment in Web Search. In Special Interest Group of Conference on Human Factors in Computing Systems, pages 1341–1350.
Le Meur, O., Le Callet, P., and Barba, D. (2007). Predict-ing visual fixations on video based on low-level visual features. Vision Research, 47(19):2483–2498.
Mills, M., Hollingworth, A., and Dodd, M. D. (2011). Ex-amining the influence of task set on eye movements and fi xations. Journal of Vision, 11(8):1–15.
Mueller, F. and Lockerd, A. (2001). Cheese: tracking mouse movement activity on websites, a tool for user modeling. In Extended Abstracts of Conference on Hu-man Factors in Computing Systems, pages 279–280. Navalpakkam, V., Jentzsch, L. L., Sayres, R., Ravi, S.,
Ahmed, A., and Smola, A. (2013). Measurement and modeling of eye-mouse behavior in the presence of non-linear page layouts. In International Conference on World Wide Web, pages 953–964.
Ouerhani, N., Wartburg, R. V., and Heinz, H. (2004). Em-pirical Validation of the Saliency-based Model of Visual Attention. Electronic Letters on Computer Vision and Image Analysis, 3(1):13–24.
Rodden, K. and Fu, X. (2007). Exploring how mouse move-ments relate to eye movemove-ments on web search results pages. In Special Interest Group on Information Re-trieval Workshop on Web Information Seeking and Inter-action, pages 29–32.
Rodden, K., Fu, X., Aula, A., and Spiro, I. (2008). Eye-mouse coordination patterns on web search results pages. In Extended Abstracts of Conference on Human Factors in Computing Systems, pages 2997–3002.
Tavakoli, H. R., Ahmed, F., Borji, A., and Laaksonen, J. (2017). Saliency Revisited: Analysis of Mouse Move-ments versus Fixations. In Conference on Computer Vi-sion and Pattern Recognition, pages 4321–4329. Yarbus, A. L. (1967). Eye Movements. New York: Plenum