HAL Id: hal-02095180
https://hal-montpellier-supagro.archives-ouvertes.fr/hal-02095180
Submitted on 26 May 2020
HAL is a multi-disciplinary open access archive for the deposit and dissemination of sci-entific research documents, whether they are pub-lished or not. The documents may come from teaching and research institutions in France or abroad, or from public or private research centers.
L’archive ouverte pluridisciplinaire HAL, est destinée au dépôt et à la diffusion de documents scientifiques de niveau recherche, publiés ou non, émanant des établissements d’enseignement et de recherche français ou étrangers, des laboratoires publics ou privés.
Loup Rimbaud, Sylvie Dallot, Claude Bruchou, Sophie Thoyer, Emmanuel
Jacquot, Samuel Soubeyrand, Gael Thébaud
To cite this version:
Loup Rimbaud, Sylvie Dallot, Claude Bruchou, Sophie Thoyer, Emmanuel Jacquot, et al.. Improv-ing management strategies of plant diseases usImprov-ing sequential sensitivity analyses. Phytopathology, American Phytopathological Society, 2019, 109 (7), pp.1184-1197. �10.1094/PHYTO-06-18-0196-R�. �hal-02095180�
Version preprint
1
Improving management strategies of plant diseases using sequential
2sensitivity analyses
3 Short title: Improving plant disease management strategies
4 Loup Rimbaud1,2, Sylvie Dallot1, Claude Bruchou3, Sophie Thoyer4, Emmanuel Jacquot1, Samuel 5 Soubeyrand3 and Gaël Thébaud1*
6 1 BGPI, INRA, Montpellier SupAgro, Univ. Montpellier, CIRAD, TA A-54/K, Campus de Baillarguet, 7 34398, Montpellier Cedex 5, France.
8 2 Present address: Pathologie Végétale, INRA, Montfavet, France. 9 3 BioSP, INRA, Avignon, France.
10 4 CEE-M, Montpellier SupAgro, INRA, CNRS, Univ. Montpellier, France. 11 * Corresponding author: Gaël Thébaud
12 Phone: +33 4 99 62 48 55
13 Email: [email protected]
Version preprint
15
ABSTRACT
16 Improvement of management strategies of epidemics is often hampered by constraints
17 on experiments at large spatiotemporal scales. A promising approach consists of modelling
18 the biological epidemic process and human interventions, which both impact disease spread.
19 However, few methods enable the simultaneous optimisation of the numerous parameters of
20 sophisticated control strategies. To do so, we propose a heuristic approach (i.e., a practical
21 improvement method approximating an optimal solution) based on sequential sensitivity
22 analyses. In addition, we use an economic improvement criterion, based on the net present
23 value, accounting for both the cost of the different control measures and the benefit
24 generated by disease suppression. This work is motivated by sharka (caused by Plum pox
25 virus), a vector-borne disease of prunus trees (especially apricot, peach and plum) whose
26 management in orchards is mainly based on surveillance and tree removal. We identified the
27 key parameters of a spatiotemporal model simulating sharka spread and control, and
28 approximated optimal values for these parameters. The results indicate that the current
29 French management of sharka efficiently controls the disease, but can be economically
30 improved using alternative strategies that are identified and discussed. The general approach
31 should help policymakers to design sustainable and cost-effective strategies for disease
32 management.
33 Keywords: cost-effectiveness, culling, PPV, roguing, SEIR, sensitivity analysis, Sobol.
34
INTRODUCTION
35 Improving large-scale disease management constitutes a major challenge. Faced with
Version preprint
37 design management strategies, but opinions are not necessarily based on quantitative data.
38 Some specific control methods can be tested through field trials, but they constitute only part
39 of a global wider management strategy, which must be assessed at large spatiotemporal
40 scales. However, at such scales field trials are considerably limited by tractability issues,
41 resulting in poorly generalizable results from the very few trials that might be carried out.
42 Epidemiological models have been very helpful to overcome these obstacles and to account
43 for the interactions between biological processes and human interventions that jointly impact
44 disease spread (Jeger et al. 2018; Parnell et al. 2017). The key epidemiological parameters of
45 these models are prime targets for control measures. These parameters can be identified
46 using global sensitivity analysis, as shown for invasive plants (Coutts et al. 2011), and plant
47 pathogens such as viruses (Chan and Jeger 1994; Holt et al. 1999; Jeger and Chan 1995;
48 Rimbaud et al. 2018a), fungi (Papaïx et al. 2014; Xu and Ridout 1998), and bacteria (Breukers
49 et al. 2007). By varying input parameters of a simulation model within their respective
50 variation ranges (corresponding to their natural variation or to the uncertainty on their
51 estimates), global sensitivity analysis allows the computation of ‘sensitivity indices’
52 quantifying the influence of the variability of each input parameter on a given output variable
53 (Saltelli et al. 2008). The definition of parameter variation ranges depends on the objectives
54 of the modeller (e.g., identifying key drivers of a biological process, identifying parameters
55 which deserve to be better estimated), and are informed by quantitative data or expert
56 opinions.
57 Some epidemiological models are used to assess the potential of different control
58 actions in various epidemic scenarios. In this context, studies dealing with the management
59 of perennial plant diseases have addressed management strategies based on roguing and
Version preprint
61 2017; Ndeffo Mbah and Gilligan 2010; Parnell et al. 2009, 2010; Sisterson and Stenger 2013),
62 planting with different densities (Chan and Jeger 1994; Cunniffe et al. 2014, 2015; Jeger and
63 Chan 1995), planting outside of contaminated areas (Chan and Jeger 1994; Filipe et al. 2012;
64 Jeger and Chan 1995), or spraying with insecticides (Filipe et al. 2012). These studies optimised
65 one or two control parameters under various epidemiological scenarios, but the other control
66 parameters remained fixed at their reference value. Because control parameters generally
67 interact each other, it is crucial to develop an alternative approach that jointly explores
68 numerous combinations of control parameters to identify promising combinations of
69 parameter values.
70 Our work is motivated by the management of sharka, the most damaging disease of
71 prunus trees (Cambra et al. 2006). Its causal agent, Plum pox virus (PPV, genus Potyvirus), is
72 naturally transmitted by more than 20 aphid species in a non-persistent manner (Labonne et
73 al. 1995) and has spread worldwide due to human shipping and planting of infected material
74 (Cambra et al. 2006). Faced with the threat posed by sharka, various management strategies
75 have been adopted in different countries (Rimbaud et al. 2015). In countries targeting disease
76 limitation (e.g., France) or eradication (e.g., United States), a key element of the management
77 strategy is the appropriate surveillance of nurseries and orchards, followed by tree removals.
78 Surveillance methods rely on leaf sampling followed by serological or molecular diagnostic
79 tests or, alternatively, visual inspection of prunus trees to detect sharka symptoms (mostly on
80 leaves and fruits). When infected trees are detected, they are culled to remove sources of
81 inoculum. Because of its long incubation period, PPV infection may remain undetected for
82 several months or years after inoculation, regardless of the surveillance method (Quiot et al.
83 1995; Sutic 1971). Combined with evidence of short-distance transmission of PPV (Dallot et al.
Version preprint
85 trees surrounding detected trees may need to be removed as well. In France, sharka
86 management is compulsory and a national decree specifies the control actions mentioned
87 above (JORF 2011). In particular, this decree describes a procedure defining the frequency of
88 visual surveillance of orchards depending on their distance to the nearest detected infection,
89 the removal of whole orchards if their annual contamination rate exceeds a given threshold,
90 and the conditions for replanting (Fig. 4A). This strategy is based on expert opinions and not
91 on quantitative data or a formal demonstration of its efficiency. In addition, it is expensive
92 (and complex) to implement. It is thus crucial to conduct a formal cost-benefit analysis and
93 identify improved management rules.
94 The three objectives of this work are: i) the development of a heuristic approach (i.e., a
95 practical method, not guaranteed to be optimal, but instead sufficient for reaching a goal) to
96 improve management strategies of epidemics using sequential sensitivity analyses; ii) the
97 design of an economic criterion which accounts for the balance between the costs induced by
98 control actions and the benefits of reducing epidemic damage; and iii) the identification of
99 economically improved alternatives to the current French strategy to manage sharka. To do
100 so, we use a spatiotemporal model initially developed in previous studies (Pleydell et al. 2018;
101 Rimbaud et al. 2018a). This model simulates the turnover of peach orchards in a real
102 landscape, recurrent PPV introductions at planting and PPV spread by aphid vectors; a
103 previous article presented an in-depth analysis of the model sensitivity to the included
104 epidemiological parameters (Rimbaud et al. 2018a). In the present work, we implemented in
105 this model an explicit management strategy, which is flexible enough to encompass sharka
106 management in several countries including France. Consequently, the identified strategies
107 should be of interest to the countries targeting area-wide management of sharka and more
Version preprint
109
MATERIALS AND METHODS
110 Model description
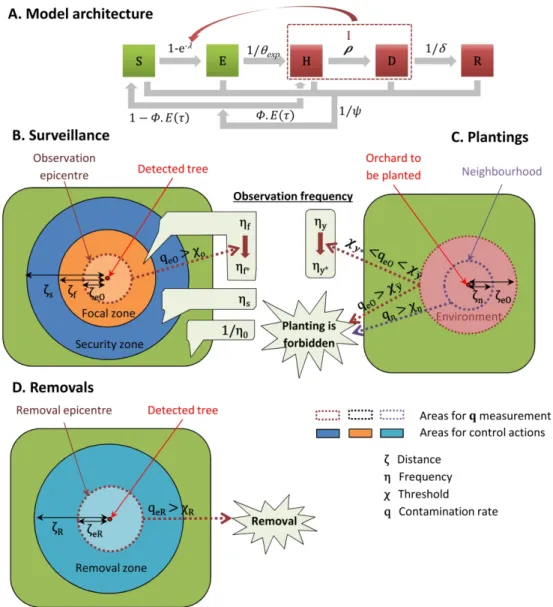
111 Model overview. We use a stochastic, spatially-explicit, SEIR
(susceptible-exposed-112 infectious-removed) model developed to simulate sharka epidemics in a real cultivated
113 landscape (Pleydell et al. 2018; Rimbaud et al. 2018a). This landscape, typical of a
peach-114 growing area in southeastern France, comprises 553 patches (i.e., land parcels, which are not
115 necessarily contiguous), representing a total area of 524 ha (average patch area: 0.95 ha; see
116 S1 map in Rimbaud et al. 2018a). Each patch is cultivated with a succession of peach orchards
117 (i.e., a peach crop planted at a given date, with an average density of approximately 720
118 trees.ha-1). The model is patch-based, with a discrete time step of 1 week. Each host is in one 119 of five health states (Fig. 1A). The epidemic process and the transitions between states were
120 described previously (Pleydell et al. 2018; Rimbaud et al. 2018a). Briefly, at the beginning of
121 the simulation, PPV is introduced for the first time (via orchard planting) in a single patch
122 identified using its connectivity with other patches, qκ. We define the connectivity of a patch
123 as the mean number of infectious aphids that would leave this patch if all trees in this patch
124 were infectious, and land in the other patches of the landscape. Thus, qκ depends on the patch
125 area and proximity to other patches and relates to its potential to initiate an epidemic. Further
126 introductions can occur at every orchard planting with probability Φ. At each introduction,
127 the prevalence (i.e., the proportion of infected trees in the orchard at the time of planting) τ
128 is drawn from a mixture distribution favouring high or low prevalences depending on the
129 relative probability of massive introduction, pMI. Once introduced in orchards, the pathogen
130 is spread by aphid vectors at a distance that depends on their dispersal kernel, parameterised
Version preprint
132 for details). Healthy trees (susceptible state S, Fig. 1A) become infected (exposed state E)
133 when successfully inoculated by infectious aphid vectors (the probability of infection depends
134 on the aphid transmission coefficient β). After a latent period (drawn from a Gamma
135 distribution with mean duration θexp and variance θvar and truncated in such way that the
136 latent period cannot end within the growing season in which the host is infected), infected
137 trees become infectious and symptomatic (hidden state H, i.e., these trees are not yet
138 detected), from where they may be detected (state D, with probability ρ). Once detected,
139 hosts are culled (removed state R) after a mean delay δ, and at the latest by the end of the
140 year (using a truncated Geometric distribution). It is assumed that infectious (i.e.,
141 symptomatic) trees are no longer productive, due to diseased-induced fruit loss or ban on fruit
142 sales. However, the disease is not supposed to affect host lifespan (no available data report
143 any increase in prunus mortality due to PPV), thus hosts can reach state R only if removed.
144 Due to orchard turnover (independent of the disease, simulated by drawing orchard duration
145 from a Poisson distribution with mean ψ=15 years), whole orchards can be replaced by trees
146 in state S (or possibly H). Table 1 summarises all the model parameters.
147 In this work, we complemented the existing model with an explicit disease management
148 strategy. After an initial epidemic period (arbitrarily fixed at five years to enable pathogen
149 establishment), a strategy based on orchard surveillance, tree removals and replanting
150 restrictions is applied during 30 years (which is twice the mean lifespan of the hosts and
151 consequently a reasonable duration in which to assess the efficiency of a management
152 strategy). The reference management strategy is based on the French management of sharka
153 in prunus orchards (JORF 2011). Nevertheless, our model allows a multitude of variations on
154 each control measure, which makes it possible to include some aspects of sharka management
Version preprint
156 Gottwald et al. 2013). The simulated management strategy is defined by 24 parameters (14
157 for surveillance, 6 for removals and 4 for replanting restrictions; see Fig. 1 and Table 1).
158 Each year, orchard surveillance, removals and planting bans depend on the location of
159 the corresponding patch relative to previously infected trees, and the local contamination rate
160 in the preceding year. Let Ω denote the set of orchards composing the area where the
161 contamination rate is measured (i.e., all orchards cultivated in patches whose border is within
162 a given radius of the centroid of the focal patch), 𝐷𝑖,𝑎+ the number of trees detected in orchard
163 i (i=1,…,I) during year a (a=1,…,af), and Ni the initial number of trees planted in this orchard.
164 Then the contamination rate in this area for year a is:
165 𝑞𝑎= ∑ 𝑖 ∈ 𝛺𝐷 + 𝑖,𝑎 ∑ 𝑖 ∈ 𝛺𝑁𝑖
166 Note that this measure is neither an annual incidence (i.e., the number of detected trees
167 divided by the number of trees at the beginning of the year) nor a prevalence, but the number
168 of detected trees divided by the number of trees at orchard planting, which is easier to
169 calculate directly by plant health services in the field.
170 Orchard surveillance. All orchards are surveyed visually for disease at least once every
171 1/η0 years (hence η0 is the basic surveillance frequency), and at each survey symptomatic
172 hosts (in state H) are independently detected with probability ρ. Detection of a symptomatic
173 tree triggers the definition (for the γo following years) of nested concentric zones around the
174 corresponding orchard (Fig. 1B). Within the focal zone, whose radius is ζf, orchards are
175 surveyed ηf times per year. Furthermore, an ‘observation epicentre’, which is nested within
176 the focal zone and whose radius is ζeO (ζeO <ζf), is defined to calculate the contamination rate
177 (noted qeO). If the contamination rate of the observation epicentre exceeds a threshold χo, the
Version preprint
179 extends from the outer boundary of the focal zone to a radius 𝜁𝑠 (𝜁𝑠 > 𝜁𝑓), orchards are 180 surveyed 𝜂𝑠 times per year.
181 Additionally, young orchards are surveyed ηy times per year during γy years, but this
182 frequency is changed to ηy* if, the year before orchard planting, the contamination rate of the
183 environment around the patch to be planted exceeds a threshold value 𝜒𝑦 ∗ (Fig. 1C). The
184 environment is a zone around the patch to be planted; its radius is ζeO (i.e., the same as the
185 observation epicentre).
186 When different surveillance frequencies are assigned to a single orchard (e.g., because
187 it is young and located in the intersection of focal and security zones defined around different
188 contaminated orchards), the maximum of these surveillance frequencies is applied.
189 Surveillance dates are drawn from a uniform distribution between the 92th and the 207th day
190 of the year, i.e., the earliest and the latest surveillance dates in the database collected in
191 southeastern France, respectively. If the cultivar produces flowers with petals (on which
192 symptoms may be observed), the surveillance period is extended from the 59th to the 207th
193 day.
194 Removals and replantings. Detected trees are removed individually and are not
195 supposed to be replanted, because it would lead to orchard desynchronization in terms of
196 phenology and fruit maturation. However, to avoid excessive fragmentation of orchards due
197 to individual removals, orchards are totally removed if the proportion of living trees (i.e., trees
198 in states S, E, H and D) falls below χSEHD, which is a threshold for economic profitability (see
199 details in supplementary Table S1). Moreover, detected trees trigger the definition of two
200 nested zones (unrelated to the observation zones) around their orchard: all orchards in the
201 removal zone (whose radius is ζR) must be removed if the contamination rate qeR of a ‘removal
Version preprint
203 threshold value χR (Fig. 1D). Two Boolean parameters, ΥRT and ΥR, indicate whether individual
204 detected trees or whole orchards, respectively, are to be removed after a mean delay of δ, or
205 at the end of the year. Orchards can be replanted after a delay of γS years. However, planting
206 is forbidden if the contamination rate of the environment exceeds a threshold value (𝜒𝑦 𝜒𝑦 ∗<
207 𝜒𝑦), or if an orchard located at a distance below ζn (this radius defines a zone called
208 ‘neighbourhood’) has a contamination rate above a threshold χn (Fig. 1C).
209 Output variables. The model computes two output variables: the net present value
210 (NPV; in euros) of prunus cultivation, and the equivalent number of fully productive trees per
211 hectare and per year (Y). The former is used as an economic optimisation criterion in our
212 approach based on sensitivity analyses. Specifically designed for the present work, it is
213 computed from the first (am=6) to the last (af=35) year of sharka management. Considering
214 the whole production area as a single ‘farm' with all the benefits and costs associated with
215 prunus cultivation and sharka management, for year a (a=am,…, af) the gross margin (noted
216 GMa) of this ‘farm’ can be calculated as the benefit generated by fruit sales (p; in euros/ha),
217 minus fruit harvest costs (cH; in euros/ha), fixed cultivation costs (cF; in euros/ha), orchard
218 planting cost (cS; in euros/ha), orchard observation cost (cO; in euros/ha), and the cost of
219 removal of a tree (cRT; in euros) or a whole orchard (cR; in euros/ha). Reference values for
220 these economic parameters were estimated (supplementary Table S1) based on expert
221 opinions (i.e., professional organisations in charge of sharka management in France), as well
222 as data on French peach production (Agreste 2013, 2014, 2015), selling price (FranceAgriMer
223 2015), and consumer price index (INSEE 2015). The cost of one orchard observation (cO) is
224 described by a simple linear function of the detection probability: 𝑐𝑂= 40 + 182 × 𝜌. This
225 function is calibrated via expert opinions considering a fixed cost of access to the patch, and a
Version preprint
227 the effect of a partial surveillance of orchards (e.g., every other row only), which reduces both
228 the average detection probability ( ) and the observation cost. Thus, for all orchards i 𝜌
229 (𝑖 ∈ {1,…,𝐼}) of the production area during year a, GMa is calculated as follows:
230 𝐺𝑀𝑎= ∑ , 𝐼 𝑖 = 1
{
𝑦𝑖,𝑎.(𝑝 ― 𝑐𝐻). 𝑆𝑖,𝑎+ 𝐸𝑖,𝑎 𝑁𝑖,𝑎 .𝐴𝑖― 𝑐𝐹.𝐴𝑖― 𝟏 𝑅 𝑖,𝑎.𝑐𝑅.𝐴𝑖― 𝟏𝑆𝑖,𝑎.𝑐𝑆.𝐴𝑖― 𝑐𝑇𝑅.𝑅𝑖,𝑎+ ― 𝑐𝑜.𝑂𝑖,𝑎.𝐴𝑖}
231 with:232 yi,a the relative fruit yield of non-diseased trees depending on their age (see Table 1);
233 Ai the orchard area (ha);
234 𝑆𝑖,𝑎+ 𝐸𝑖,𝑎 the proportion of the orchard that is not impacted by the disease;
𝑁𝑖,𝑎
235 Oi,a the number of observations within the orchard;
236 R+
i,a the number of newly (individually) removed trees due to PPV detection;
237 𝟏𝑅𝑖,𝑎 a Boolean which equals 1 if the orchard is removed, and 0 otherwise;
238 𝟏𝑆𝑖,𝑎 a Boolean which equals 1 if the orchard is planted, and 0 otherwise.
239 Using a discount rate τa=4% (Quinet 2013), the net present value for the whole production
240 area over years am=6 to af=35 is:
241 𝑁𝑃𝑉 = ∑𝑎𝑓 .
𝑎 = 𝑎𝑚
𝐺𝑀𝑎
(1 + 𝜏𝑎)(𝑎 ― 𝑎𝑚)
242 The equivalent number of fully productive trees (Y) was used to assess the
243 epidemiological performance of management strategies that were economically improved
244 using the NPV. This criterion was defined previously (Rimbaud et al. 2018a) by:
245 𝑌 = 1 (𝑎𝑓― 𝑎𝑚+ 1)∑ 𝐼 𝑖 = 1𝐴𝑖 𝑎𝑓
∑
𝑎 = 𝑎𝑚 𝐼∑
𝑖 = 1{
𝑦𝑖,𝑎.(𝑆𝑖,𝑎+ 𝐸𝑖,𝑎)}
.Version preprint
246 In this criterion, fully productive trees (i.e., mature and healthy) count for 1, whereas diseased
247 and newly planted trees (juvenile) count for 0.
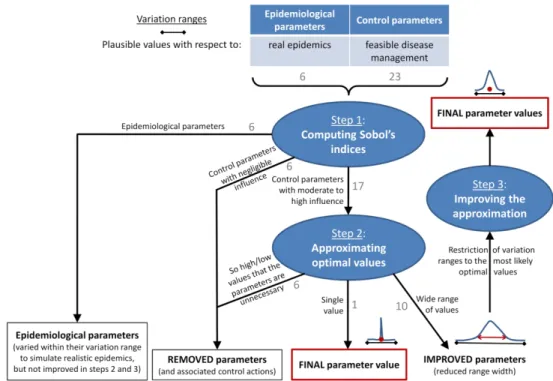
248 Management improvement through sequential sensitivity analyses
249 Improvement of the management strategy was performed using three sensitivity
250 analyses. For these analyses, we used Sobol’s method, which is a reference method to
251 compute sensitivity indices of model parameters and their interactions (Saltelli et al. 2008;
252 Sobol 1993). Each sensitivity analysis consists of: i) defining the target parameters, their
253 respective variation ranges and probability distributions (uniform, in this work); ii) generating
254 a design to explore the parameter space (using Sobol’s sequences in this work; see details in
255 Rimbaud et al. 2018a); iii) running simulations; and iv) computing Sobol’s sensitivity indices
256 which quantify the influence of the variation of each target parameter on the output variable.
257 Let Y denote the output variable, and Xi (i=1,…,p) the input parameters of the model. Sobol’s
258 indices are calculated for each Xi as follows:
259 𝑆𝐼𝑋𝑖 1 = 𝑉𝑎𝑟
[
𝐸(𝑌│𝑋𝑖)]
𝑉𝑎𝑟(𝑌) 260 𝑆𝐼𝑋𝑖 𝑡𝑜𝑡= 𝐸[
𝑉𝑎𝑟(𝑌│𝑋―𝑖)]
𝑉𝑎𝑟(𝑌)261 where X-i denotes the whole set of parameters except Xi. 𝑆𝐼𝑋1𝑖 is the 1st-order index, which
262 measures the main effect of Xialone; and 𝑆𝐼𝑋𝑡𝑜𝑡𝑖 is the total index, which measures the influence
263 of Xi including all its interactions with other parameters. These dimensionless indices are
264 bounded by 0 and 1, and a total index close to 0 means that the variation of the parameter
265 has a negligible effect on the output variable.
Version preprint
268 the focal zone (radius ζf), the observation epicentre (ζeO) and the removal epicentre (ζeR) are
269 contained within the security zone (ζs), the focal zone (ζf) and the removal zone (ζR),
270 respectively, these zones were re-parameterised using the following area ratios (bounded by
271 0 and 1): 272 𝑟𝜁𝑓= , , and . 𝜋 × 𝜁2 𝑓 𝜋 × 𝜁2𝑠=
(
𝜁𝑓 𝜁𝑠)
2 𝑟𝜁𝑒𝑂=(
𝜁𝑒𝑂 𝜁𝑓)
2 𝑟𝜁𝑒𝑅=(
𝜁𝑒𝑅 𝜁𝑅)
2273 In addition, the contamination threshold above which surveillance frequency in young
274 orchards is modified (𝜒𝑦 ∗), was re-parameterised using its ratio relative to the contamination
275 threshold above which replanting is forbidden ( ): 𝜒𝑦 𝑟𝜒𝑦 ∗ = .
𝜒𝑦 ∗
𝜒𝑦
276 Step 1: Assessing the relative influence of model parameters. The 23 control
277 parameters defined in the implemented management strategy were targeted in this first step,
278 in addition to 6 parameters associated with the main epidemiological processes (introduction:
279 qκ, Φ, and pMI; dispersal: Wexp; transmission coefficient: β; and latent period duration: θexp).
280 Except for qκ (connectivity of the patch of first introduction) and pMI (probability of massive
281 introduction), variation ranges of the epidemiological parameters were defined as the 99%
282 credibility intervals of the estimates provided by a Bayesian inference model applied to
PPV-283 M epidemics in southeastern France (Pleydell et al. 2018). In contrast, variation ranges of qκ,
284 pMI and the 23 control parameters were informed by expert opinions and restricted to realistic
285 values with respect to sharka epidemics and management (Table 1).
286 Simulations were performed for 310,155 different parameter combinations generated
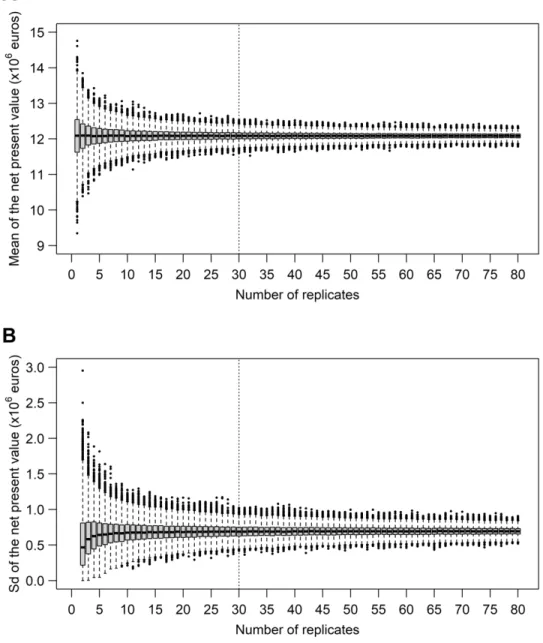
287 with Sobol sequences (Sobol 1976). To account for stochasticity (see, e.g., Rimbaud et al.
288 2018a), each combination was replicated 30 times (this number, above which the total
289 computational time would be prohibitive, was sufficient to obtain robust estimates of the
Version preprint
291 Then, the indices were calculated as in (Rimbaud et al. 2018a) to assess the influence of target
292 parameters on the means and standard deviations of the economic (μNPV and σNPV) and
293 epidemiological (μY and σY) criteria.
294 Step 2: Approximating optimal values of the most influential parameters. In the second
295 step, only the most influential control parameters (i.e., those with the highest SItot) identified
296 in the first step were retained (see Results). The 6 least influential control parameters were
297 removed from the model, and the 17 remaining parameters were varied within the same
298 variation ranges as previously (Table 1), using 310,156 different parameter combinations and
299 30 stochastic replicates. In this sensitivity analysis, the 6 epidemiological parameters were not
300 targeted, but for each simulation they were drawn from uniform distributions using the same
301 bounds as in the previous step, in order to optimise the management strategy for variable
302 (but realistic) epidemics.
303 The optimal values of the 17 control parameters were jointly approximated by
304 identifying the parameter combination associated with the highest μNPV (‘best-value
305 strategy’). To identify alternative improved strategies, a marginal approximation of the same
306 parameters was also performed, using the mode of the distribution of each parameter within
307 the combinations associated with the best 1% values of μNPV (‘best-percent strategy’). A similar
308 approach allowed identification of the parameters associated with the worst 1% values of
309 μNPV. The marginal approximation (performed parameter by parameter) does not account for
310 possible interactions between parameters, contrary to the first method that retains a whole
311 parameter combination.
312 Step 3: Improving the approximate optimal values. Based on the results of the previous
313 step, six control parameters were found unnecessary (see Results) and subsequently removed
Version preprint
315 NPVs, and was thus fixed at this value. The optimal values of the 10 remaining control
316 parameters were still very imprecise; thus, these 10 parameters were further improved using
317 a dedicated sensitivity analysis with variation ranges restricted to the intervals where most of
318 the best 1% values of μNPV were found in step 2 (Table 1). This sensitivity analysis was
319 performed as in previous steps, using 310,152 different parameter combinations and 30
320 replicates. For each simulated epidemic, the epidemiological parameters were drawn from
321 uniform distributions as in step 2.
322 Simulation of the improved management strategies
323 To test the performance of the identified management strategies, 10,000 simulation
324 replicates were performed with parameters corresponding to different scenarios: (A)
325 “Disease-free” (PPV is not introduced in the landscape); (B) “Management-free” (PPV is
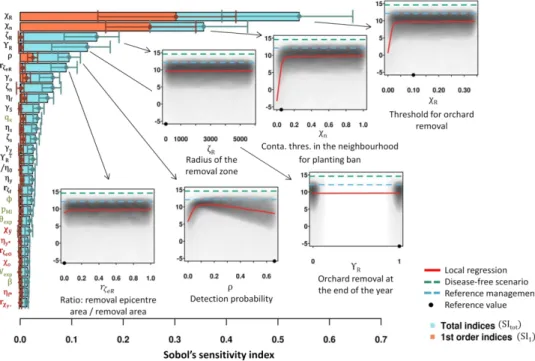
326 introduced and not managed); (C) “Reference management” (PPV is introduced and managed
327 according to the current French strategy; Table 1); (D) value strategy” and (E)
“best-328 percent strategy” (Table 2). In scenarios B to E, the six epidemiological parameters were drawn
329 from uniform distributions within their respective variation ranges (Table 1). The impact of
330 the epidemic was assessed using the distribution of the epidemiological criterion (Y), the
331 economic criterion (NPV), as well as the dynamics of annual prevalence and incidence, and
332 the dynamics of observations and removals.
333 Furthermore, the robustness of the identified management strategies to harsher
334 epidemic contexts was tested using similar simulations with either doubled values for the
335 pathogen transmission coefficient (β) or halved values for the latent period duration (θexp).
336 New strategies, specifically improved for each context, were identified by following the three
Version preprint
338 Computing tools
339 The model was written in R and C languages; one simulation takes around 8 s on an
340 Intel® Core™ i7-4600M computer. Within the R software v3.0.3 (R Core Team 2012), Sobol’s
341 sequences were generated and Sobol’s indices were calculated using the packages fOptions
342 v3010.83 (Wuertz et al. 2017) and sensitivity v1.11 (Pujol et al. 2017), respectively.
343
RESULTS
344 We identified improved management strategies of sharka epidemics in three steps,
345 each of them consisting of a sensitivity analysis of a model which jointly simulates sharka
346 epidemics and a flexible management strategy (see supplementary Fig. S2 for a general
347 illustration).
348 Step 1: Identifying the most promising control parameters.
349 In a first step, the most promising control measures to manage sharka were identified
350 by ranking the control parameters by influence on the economic criterion (average net present
351 value over 30 years, μNPV, measuring the discounted difference between benefits of fruit sales
352 and costs generated by the management of all orchards of the production area). The first
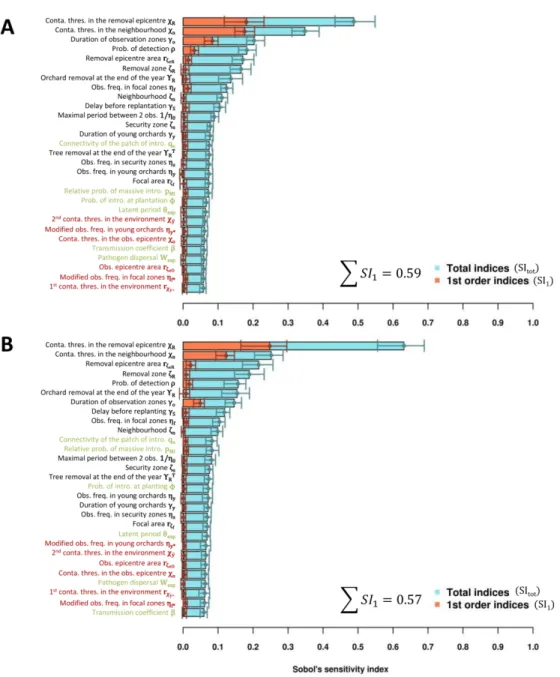
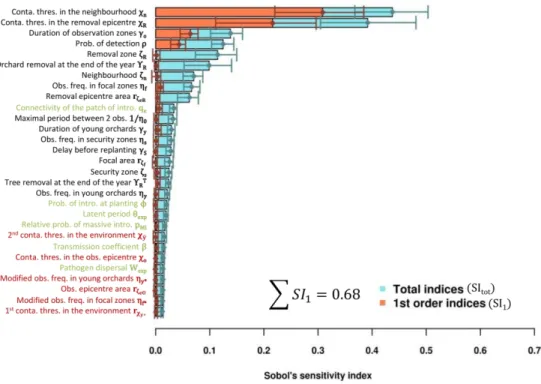
353 sensitivity analysis showed that the predicted economic impact strongly depends (positively;
354 see Fig. 2) on the contamination threshold of the ‘removal epicentre’ (χR, above which
355 orchards in the removal zone are culled; total sensitivity index, SItot: 0.54; CI95: 0.39-0.65), and 356 on the contamination threshold in orchards of the neighbourhood of a previously culled
357 orchard (χn, above which replanting is forbidden; SItot: 0.36; CI95: 0.25-0.45). These parameters 358 were also the main contributors to model stochasticity (supplementary Fig. S3). Next comes
Version preprint
360 indicating whether whole orchards are removed immediately or at the end of the year (ΥR;
361 SItot: 0.13, CI95: 0.06-0.18), followed by the detection probability (ρ; SItot: 0.09; CI95: 0.07-0.12) 362 and the size of the removal epicentre–where the contamination rate is measured to assess if
363 orchards in the removal zone (with a radius ζR) must be culled (𝑟𝜁𝑒𝑅; SItot: 0.09; CI95: 0.05-0.12) 364 (Fig. 2). The effect of each of these parameters seems to be mostly due to interactions with
365 other parameters, since their total Sobol indices were much higher than their 1st-order indices. 366 The importance of these interactions explains why it is difficult to predict the net present value
367 (NPV) from the values of ζR, ΥR or 𝑟𝜁𝑒𝑅 alone (Fig. 2, insets). The strong impact of removal and
368 planting measures on the mean NPV (μNPV) is likely due to excessive tree removals or orchard
369 planting bans when the respective contamination thresholds are low (below 5% for removals
370 and below 10% for planting bans; Fig. 2, insets). However, for higher thresholds, μNPV remained
371 stable, suggesting that these parameters no longer have an effect. This may be the sign of the
372 absence (or rarity) of high contamination events in orchards or in removal epicentres (and
373 thus of extremely rare planting bans or removal of whole zones). Finally, the quadratic effect
374 of ρ reveals the existence of a trade-off between detection efficiency and the costs induced
375 by orchard surveillance.
376 The 11 least influential parameters (5 epidemiological parameters and 6 control
377 parameters) had very low total sensitivity indices (less than 0.03), which indicates a negligible
378 effect of their variation on the mean output. These 11 parameters included all epidemiological
379 parameters except the connectivity of the patch of first pathogen introduction (qκ). This
380 suggests that, in the simulated context, the economic impact of epidemics depends more on
381 control actions than on the epidemics themselves (except for the location of the first PPV
382 introduction). Nevertheless, some control actions (those governed by the 6 least influential
Version preprint
384 actions relate to the reinforcement of visual surveillance in locally highly contaminated areas
385 (𝑟𝜁𝑒𝑂, χO and ηf*) or in young orchards (𝑟𝜒𝑦 ∗ and ηy*), or to planting bans after orchard removals
386 ( ). The negligible influence of these control actions can be attributed to the fact that in the 𝜒𝑦 387 simulations, the level of local contamination never reached the thresholds for surveillance
388 reinforcement or planting ban. Similar conclusions emerged from the analysis of the
389 epidemiological output of the model (number of fully productive trees per hectare and per
390 year, μY; supplementary Fig. S4). Consequently, the 6 least influential control parameters were
391 removed in the next step in order to more efficiently improve sharka management strategy.
392 Step 2: Approximating optimal values of control parameters
393 A second sensitivity analysis was performed on the control parameters only (except for
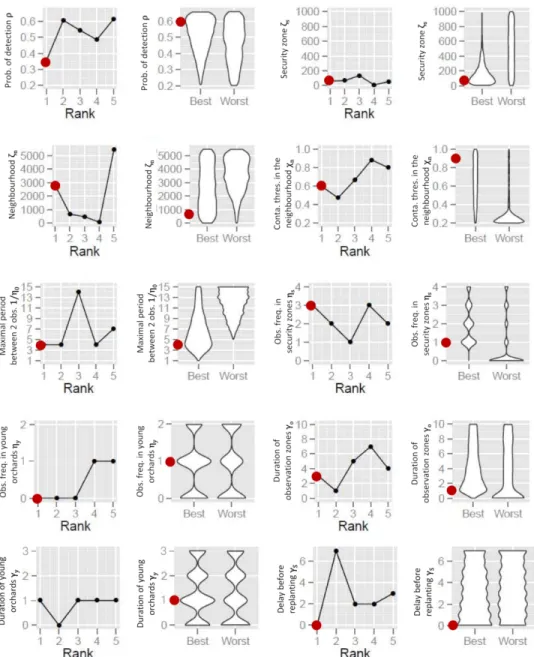
394 the 6 control parameters discarded in step 1). Optimal values of the 17 control parameters
395 were approximated either by the parameter combination leading to the best μNPV (‘best-value
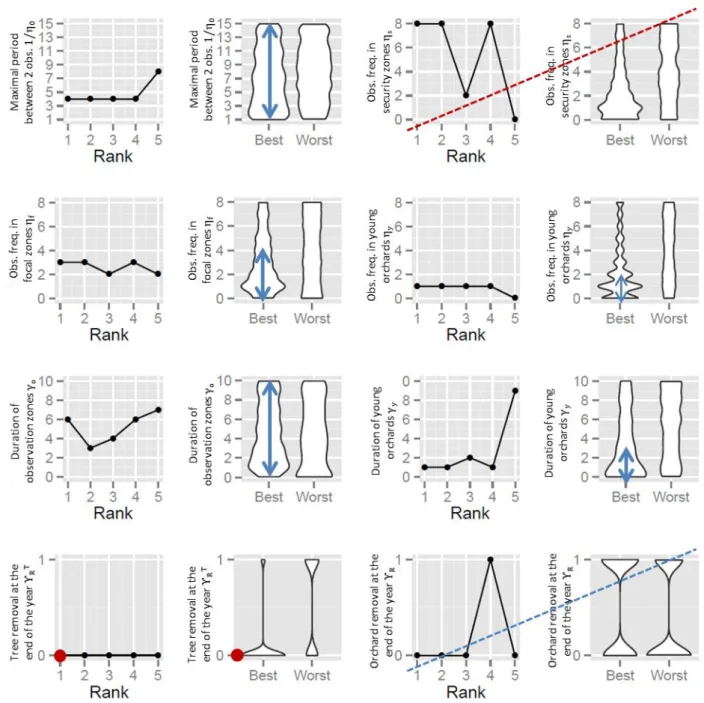
396 strategy’), or the respective modes of the parameter distributions leading to the highest
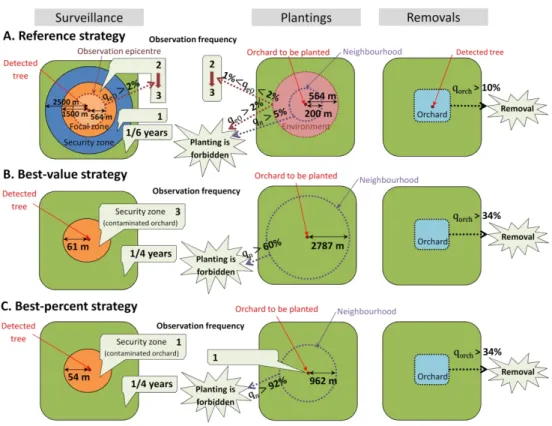
397 percentile of μNPV (‘best-percent strategy’). In both approaches, management is improved
398 when detected trees are removed immediately (i.e., after an average of 10 days, rather than
399 at the end of the year; see ΥRT in Fig. 3). The obtained values for the removal threshold (χR,
400 mostly above 5%), the radius of the removal zone (ζR, mostly above 1000 m), and its epicentre
401 where the contamination rate is measured (𝑟𝜁𝑒𝑅, mostly above 0.1), were so high that no
402 removal of whole orchards may occur in the associated simulations (see χR in Fig. 3 and all
403 other parameters in supplementary Fig. S5). In addition, small values for these parameters
404 (χR < 5%; ζR < 2 km; 𝑟𝜁𝑒𝑅< 0.2) were associated with the lowest percentile of μNPV. These results
405 suggest that in our model, the removal of healthy hosts induces higher costs than the
Version preprint
407 area matched approximately the security area ( and 𝑟𝜁𝑓 ζs in the ‘best-value strategy’), or
408 surveillance frequencies in these zones were the same (ηf and ηs in the ‘best-percent
409 strategy’). This indicates that it may not be necessary to distinguish between focal and security
410 zones. Thus, parameters associated with removal zones (χR, ζR, 𝑟𝜁𝑒𝑅 andΥR), and focal zones (
411 𝑟𝜁𝑓 and ηf) were discarded in the next step.
412 Step 3: Improving the approximation
413 A third sensitivity analysis was performed on the 10 remaining control parameters to
414 further refine the approximation of their optimal value. In this analysis, variation ranges of the
415 target parameters were restricted to the intervals where most of the best 1% values of μNPV
416 were found in the previous step (see the probability of detection ρ in Fig. 3 and all other
417 parameters in supplementary Fig. S5). Then, optimal values were approximated as in step 2
418 (Fig. 3 and supplementary Fig. S6). The resulting ‘best-value’ and ‘best-percent’ strategies are
419 significantly more cost-effective and simpler than the current French strategy (Fig. 4). To
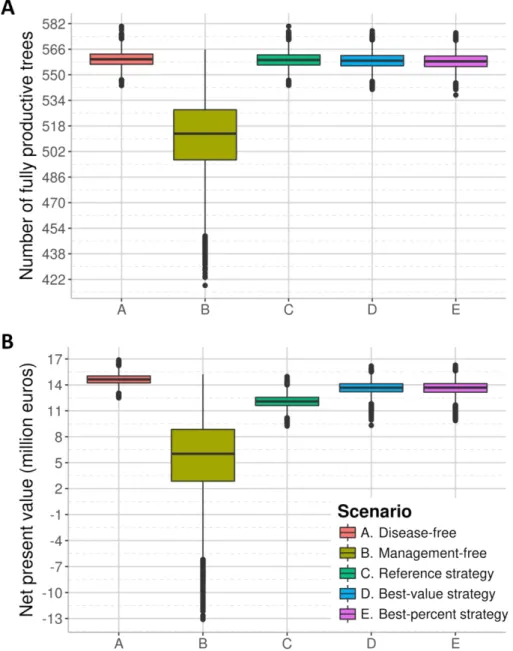
420 summarise the best-value strategy, every time a symptomatic tree is detected in an orchard,
421 this orchard is visually surveyed three times a year for the three following years (Table 2,
422 reference epidemic context). Whole orchards are removed only if the proportion of living trees
423 falls below χSEHD=0.66 (for profitability reasons, see Materials and Methods, and
424 supplementary Table S1), and in this case orchards can be replanted without delay.
425 Nevertheless, replanting is forbidden if the contamination rate of an orchard exceeds 60%
426 within a radius of 2.8 km (i.e., in case of a massive introduction, in our simulations). In areas
427 where no infected tree has been detected in the three previous years, orchards are surveyed
428 once every four years. The detection probability is 36%, i.e., nearly half the reference value
Version preprint
430 Alternatively, in the best-percent strategy (Table 2), each time a symptomatic tree is
431 detected, the corresponding orchard is surveyed once in the following year. Similar to the
432 best-value strategy, whole orchards may only be removed for profitability reasons, and can
433 be replanted without delay (except in the unlikely event of a contamination rate higher than
434 92% in an orchard within a radius of 962 m). In the first year after planting, young orchards
435 are surveyed once. Older orchards in non-contaminated areas are routinely surveyed every
436 four years. The detection probability is 60% (i.e., close to the reference value).
437 Simulation of the improved strategies
438 Repeated stochastic simulations were carried out with the identified improved
439 strategies in order to compare their epidemiological (Y) and economic (NPV) outcomes with
440 those obtained in disease-free and management-free scenarios, and with the reference
441 management (i.e., the current strategy for managing sharka in France). First, these simulations
442 show that managing the disease is vital, since the median number of productive trees per
443 hectare and per year in the management-free scenario is only 513 and is highly variable [2.5%;
444 97.5% quantiles: 462; 551] compared to the disease-free scenario (median number of 560
445 trees [551; 569]) (Fig. 5a). This results in a 59% decrease in the median NPV (6.03 million euros
446 [-4.06; 13.0] in the absence of management, vs 14.6 million euros [13.5; 15.7] in the absence
447 of disease), and possibly huge economic losses in the worst-case scenarios (Fig. 5B). In our
448 model, the reference strategy is very efficient to reduce the epidemiological impact of sharka
449 (median of 559 productive trees per ha and per year [550; 569]). The associated NPV (12.1
450 million euros [10.7; 13.4]) is much higher than in the absence of management; however, it is
451 17% lower than in the disease-free scenario, indicating considerable costs of disease
Version preprint
453 the reference strategy with regard to the number of productive trees, but resulted in reduced
454 costs, with a median NPV of 13.7 [12.2; 15.0] and 13.7 [11.7; 15.0] million euros, respectively.
455 These management strategies are associated with slightly higher disease incidence and
456 prevalence than for the current French strategy (supplementary Fig. S7, top row). The
457 resulting increase in individual tree removal is overly compensated by the smaller number of
458 observations in orchards (supplementary Fig. S8, top row). Consequently, both improved
459 strategies are more cost-effective than the reference strategy.
460 When tested in harsher epidemiological contexts with halved expected duration of the
461 latent period of the pathogen (θexp), the identified management strategies were still efficient
462 with respect to both the epidemiological (Y) and economic (NPV) criteria (supplementary Fig.
463 S9, panels A and B). However, with doubled transmission coefficient (β), the improved
464 management strategies (in particular the best-percent strategy) were not as efficient as in the
465 reference scenario (supplementary Fig. S9, panels C and D). This resulted in higher levels of
466 disease prevalence and incidence (supplementary Fig. S7, bottom row) and consequently
467 more tree removals (supplementary Fig. S8, bottom row). In contrast, the reference
468 management strategy was robust to the simulated changes in epidemic severity
469 (supplementary Figs. S7, S8 and S9).
470 To specifically improve the management strategy in harsher epidemic contexts, we
471 followed again all the steps of the proposed approach. With a shorter latent period of the
472 pathogen, the newly identified strategies mainly differ from the previous ones by the
473 introduction of a 1-year delay before orchard replanting. This delay, which matches the mean
474 duration of the latent period (θexp=0.96 year in this scenario), enables the removal of infected
475 trees in the neighbourhood before planting a new orchard (Table 2). With stronger
Version preprint
477 the ‘best-value’ strategy, which relies on a 3-year delay before replanting, and strengthened
478 surveillance frequencies: all orchards are surveyed every year, and those located in security
479 zones are surveyed 7 times a year (Table 2). These measures allow disease suppression despite
480 its faster expansion. As shown with the repeated simulations in harsh epidemic contexts,
481 these new strategies satisfy both epidemiological and economic performance criteria
482 (supplementary Figs. S10 and S11).
483
DISCUSSION
484 A method to improve management strategies of epidemics
485 In this article, we propose an innovative heuristic approach based on the sequential use
486 of global sensitivity analysis of a simulation model to improve strategies for the management
487 of plant disease epidemics. Although parameter ranges might have been restricted to likely
488 values using formal (Bayesian) elicitation of expert’s opinion, we chose to start from the
489 widest meaningful ranges and narrow them down at each step of the procedure. Following
490 the identification of the most promising control measures (step 1), the exploration of
491 parameter space, initially large (step 2) and then more restricted (step 3), enables to simplify
492 the strategy and to progressively improve the control parameters (supplementary Fig. S2).
493 This method is based on the identification of the best strategies among a finite set of
494 simulations. Consequently, the identified strategies are only approximately optimal, despite
495 the wide range of explored scenarios (further sensitivity analyses could be performed if more
496 accuracy was required for some parameters). Nevertheless, in contrast with previous studies
497 focussing on a restricted number of control parameters (e.g., Cunniffe et al. 2015;
Hyatt-498 Twynam et al. 2017; Parnell et al. 2010), our approach includes a wide range of management
Version preprint
500 of improved control parameters were identified using two different approaches (‘best-value’
501 and ‘best-percent’) resulting in two specific options to improve the reference management
502 strategy (Fig. 4, panels B and C). Alternatively, it could be possible to extract, from the
503 sensitivity analyses, whole distributions of parameter values leading to the best percentile of
504 μNPV (supplementary Fig. S6). While this method would not account for potential interactions
505 between parameters, it would inform on the degree of precision required on each control
506 parameter to apply the management strategy.
507 Balancing costs and benefits of disease management
508 The selection of a relevant criterion is a crucial task in an optimisation procedure.
509 Epidemiological criteria that have been minimised for management optimisation include
510 disease incidence (Breukers et al. 2007; Holt et al. 1999; Xu and Ridout 1998), prevalence
511 (Courcoul et al. 2011; Lurette et al. 2009), severity (Xu and Ridout 1998), propagation rate
512 (Coutts et al. 2011; Filipe et al. 2012), basic reproduction number (Chan and Jeger 1994),
513 proportion of infected plants at the end of the simulation (Sisterson and Stenger 2013),
514 probability of pathogen establishment (Papaïx et al. 2014), time until eradication (Barclay and
515 Vreysen 2011; Courcoul et al. 2011; Jeger and Chan 1995; Parnell et al. 2009, 2010), or
516 proportion/number of removed trees required to achieve eradication (Hyatt-Twynam et al.
517 2017; Parnell et al. 2009). However, to be feasible and sustainable, the choice of a
518 management strategy must be guided by the balance between the costs induced by control
519 actions and the economic benefits of the reduction of epidemic damage (Forster and Gilligan
520 2007; Fraser et al. 2004). Some studies proposed approaches to prioritise surveillance or
521 removal options under limited resources (Cunniffe et al. 2016; Faulkner et al. 2016; Ndeffo
Version preprint
523 animal and human diseases accounting for the cost of management (e.g., surveillance and
524 removal, culling, vaccination) relative to the intrinsic cost of the epidemic or the benefit of
525 maintaining a healthy population (Cunniffe et al. 2014; Forster and Gilligan 2007; Kleczkowski
526 et al. 2012; Thompson et al. 2018). Here, we used an economic criterion, the net present value
527 (NPV), which explicitly accounts for the benefits (i.e., fruit sales) generated by the cultivation
528 of productive hosts, and the costs induced by orchard cultivation plus different control actions
529 comprising surveillance, removal, replanting, and planting bans. By doing so, the different
530 components of the management strategy can be optimised with explicit consideration of their
531 cost relative to the benefit due to the reduction of epidemic damage. In addition, the inclusion
532 of a discount rate—a key element in project financial evaluation—accounts for the time value
533 of money, i.e., the fact that the same income has less value in the future than in the present.
534 For these reasons, the NPV is a powerful criterion to identify cost-effective strategies for the
535 management of epidemics. Although this criterion was specifically parameterised for peach
536 orchards in this work, it could easily be employed for other crops by reassessing the costs and
537 benefits associated with their management. Finally, we also used an epidemiological criterion
538 to assess the epidemiological efficiency of the identified improved strategies. This metric
539 integrated the number of productive hosts across the whole production area and the whole
540 simulation period, and is therefore comparable to the ‘healthy area duration’ used in many
541 epidemiological models (e.g., Lo Iacono et al. 2013; Papaïx et al. 2018; Rimbaud et al. 2018b).
542 By using this metric, we aimed to maximise the number of productive hosts rather than to
543 minimise the number of infected hosts, because the latter option does not penalise the
544 removal of whole orchards and their replacement by young (non-productive) trees.
Version preprint
546 Identifying promising control measures. Based on Sobol’s indices, the first sensitivity
547 analysis highlighted the most influential control parameters on sharka epidemics in French
548 peach orchards. These were associated with orchard removals, planting bans, and detection
549 probability (Fig. 2). Although Sobol’s method only indicates the relative influence of the
550 parameters and not the direction of change in the output variable, it can be complemented
551 by graphical methods or metamodels (Rimbaud et al. 2018a). Here, the smoothed curves
552 showed the existence of an optimal detection probability, and a positive correlation between
553 the NPV and the threshold values for removal and planting bans (Fig. 2, insets). These
554 elements highlight the importance of modelling studies designed to optimise detection
555 efficiency (e.g., using hierarchical sampling; Hughes et al. 1997) and removal actions (e.g., by
556 identifying an optimal cull radius; Cunniffe et al. 2015, 2016; Parnell et al. 2009, 2010).
557 Ranking model parameters by their influence on a given output variable also allows the
558 identification of weak contributors. Among the implemented control parameters, those
559 associated with the modification of surveillance in response to the observed local prevalence
560 had a negligible impact on both epidemiological and economic outcomes (Fig. 2). Therefore,
561 in the investigated scenarios, reinforcing surveillance in highly contaminated areas may not
562 result in improved management. Thus, the associated parameters may be discarded from the
563 modelled management strategy without altering its efficiency. However, we assumed that
564 each symptomatic tree had the same detection probability, regardless of its age, cultivar and
565 time elapsed since symptom expression. Nevertheless, field experience shows that all these
566 factors impact symptom expression and consequently visual detection. Moreover, detection
567 events were considered independent, which enabled an excellent global detection rate after
Version preprint
569 in highly contaminated areas had a negligible impact in our analysis, but might be useful in the
570 field.
571 In previous studies, the connectivity of the patch of first introduction was the most
572 influential epidemiological parameter on sharka spread in the absence of management
573 (Rimbaud et al. 2018a). It is still the case here, in the presence of management (Fig. 2,
574 parameter qκ). This result suggests that reinforced baseline surveillance of highly connected
575 patches could be a promising control measure. This result also supports the need to match
576 management efforts with the risk index of different patches (Barnes et al. 1999; Nelson et al.
577 1994; Parnell et al. 2014) or individual hosts (Hyatt-Twynam et al. 2017) and to prioritise such
578 management under limited resources (Cunniffe et al. 2016; Faulkner et al. 2016). Favouring
579 the planting of resistant cultivars (provided that they are available) in patches with high risk
580 indices could also be a promising approach for disease management.
581 Identifying improved strategies. Our results suggest that removing whole orchards
582 triggers higher costs than potential losses associated with maintaining undetected hosts (i.e.,
583 infectious trees in state H). The identified improved strategies (targeting a cost-effective
584 management rather than eradication) are thus based on a ‘symptomatic hosts hunt’ (Fig. 4,
585 panels B and C). However, orchard surveillance to identify these symptomatic hosts also
586 induces high costs. Thus, in contaminated orchards, improved strategies relied either on few
587 surveillance rounds with a good probability of detection (close to the reference value), or a
588 greater number of surveillance rounds with a low probability of detection (half the reference
589 value, which may correspond to the surveillance of only every other row in the orchard to
590 reduce the cost of a surveillance round). Overall, while surveying an orchard more than once
591 a year multiplies the costs, it favours the detection of infected trees which may remain
Version preprint
593 potential of alternative detection protocols, like serological or molecular methods, which are
594 used for the management of several perennial plant epidemics (including sharka in the United
595 States; Gougherty et al. 2015). Such investigation may be performed with our model by
596 changing the relationship between the probability of detection and the cost of surveillance.
597 Our results indicate that the current French management of sharka should already be
598 very efficient in controlling the disease (Fig. 5A); consequently, no major improvement should
599 be expected with respect to the epidemiological criterion. In contrast, the economic criterion
600 shows that the French strategy is associated with substantial costs (Fig. 5B). We identified
601 improved strategies, which should be epidemiologically as efficient as the current French
602 strategy but less expensive–and also simpler and hence easier to implement in the field. These
603 strategies are based on simplified surveillance procedures, and on the absence of removal
604 zones (Fig. 4). Nevertheless, the default surveillance frequency (for orchards located outside
605 of focal and security zones) is increased to once every 4 (instead of 6) years. This change
606 enables to remove newly introduced infectious trees more promptly after the end of the
607 latent period, which was shown to decrease the overall management costs (Cunniffe et al.
608 2016).
609 Several assumptions may influence the improved strategies identified here. In
610 particular, the ability to detect symptomatic hosts may have been overestimated as explained
611 above, which should result in practice in a slight under-control. Consequently, in the field and
612 under certain conditions, it might still be interesting to rogue whole orchards in order to
613 remove hard-to-detect diseased trees. Furthermore, we assumed that all orchards had the
Version preprint
615 (Astier et al. 2007). Thus, our results may underestimate the importance of surveying young
616 orchards.
617 Despite these considerations, the best-value and best-percent strategies deserve to be
618 considered in order to improve the cost-efficiency of sharka management. The common
619 feature of these options is a simplification of surveillance and removal measures that reduces
620 management costs while maintaining good epidemiological performance. However, our
621 results show that these strategies may fail to control disease in harsh epidemic contexts. For
622 these situations, the flexibility of our approach allowed us to identify new strategies,
623 illustrating its general ability to find improved combinations of control parameters in a given
624 epidemic context. Furthermore, such strategies are relevant to the other (perennial) plant
625 diseases that are managed through surveillance, removals and planting restrictions. We note,
626 however, that some control actions (for which we had no cost/benefit values) were not
627 investigated in this work, like nursery protection measures, planting at different densities, or
628 the use of resistant prunus trees. In addition, vector control by insecticides was not studied
629 here because insecticides generally fail to control the spread of non-persistent viruses such as
630 PPV (Perring et al. 1999; Rimbaud et al. 2015).
631
FUNDING
632 LR was supported by a DGA-MRIS scholarship, and this work was partly funded by the
633 EU (SharCo project, FP7 programme) and FranceAgriMer (Sharka project).
634
ACKNOWLEDGEMENTS
635 The authors thank G. Labonne and S. Grizard for constructing the surveillance database,
Version preprint
637 Pleydell for programming the first version of the model, P.H. Thrall for reviewing a previous
638 version of this manuscript, the reviewers and Editor for their valuable comments, the INRA
639 BioSP and the CIRAD SouthGreen bioinformatics platforms and L. Houde and S. Ravel for
640 providing support.
641
LITERATURE CITED
642 Agreste. 2013. Infos rapides - Fruits - Pêches. Report n°5. url:
643 http://www.agreste.agriculture.gouv.fr/IMG/pdf/conjinfofru201309pech.pdf.
644 Agreste. 2014. Infos rapides - Fruits - Pêches. Report n°5. url:
645 http://www.agreste.agriculture.gouv.fr/IMG/pdf/conjinfofru201409pech.pdf.
646 Agreste. 2015. Infos rapides - Fruits - Pêches. Report n°2. url:
647 http://www.agreste.agriculture.gouv.fr/IMG/pdf/conjinfofru201506pech.pdf.
648 Astier, S., Albouy, J., Maury, Y., Robaglia, C., and Lecoq, H. 2007. Principles of Plant Virology.
649 Science Publishers, Enfield, NH.
650 Barclay, H. J., and Vreysen, M. J. B. 2011. A dynamic population model for tsetse (Diptera:
651 Glossinidae) area-wide integrated pest management. Popul. Ecol. 53:89-110.
652 Barnes, J. M., Trinidad-Correa, R., Orum, T. V., Felix-Gastelum, R., and Nelson, M. R. 1999.
653 Landscape ecology as a new infrastructure for improved management of plant
654 viruses and their insect vectors in agroecosystems. Ecosyst. Health 5:26-35.
655 Breukers, A., van der Werf, W., Kleijnen, J. P. C., Mourits, M., and Lansink, A. O. 2007.
Cost-656 effective control of a quarantine disease: A quantitative exploration using “design of
657 experiments” methodology and bio-economic modeling. Phytopathology 97:945-957.
658 Cambra, M., Capote, N., Myrta, A., and Llácer, G. 2006. Plum pox virus and the estimated
Version preprint
660 Chan, M. S., and Jeger, M. J. 1994. An analytical model of plant virus disease dynamics with
661 roguing and replanting. J. Appl. Ecol. 31:413-427.
662 Courcoul, A., Monod, H., Nielen, M., Klinkenberg, D., Hogerwerf, L., Beaudeau, F., and Vergu,
663 E. 2011. Modelling the effect of heterogeneity of shedding on the within herd
664 Coxiella burnetii spread and identification of key parameters by sensitivity analysis. J.
665 Theor. Biol. 284:130-141.
666 Coutts, S. R., van Klinken, R. D., Yokomizo, H., and Buckley, Y. M. 2011. What are the key
667 drivers of spread in invasive plants: dispersal, demography or landscape: and how
668 can we use this knowledge to aid management? Biol. Invasions 13:1649-1661.
669 Cunniffe, N. J., Cobb, R. C., Meentemeyer, R. K., Rizzo, D. M., and Gilligan, C. A. 2016.
670 Modeling when, where, and how to manage a forest epidemic, motivated by sudden
671 oak death in California. Proc. Natl. Acad. Sci. U.S.A. 113:5640-5645.
672 Cunniffe, N. J., Laranjeira, F. F., Neri, F. M., DeSimone, R. E., and Gilligan, C. A. 2014.
Cost-673 effective control of plant disease when epidemiological knowledge is incomplete:
674 modelling bahia bark scaling of citrus. PLoS Comput. Biol. 10:e1003753.
675 Cunniffe, N. J., Stutt, R. O. J. H., DeSimone, R. E., Gottwald, T. R., and Gilligan, C. A. 2015.
676 Optimising and communicating options for the control of invasive plant disease when
677 there is epidemiological uncertainty. PLoS Comput. Biol. 11:e1004211.
678 Dallot, S., Gottwald, T., Labonne, G., and Quiot, J.-B. 2003. Spatial pattern analysis of sharka
679 disease (Plum pox virus strain M) in peach orchards of southern France.
680 Phytopathology 93:1543-52.
681 Faulkner, K. T., Robertson, M. P., Rouget, M., and Wilson, J. R. U. 2016. Border control for
682 stowaway alien species should be prioritised based on variations in establishment
Version preprint
684 Filipe, J. A. N., Cobb, R. C., Meentemeyer, R. K., Lee, C. A., Valachovic, Y. S., Cook, A. R., Rizzo,
685 D. M., and Gilligan, C. A. 2012. Landscape epidemiology and control of pathogens
686 with cryptic and long-distance dispersal: sudden oak death in northern Californian
687 forests. PLoS Comput. Biol. 8:e1002328.
688 Forster, G. A., and Gilligan, C. A. 2007. Optimizing the control of disease infestations at the
689 landscape scale. Proc. Natl. Acad. Sci. U.S.A. 104:4984-4989.
690 FranceAgriMer. 2015. Observatoire de la formation des prix et des marges des produits
691 alimentaires - Prix à l'expédition et au détail en GMS de la pêche et de la nectarine
692 (web page). url:
https://observatoire-693 prixmarges.franceagrimer.fr/resultats/Pages/ResultatsFilieres.aspx?idfiliere=4&sous
694 menuid=83&type=Tableau.
695 Fraser, C., Riley, S., Anderson, R. M., and Ferguson, N. M. 2004. Factors that make an
696 infectious disease outbreak controllable. Proc. Natl. Acad. Sci. U.S.A. 101:6146-6151.
697 Gottwald, T. R., Wierenga, E., Luo, W. Q., and Parnell, S. 2013. Epidemiology of Plum pox 'D'
698 strain in Canada and the USA. Can. J. Plant Pathol. 35:442-457.
699 Gougherty, A. V., Pazdernik, K. T., Kaiser, M. S., and Nutter, F. W. 2015. Evaluation of
700 sampling and testing efficiencies of Plum pox virus eradication programs in
701 Pennsylvania and Ontario. Plant Dis. 99:1247-1253.
702 Holt, J., Colvin, J., and Muniyappa, V. 1999. Identifying control strategies for tomato leaf curl
703 virus disease using an epidemiological model. J. Appl. Ecol. 36:625-633.
704 Hughes, G., McRoberts, N., Madden, L. V., and Gottwald, T. R. 1997. Relationships between
Version preprint
706 Hyatt-Twynam, S. R., Parnell, S., Stutt, R. O. J. H., Gottwald, T. R., Gilligan, C. A., and Cunniffe,
707 N. J. 2017. Risk-based management of invading plant disease. New Phytol.
214:1317-708 1329.
709 INSEE. 2015. Indice des prix à la consommation - Secteurs conjoncturels (mensuel, ensemble
710 des ménages, métropole + DOM, base 1998) - Ensemble hors tabac (web page). url:
711 http://www.insee.fr/fr/bases-de-donnees/bsweb/serie.asp?idbank=000641194.
712 Jeger, M. J., and Chan, M. S. 1995. Theoretical aspects of epidemics: uses of analytical
713 models to make strategic management decisions. Can. J. Plant Pathol. 17:109-114.
714 Jeger, M. J., Madden, L. V., and van den Bosch, F. 2018. Plant virus epidemiology:
715 Applications and prospects for mathematical modeling and analysis to improve
716 understanding and disease control. Plant Dis. 102:837-854.
717 JORF. 2011. Arrêté du 17 mars 2011 relatif à la lutte contre le Pum Pox Virus, agent causal de
718 la maladie de la Sharka, sur les végétaux sensibles du genre Prunus. JORF n°0067 du
719 20 mars 2011, NOR: AGRG1105295A. url:
720 http://www.legifrance.gouv.fr/affichTexte.do?cidTexte=JORFTEXT000023728913&da
721 teTexte=&categorieLien=id.
722 Kleczkowski, A., Oleś, K., Gudowska-Nowak, E., and Gilligan, C. A. 2012. Searching for the
723 most cost-effective strategy for controlling epidemics spreading on regular and
small-724 world networks. J. R. Soc. Interface 9:158-169.
725 Labonne, G., Yvon, M., Quiot, J.-B., Avinent, L., and Llácer, G. 1995. Aphids as potential
726 vectors of Plum pox virus: comparison of methods of testing and epidemiological
Version preprint
728 Lo Iacono, G., van den Bosch, F., and Gilligan, C. A. 2013. Durable resistance to crop
729 pathogens: An epidemiological framework to predict risk under uncertainty. PLoS
730 Comput. Biol. 9:e1002870.
731 Lurette, A., Touzeau, S., Lamboni, M., and Monod, H. 2009. Sensitivity analysis to identify key
732 parameters influencing Salmonella infection dynamics in a pig batch. J. Theor. Biol.
733 258:43-52.
734 Ndeffo Mbah, M. L., and Gilligan, C. A. 2010. Optimization of control strategies for epidemics
735 in heterogeneous populations with symmetric and asymmetric transmission. J. Theor.
736 Biol. 262:757-763.
737 Nelson, M. R., Felix-Gastelum, R., Orum, T. V., Stowell, L. J., and Myers, D. E. 1994.
738 Geographic information systems and geostatistics in the design and validation of
739 regional plant virus management programs. Phytopathology 94:898-905.
740 Papaïx, J., Adamczyk-Chauvat, K., Bouvier, A., Kiêu, K., S., T., Lannou, C., and Monod, H. 2014.
741 Pathogen population dynamics in agricultural landscapes: The Ddal modelling
742 framework. Infect. Genet. Evol. 27:509-520.
743 Papaïx, J., Rimbaud, L., Burdon, J. J., Zhan, J., and Thrall, P. H. 2018. Differential impact of
744 landscape-scale strategies for crop cultivar deployment on disease dynamics,
745 resistance durability and long-term evolutionary control. Evol. Appl. 11:705-717.
746 Parnell, S., Gottwald, T. R., Gilligan, C. A., Cunniffe, N. J., and van den Bosch, F. 2010. The
747 effect of landscape pattern on the optimal eradication zone of an invading epidemic.
748 Phytopathology 100:638-644.
749 Parnell, S., Gottwald, T. R., Riley, T., and van den Bosch, F. 2014. A generic risk-based