HAL Id: hal-02626375
https://hal.inrae.fr/hal-02626375
Submitted on 26 May 2020HAL is a multi-disciplinary open access archive for the deposit and dissemination of sci-entific research documents, whether they are pub-lished or not. The documents may come from teaching and research institutions in France or abroad, or from public or private research centers.
L’archive ouverte pluridisciplinaire HAL, est destinée au dépôt et à la diffusion de documents scientifiques de niveau recherche, publiés ou non, émanant des établissements d’enseignement et de recherche français ou étrangers, des laboratoires publics ou privés.
How the shape of fillers affects the barrier properties of
polymer/ non-porous particles nanocomposites: A
review
Caroline Wolf, Helene Angellier-Coussy, Nathalie Gontard, F. Doghieri,
Valérie Guillard
To cite this version:
Caroline Wolf, Helene Angellier-Coussy, Nathalie Gontard, F. Doghieri, Valérie Guillard. How the shape of fillers affects the barrier properties of polymer/ non-porous particles nanocomposites: A re-view. Journal of Membrane Science, Elsevier, 2018, 556, pp.393-418. �10.1016/j.memsci.2018.03.085�. �hal-02626375�
Version postprint
Author’s Accepted Manuscript
How the shape of fillers affects the barrier
properties of polymer/ non-porous particles
nanocomposites: A review
C. Wolf, H. Angellier-Coussy, N. Gontard, F.
Doghieri, V. Guillard
PII:
S0376-7388(18)30097-8
DOI:
https://doi.org/10.1016/j.memsci.2018.03.085
Reference:
MEMSCI16079
To appear in:
Journal of Membrane Science
Received date: 11 January 2018
Revised date:
29 March 2018
Accepted date: 30 March 2018
Cite this article as: C. Wolf, H. Angellier-Coussy, N. Gontard, F. Doghieri and
V. Guillard, How the shape of fillers affects the barrier properties of polymer/
non-porous particles nanocomposites: A review,
Journal of Membrane Science,
https://doi.org/10.1016/j.memsci.2018.03.085
This is a PDF file of an unedited manuscript that has been accepted for
publication. As a service to our customers we are providing this early version of
the manuscript. The manuscript will undergo copyediting, typesetting, and
review of the resulting galley proof before it is published in its final citable form.
Please note that during the production process errors may be discovered which
could affect the content, and all legal disclaimers that apply to the journal pertain.
Version postprint
How the shape of fillers affects the barrier properties of polymer/
non-porous particles nanocomposites: A review
C. Wolf1, H. Angellier-Coussy1, N. Gontard1, F. Doghieri2, V. Guillard1
1
UMR IATE, University of Montpellier, INRA, 2 place Pierre Viala, 34060 Montpellier Cedex 1, France
2
DICAM University of Bologna, Via Terracini 28, I-40131 Bologna, Italy.
Abstract:
More than 1000 published experimental data of gas (O2 and CO2) and vapor (H2O) permeability in
nanocomposites containing either spherical, elongated or platelet particles were collected, assorted and compared in order to decipher the role of particle shape on the reduction of the relative permeability of the nanocomposite. It is well known that inclusion of homogeneously dispersed and oriented impermeable fillers with high aspect ratio, such as platelets or elongated particles, should significantly increase the diffusion path of gas and vapors and yield to improve barrier properties. Results revealed that this expected impact was not systematically achieved, even for impermeable lamellar fillers that usually displayed the highest aspect ratio. More specifically, an unexpected increase of the permeability in the nanocomposite was often observed. To explain this deviation of the ‘ideal behavior’, this paper discusses extensively the impact of the nanoparticle shape on the nanocomposite permeability along with structural aspects, related to both the particle nature and size, and the nanocomposite processing routes. Deviations from expected results of enhanced barrier effect are also discussed in correlation with unexpected variations in gas selectivity for O2/CO2 pair. Lastly, this review aims at drawing meaningful conclusions on the structure/mass
transfer relationships and giving directions for the development of the next generation of packaging materials with tailored mass transfer properties.
Keywords:
Version postprint
1. Introduction
In the objective of developing efficient and optimal packaging, one of the main challenges is to design and provide food packaging materials able to protect the food from the external environment and to maintain food quality and safety throughout its shelf life [1,2]. The mass transfers are thus at the heart of the feature
of the food packaging, especially transfers of water vapor, oxygen and/or carbon dioxide, which condition the rates of numerous reactions of food degradation (oxidation, microbial development, physiological reactions, etc.). The development of bulk nanocomposite structures by introducing nanoparticles, i.e. fillers having at least one dimension lower than 100 nm, in polymeric matrices appeared as one of the most
promising directions in the development of packaging materials with advanced mass transfer properties. The expected role of these inclusions is to achieve a significant decrease of the mass transfer properties as compared to the neat matrix by acting as physical obstacles to the diffusion and permeation of diffusing molecules, which have to follow a more tortuous pathway. This phenomenon is called the tortuosity effect.
Many types of nanoparticles have already been tested to modulate mass transfer properties, with hundreds of permeability data published in literature. Nanoparticles can be classified into three major categories according to their particle shape (Figure 1): (i) isodimensional particles, that have the same size
in all directions and an aspect ratio close to unity (such as spherical silica, TiO2 nanoparticles, carbon black and fullerenes); (ii) elongated particles that consist in fibrils with a diameter ranging between 1 and 100 nm and length up to several hundred nanometers (such as carbon nanotubes or cellulose nanofibers); and (iii)
layered particles that are characterized by one dimension ranging from several angstroms to several nanometers (such as layered silicates or starch nanocrystals).
£ 100 nm ³ 100 nm 1-100 nm » 1-10 nm (i) Isodimensional particle
Version postprint
Figure 1. Schematic representation of the three categories of nanoparticles.
Among the three aforementioned types of particles, it is widely recognized that inclusion of impermeable platelets such as clays in the polymer should significantly enhance its barrier properties. However, an in-depth study of the available data in the literature revealed that it was not systematically the case and,
even, on the contrary could lead to a deterioration of the barrier properties. Many reviews deal with the functional properties of nanocomposites, by mainly focusing on mechanical properties [3–14]. Among these studies, some of them focused slightly on the mass transfer properties [5,6,8–12] but without deepening the topic. These studies generally focused on one type of nanoparticle, i.e. spherical
nanoparticles or nano-platelets for instance, particularly for membrane applications. Few of them focused on food packaging applications [13,15–18]. The last exhaustive review in the field is that of Cui et al. in 2015 [19] that focused on gas barrier properties of clay-based polymer nanocomposites. However, the effect of the platelet-shape has never been compared and discussed along with results obtained with spherical and
elongated particle shape. In spite of all these preceding reviews, there is still a huge lack of analysis of all available data in the perspective of deciphering the role of particle shape on the mass transfer properties of the resulting nanocomposite materials, even if it has been highlighted as a key input parameter in
mathematical models. As far as we knew, there is no review that proposes an exhaustive analysis of the experimental permeability values from the available literature.
In order to better correlate the mass transfer properties in nanocomposite materials with their multi-scale
structure, the objective of the present review is to decipher and comprehensively discuss the role of the nanoparticle shape (either isodimensional, elongated or layered) on the modulation of the mass transfer properties in nanocomposites, as a function of filler volume fraction and in the light of the nanocomposite structure achieved. For that purpose, more than 1000 values (i.e. about 170 articles) of the 1995-2015
period containing measured values of O2, CO2 and H2O permeability in polymer-based nanocomposites were collected from the available literature and capitalized in a dedicated on-line database [20]. All data could be uploaded from the permalink provided in figure caption (https://doi.org/10.5281/zenodo.1136269
Version postprint
for nanocomposite based materials. The current work is focused on direct analysis and comparison of
experiments, without any mediation which could be provided by quantitative models. It must be specified that, in order to build up the database for analysis, which is of interest here, recent data for gas barrier in polymer based materials with dispersed graphene and graphene derivatives were not taken into
consideration. In fact, while the latter represent nanocomposite materials with dispersed layered domains, the extremely high aspect ratio and flexibility of graphene layers reduces the threshold value for percolation in these materials to much lower values than in traditional layered particles nanocomposites [21]. Under those conditions, in the volume concentration range for layered particles which is of reference
in this work (in the order of 10% by volume) layers arrangement and layer defects are significantly more relevant to the barrier effect than the aspect ratio (particle shape) itself. For a comparison between gas barrier properties in polymer/clay and polymer/graphene nanocomposite see the review by Tan [22]. For the above reason, although graphene has attracted much attention in recent years, here also for the
production of polymer based composites for packaging [] analysis of pertinent results for gas barrier properties is left to a different discussion and the interested reader is addressed to recent reviews in the field [23].
Besides the meaningful conclusions on the role of nanoparticle shape, the main output of this paper is to give some recommendations for the design of nanocomposite packaging materials with tunable mass transfer properties.
2. Brief overview of nanocomposites processing and morphologies
All the processes used to prepare polymer-based nanocomposites have already been extensively detailed in dedicated reviews and are not further detailed here. Examples of reference publications for layered silicates-based nanocomposites are those of Alexandre & Dubois [4], Ray et al. [11], Pavlidou et al. [6],
Mittal et al. [9] and Cui et al. [19], for natural fiber-based nanocomposites, those of Saheb et al. [24] and Siqueira et al. [25] and for inorganic spherical particle-based nanocomposites, those of Cong et al. [8] and Chung et al. [5]. Due to the large range of polymer matrices and nanoparticles, different processing routes
Version postprint
the raw constituents and their field of application (Figure 2). At laboratory scale, four main processes are
most commonly used to prepare polymer-based nanocomposites from all the types of nanoparticles. Melt processing and solution blending are two processes based on the use of polymers, which lead to the formation of Van der Waals interactions between the constituents, while in-situ polymerization and sol/gel
methods are based on the use of monomers or oligomers, leading to the formation of covalent bonds between the polymer and the nanoparticles (Figure 2). At industrial scale, melt processing is generally preferred due to the difficulty to implement processes requiring the use of huge volumes of solvent.
Depending on the processing conditions, the particle shape and the affinity between constituents, i.e. the
polymer matrix and the nanoparticle, different morphologies can be obtained. For isodimensional and elongated nanoparticles, three arrangements can be observed, i.e. (i) well-dispersed, (ii) agglomerated, or (iii) percolating systems. For platelets, specific names are given to the various possible morphologies: (i) micro-composite, (ii) intercalated nanocomposite or (iii) fully exfoliated nanocomposites. The micro
composite structure corresponds to the formation of tactoïds and appears when the polymer chains do not manage to penetrate into the layered sheets due to, mainly, a poor particle/polymer matrix affinity, an insufficient interlayer distance and/or an inefficient shearing during the process. Intercalated
nanocomposite structures are obtained when the polymer chains have diffused between silicate layers, leading to an increase of the interlayer distance. Exfoliated nanocomposite structures are characterized by a complete delamination and homogeneous dispersion of the layered sheets. Depending on the process, an
isotropic (random) or anisotropic orientation could be achieved (for example platelets orthogonal to the diffusion flux).
A good knowledge of the morphologies obtained is an indispensable prerequisite to well understand variations of mass transfer properties in the nanocomposite materials.
Version postprint
Figure 2: Outline of the preparation techniques of nanocomposite based materials
3. Effect of the nanoparticle shape on the modulation of mass transfer properties
3.1. Theoretical background
A great amount of effort has been made in the literature to describe the effect on transport properties of
the inclusion of non-conducting particles into a conductive matrix and the effect of particle shape has been a focus since the beginning of these studies. Similar analyses of the problem can be found in the field of electrical properties (electrical conductivity/permittivity) as well as in that of heat or mass transfer (thermal
conductivity /mass diffusivity). Exact solutions in terms of effective conductivity of the composite medium have been obtained already by Maxwell in 1873 [26] for the case of dilute mixture of spherical domains ("non-interacting particles") perfectly adhering to the matrix. These exact solutions assume that the
properties of dispersed and continuous phase in the composite are the same than the one measured in the corresponding pure materials ("ideal interface condition").
Wiener [27] in 1912 extended the results to the case of dilute dispersion of long cylinders in the matrix, all aligned in the direction normal to the overall flux. While exact solutions are also available for the case of
spheroids (dilute mixture, perfect alignment), empirical relations as well as numerical result have been discussed for the case of different shapes of the inclusions. Among the best, known results of this kind are those obtained by Nielsen [28] in 1967 following empirical ideas about the increase in contour length of
Native nanoparticles with or without surface
chemical treatment
Organic polymers
Organic monomers or oligomers
Melt processing At the molten state, use of thermo-mechanical energy
Solution blending In solution, using of stirring
Polymers and nanoparticles connected by Van der Waals forces
In situ polymerization Sol/Gel method In presence of Inorganic precursors In solution, copolymerization of monomers and nanoparticles In solution, polymerization of the monomers
Polymers and nanoparticles connected by covalent bonds
Version postprint
path of diffusing molecules in the composite medium due to the presence of impermeable inclusions in the
form of bricks. The specific expression for effective conductivity as function of particle concentration in the composite as derived from the above models is not here presented and discussed, as the direct comparison of available experimental results with model predictions is not in relevant to this work. On the other hand,
it is useful to remember here that all the above approaches consistently predict a decrease in the conductivity when the concentration of impermeable particles in the composite increases. In general terms, it can be said that, assuming ideal interface and non-interacting particle condition, the effective conductivity of the composite medium is expected to be half the value of the pure matrix when the
concentration of dispersed phase approaches 40% vol for isometric particles, 30% vol for elongated particles aligned normally to the flux, and a much lower value, only few percent, depending on the exact
shape, for layered particles lying in planes orthogonal to the flux.
It should be finally mentioned that more complex analyses are definitely needed to consider the interaction between particles in the medium (concentrated mixtures), the distribution in their orientation, as well the non-ideal interaction with the matrix which can ultimately result in regions close to the interface with
properties different from that of pure materials [29].
3.2. Explanation of the analysis approach
The publications considered in the following part were collected from peer-reviewed scientific journals published between 1995 and 2015 in different fields of research such as membrane, materials and
packaging sciences. All these papers, dealing with nanocomposite materials, presented at least one value of permeability in relation to their composition. The nanoparticles considered in works examined in this review are those assumed as impermeable and non-porous with respect to the application that is focused
on: barrier membranes mainly for packaging application. Moreover, it must be noted that mass transfer does not follow the same mechanisms in dense and porous material and that mixing porous and non-porous materials may disturb the analysis. Only gases (O2 and CO2) and water vapor permeability data were considered because of their high interest for food packaging applications. These data were analyzed as
Version postprint
chemical and functionalization treatments applied to the nanoparticle and the elaboration technique used
to prepare materials. The main characteristics of the nanocomposites studied in the present review are gathered in Tables 1, 2 & 3.
Tables 1, 2 and 3 (these tables are provided at the end of the manuscript for the sake of clarity)
In the following, the evolution of the relative permeability, i.e. the ratio of the composite permeability to the permeability of the neat matrix (P/P0), was represented as a function of the nanoparticle volume fraction (φvol), which is considered as input parameter in all mathematical models. This implied to systematically calculate φvol values from weight fractions (φwt) values given in the original papers, based on
the knowledge of the true density of each constituent (equation 1):
[1]
where ρmatrix and ρnanoparticle are the true density of the matrix and the nanoparticles respectively. Such a
conversion led to unavoidable uncertainty on φvol.
3.3. Modulation of mass transfer properties in nanocomposites: global evolution of P/P0
Most of the studies of O2, CO2 and H2O permeability in nanocomposites were carried out in platelets-based
nanocomposites with about 100 publications on the topic resulting in a total of 710 permeability values. All of them have been represented in Figure 3c leading to a scatter graph in which each individual study could not, of course, be distinguished. For comparison, 45 publications were found for isodimensional
nanoparticles-based nanocomposites against 22 for elongated nanoparticles-based nanocomposites, resulting in about 380 and 120 permeability values respectively (Figures 3a and 3b). Papers dealing with elongated particle displaying micrometric sizes (13 papers more) were voluntary excluded from this review. Due to the high number of studies found for each type of particle shape (for O2, CO2 and H2O permeability),
the figures are overloaded and thus not easily readable. Three complementary figures have been drawn for each type of particle shape and for each molecule studied, i.e. O2, H2O and CO2 respectively. Analysis of these general figures permits to highlight the intensive work on the topic and to draw the general
Version postprint
tendencies of P/P0 variation as a function of nanoparticle shape and φvol and nature of the penetrant. The
following observations can be made:
The investigated φvol range is higher for isodimensional and elongated nanoparticles than for platelets with maximal φvol values of 40 vol% and 45 vol% respectively (Figures 3a and 3b), against 15 vol% for nanoplatelets (Figure 3c). Only 3 publications (i.e. 11 permeability values) were in the range of 15-40 vol%
for nanoplatelets-based nanocomposites (not shown in Figure 3c). This feature could be ascribed to the fact that usually, only a small weight fraction of nanoplatelets (generally 1 to 5 wt%) is necessary to obtain a significant effect on the material functional properties.
The evolution and variation amplitude of P/P0 as a function of the nanoparticle volume fraction is really complex and does not follow the same trend according to the shape of nanoparticles (Figure 3). Figures 3a and 3b permit to point out that the addition of isodimensional or elongated nanoparticles in a polymer generally provokes either a monotonic decrease or increase of P/P0 with an amplitude of variation ranging
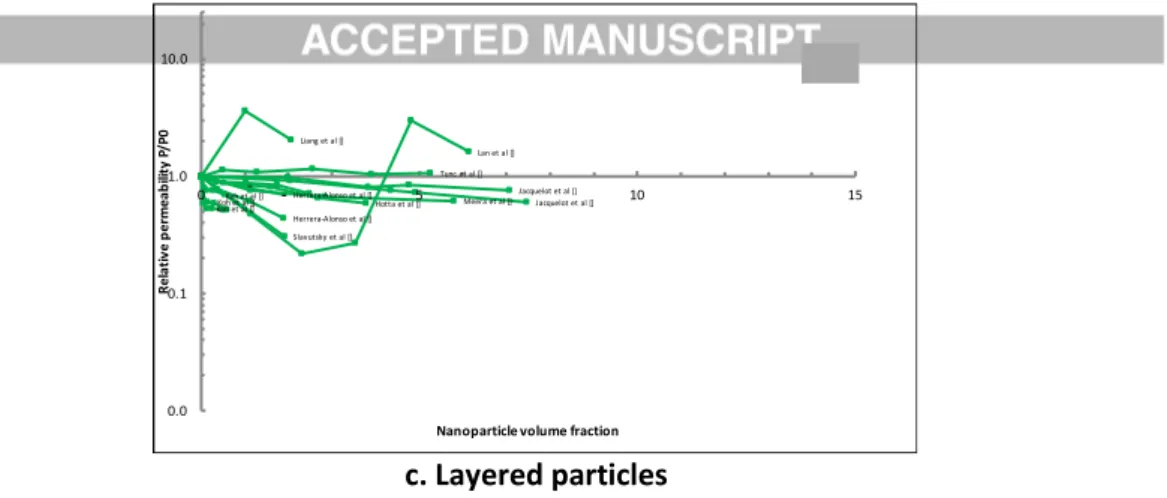
from 0.15 to 16 and from 0.1 to 18, respectively. This leads to a scatter graph of P/P0 with a general aspect in herringbones centered on P/P0 =1. On the contrary, Figure 3c shows that for nanoplatelets, except for one or two cases, P/P0 values remain always below 1.
The maximum drop in P/P0 is much higher for nanoplatelets-based nanocomposites, with P/P0 reaching a minimum value of 0.01, i.e. up to 10 folds lower than the minimum value reached with elongated nanoparticles, and in spite of the lower filler volume fractions used.
For all the kinds of nanoparticles, some non-monotonic variations of P/P0 are noted with simultaneous increase and decrease of the relative permeability for the nanocomposites. It represents approximately
12% of the studies for isodimensional nanoparticles, 21% of the study for elongated nanoparticles and only 7% of the studies for nanoplatelets.
Analysis of the trends per type of penetrant, O2, H2O and CO2 respectively, did not lead to find some difference on P/P0 regarding the molecules studied related to geometry. We also noted that the nature of
Version postprint
Among the aforementioned conclusions of this first general analysis of P/P0 evolution, some trends were
expected, including the fact that nanoplatelets generate, more often and with a higher amplitude than elongated and/or isodimensional nanoparticles, a decrease of the permeability. This could be easily ascribed to the particle geometry and the more pronounced tortuosity effect induced by platelets as
compared to spheres or cylinders. To go further, an in-depth, quantitative analysis of the data collected and capitalized was carried out.
Joly et al [] Joly et al [] Kim et al [] Kim et al [] Cornelius et al [] Cornelius et al [] Cornelius et al [] Cornelius et al [] Cornelius et al [] Cornelius et al [] Cornelius et al [] Cornelius et al []Cornelius et al [] Cornelius et al []Cornelius et al [] Cornelius et al [] Ahn et al [] Ahn et al [] Sadhegi et al [] Sadhegi et al [] Sadhegi et al [] Takahashi et al [] Takahashi et al [] Takahashi et al [] Takahashi et al [] Takahashi et al [] Takahashi et al [] Takahashi et al [] Takahashi et al [] Takahashi et al [] Takahashi et al [] Takahashi et al [TS530] Melt Takahashi et al [] Takahashi et al [] Takahashi et al [] Takahashi et al [] Takahashi et al []
Takahashi et al [SiO2] Casting
Takahashi et al [] Takahashi et al [] Takahashi et al [] Patel et al [] Patel et al [] Iwata et al [] Iwata et al [] Zoppi et al [] Zoppi et al [] Patel et al [] Sadhegi et al [] Sadhegi et al [] Semsarzadeh et al [] Semsarzadeh et al [] Suzuki et al [] Suzuki et al [] Suzuki et al [] Suzuki et al [] Suzuki et al [] Suzuki et al [] Romero et al [] Romero et al [] Romero et al [] Romero et al [] Zhu et al [] Rafiq et al [] Rafiq et al [] Mateucci et al [] Zhou et al []Zhu et al [] Vassiliou et al [] Vladimorov et al [] Kong et al [] Cong et al [] Cong et al [] Cong et al [] Hu et al [] Hu et al [] Kono et la [] Kono et la [] Kono et la [] Kono et la [] Kono et la [] Kono et la [] Moghadam et al [] Moghadam et al [] Bracho et al [] Bracho et al [] Bracho et al [] Bracho et al [] Zoppi et al [] Zoppi et al [] Yu et al [] Yu et al [] Yu et al [] Yu et al [] Yu et al (] Vassiliou et al [] Hu et al [] Hu et al [] Hu et al [] 0.0 0.1 1.0 10.0 0 5 10 15 20 25 30 35 40 R el a ti v e p er m e ab ili ty P/ P 0
Nanoparticle volume concentration
Joly et al [] Kim et al [] Cornelius et al [] Cornelius et al [] Cornelius et al []Cornelius et al [] Cornelius et al []Cornelius et al [] Ahn et al [] Sadhegi et al [] Takahashi et al [] Takahashi et al [] Takahashi et al [] Takahashi et al [] Takahashi et al [] Takahashi et al [] Takahashi et al [] Takahashi et al [] Takahashi et al [] Takahashi et al [] Iwata et al [] Iwata et al [] Zoppi et al [] Sadhegi et al [] Semsarzadeh et al [] Suzuki et al [] Suzuki et al [] Suzuki et al [] Romero et al [] Romero et al [] Zhu et al [] Vassiliou et al [] Vladimorov et al [] Kong et al [] Hu et al [] Kono et la [] Kono et la [] Kono et la [] Moghadam et al [] Zoppi et al [] Hu et al [] 0.0 0.1 1.0 10.0 0 5 10 15 20 25 30 35 40 R e la ti v e p er m ea b ili ty P/ P 0
Nanoparticle volume concentration
Zhou et al []Zhu et al [] Bracho et al [] Bracho et al [] Bracho et al [] Bracho et al [] 0.0 0.1 1.0 10.0 0 5 10 15 20 25 30 35 40 R e la ti v e p e rm e a b ili ty P/ P 0
Version postprint
a. Isodimensional particles Joly et al [] Kim et al [] Cornelius et al [] Cornelius et al [] Cornelius et al [] Cornelius et al []Cornelius et al [] Cornelius et al [] Ahn et al [] Sadhegi et al [] Sadhegi et al [] Takahashi et al [] Takahashi et al [] Takahashi et al [] Takahashi et al [] Takahashi et al [TS530] Melt Takahashi et al [] Takahashi et al [] Takahashi… Takahashi… Takahashi et al [] Patel et al [] Zoppi et al [] Patel et al [] Sadhegi et al [] Semsarzadeh et al [] Suzuki et al [] Suzuki et al [] Suzuki et al [] Romero et al [] Romero et al [] Rafiq et al [] Rafiq et al [] Mateucci et al [] Cong et al [] Cong et al [] Cong et al [] Hu et al [] Kono et la [] Kono et la [] Kono et la [] Moghadam et al [] Zoppi et al [] Yu et al [] Yu et al [] Yu et al [] Yu et al [] Yu et al (] Vassiliou et al [] Hu et al [] Hu et al [] 0.0 0.1 1.0 10.0 0 5 10 15 20 25 30 35 40 R e la ti v e p e rm e a b ili ty P/ P 0Nanoparticle volume concentration
Ismail et al [] Ismail et al [] Kim et al [] Kim et al [] Surya et al [] Surya et al [] Surya et al [] Surya et al [] Pradhan et al [] Azeredo et al [] Cong et al [] Cong et al[] Cong et al [] Kim et al [] Kim et al [] Mondal et al [] Paralikar et al [] Paralikar et al [] Paralikar et al [] Paralikar et al [] Saxena et al [] Saxena et al [] Sreekumar et al [] Sreekumar et al [] Yu et al [] Bilbao et al [] Bilbao et al [] Bilbao et al [] Dogan et al [] Sanchez et al [] Sanchez et al [] Sanchez et al [] Chang et al [] Azeredo et al [] George et al [] Pantani et al [] Pantani et al [] Pantani et al [] Sanchez et al [] Sanchez et al [] Sanchez et al [] Sanchez et al [] Follain et al [] Follain et al [] 0.0 0.1 1.0 10.0 0 5 10 15 20 25 30 35 40 45 R e la ti v e p er m e ab ili ty P/ P0
Nanoparticle volume fraction
Ismail et al [] Kim et al [] Surya et al [] Surya et al [] Pradhan et al [] Kim et al [] Sanchez et al [] Sanchez et al [] Sanchez et al [] Sanchez et al [] 0.0 0.1 1.0 10.0 0 5 10 15 20 25 30 35 40 45 R e la ti v e p e rm e a b ili ty P/ P 0
Nanoparticle volume fraction
Azeredo et al [] Mondal et al [] Paralikar et al [] Paralikar et al [] Paralikar et al [] Paralikar et al [] Saxena et al [] Saxena et al [] Sreekumar et al [] Sreekumar et al [] Yu et al [] Bilbao et al [] Bilbao et al [] Bilbao et al [] Dogan et al [] Chang et al [] Azeredo et al [] George et al [] Pantani et al [] Pantani et al [] Pantani et al [] Sanchez et al [] Sanchez et al [] Sanchez et al [] Follain et al [] Follain et al [] 0.0 0.1 1.0 10.0 0 5 10 15 20 25 30 35 40 45 R e la ti v e p e rm e a b ili ty P/ P 0
Version postprint
b. Elongated particles Ismail et al [] Kim et al [] Surya et al [] Surya et al [] Cong et al [] Cong et al[] Cong et al [] Kim et al [] 0.0 0.1 1.0 10.0 0 5 10 15 20 25 30 35 40 45 R e la ti v e p e rm e a b ili ty P/ P 0Nanoparticle volume fraction
Bharadwaj et al []Chang et al []Chang et al []Chang et al []
Ray et al [] Hotta et al [] Hotta et al []Osman et al [] Ke et al [] Chien et al [] Picard et al [] Tunc et al [] Koh et al [] Koh et al [] Koh et al [] Koh et al [] Koh et al [] Koh et al [] Sanchez et al [] Sanchez et al [] Sanchez et al [] Sanchez et al []Sanchez et al [] Sanchez et al [] Chivrac et al [] Chivrac et al [] Yeh et al [] Lee et al [] Sothornvit et al [] Balachandran et al []
Herrera-Alonso et al []Herrera-Alonso et al [] Jacquelot et al [] Jacquelot et al [] Jacquelot et al [] Jacquelot et al [] Alexandre et al []Alexandre et al [] Kim et al [] Kim et al [] Kim et al []
Kumar et al [] Kumar et al []Kumar et al [] Meera et al [] Meera et al [] Mittal et al [] Rhim et al [] Sanchez et al [] Sanchez et al [] Straewhecker et al [] Tang et al [] Tang et al [] Tang et al []Tang et al [] Xu et al [] Lan et al [] Muller et al [] Bae et al [] Bae et al [] Kasirga et al [] Luecha et al [] Tunc et al [] Tunc et al [] Lee et al [] Osman et al [] Fasihi et al [] Fasihi et al [] Fasihi et al [] Yeh et al [] Herrera-Alonso et al [] Herrera-Alonso et al [] Abdollahi et al [] Ali et al [] Chang et al [] Chang et al [] Chang et al [] Chang et al [] Chien et al [] Chien et al [] Choi et al [] Dunkerley et al [] Echeverria et al [] Gatos et al [] Horst et al [] Horst et al [] Katiyar et al[] Katiyar et al [] Lavorgna et al [] Lee et al [] Lee et al [] 1.000 0.698 0.640 Lee et al [] Liang et al [] Slavutsky et al [] Slavutsky et al [] Wang et al [] Zehetmeyer et al [] Zehetmeyer et al [] Angellier et al [] Swain et al [] Kisku et al [] Dash et al [] 0.0 0.1 1.0 10.0 0 5 10 15 R e la ti v e p e rm e a b ili ty P/ P 0
Nanoparticle volume fraction
Bharadwaj et al []Chang et al [] Chang et al []Chang et al [] Ray et al [] Hotta et al []Osman et al [] Ke et al [] Koh et al [] Koh et al [] Koh et al [] Sanchez et al [] Sanchez et al [] Sanchez et al [] Yeh et al [] Balachandran et al [] Herrera-Alonso et al [] Jacquelot et al []Jacquelot et al []
Meera et al [] Mittal et al [] Sanchez et al [] Sanchez et al [] Bae et al [] Kasirga et al [] Tunc et al [] Lee et al [] Osman et al [] Fasihi et al [] Fasihi et al [] Fasihi et al [] Herrera-Alonso et al [] Chang et al [] Chang et al [] Choi et al [] Dunkerley et al [] Gatos et al [] Horst et al [] Horst et al [] Katiyar et al[] Wang et al [] Zehetmeyer et al [] Swain et al [] Kisku et al [] Dash et al [] 0.0 0.1 1.0 10.0 0 5 10 15 R e la ti v e p e rm e a b ili ty P/ P 0
Nanoparticle volume fraction
Chien et al [] Picard et al [] Tunc et al [] Sanchez et al []Sanchez et al []
Sanchez et al [] Chivrac et al [] Chivrac et al [] Lee et al [] Sothornvit et al [] Alexandre et al [] Alexandre et al [] Kim et al [] Kim et al [] Kim et al [] Kumar et al [] Kumar et al [] Kumar et al [] Rhim et al [] Straewhecker et al [] Tang et al [] Tang et al [] Tang et al [] Tang et al [] Xu et al [] Muller et al [] Bae et al [] Luecha et al [] Yeh et al [] Abdollahi et al [] Ali et al [] Chang et al [] Chang et al [] Chien et al [] Chien et al [] Echeverria et al [] Katiyar et al [] Lavorgna et al [] Lee et al [] Lee et al [] Lee et al [] Slavutsky et al [] Zehetmeyer et al [] Angellier et al [] 0.0 0.1 1.0 10.0 0 5 10 15 R e la ti v e p e rm e a b ili ty P/ P 0
Version postprint
c. Layered particles
Figure 3: Evolution of the relative permeability P/P0 as a function of particle volume fraction in nanocomposite
material containing either (a) iso-dimensional, (b) elongated or (c) layered particles. From references listed in Tables 1, 2 and 3 respectively. Raw data can be uploaded from https://doi.org/10.5281/zenodo.1136269.
Hotta et al [] Koh et al []Koh et al [] Koh et al [] Herrera-Alonso et al [] Jacquelot et al [] Jacquelot et al [] Meera et al [] Lan et al [] Tunc et al [] Herrera-Alonso et al [] Liang et al [] Slavutsky et al [] 0.0 0.1 1.0 10.0 0 5 10 15 R e la ti ve p e rm ea b ili ty P/ P 0
Version postprint
3.4. In-depth analysis of the modulation of mass transfer properties per type of nanoparticle
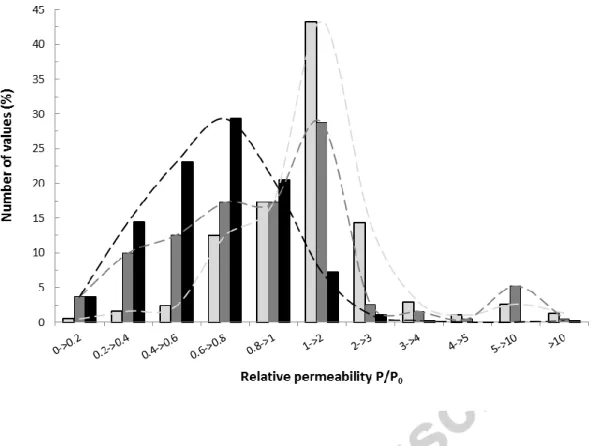
In order to perform a quantitative analysis of the efficiency of each type of nanoparticle shape on P/P0, all the permeability data collected in the literature were gathered on a histogram displaying the percentage of values per class of modulation, i.e. per range of P/P0 values. The maximum
number of permeability values collected for isodimensional (43%), elongated (29%) and layered (30%) nanoparticles is obtained for the classes 1 < P/P0 < 2, 1 < P/P0 < 2, and 0.6 < P/P0 < 0.8 respectively, confirming that layered nanoparticles were more prone to improve the barrier properties of a given polymer (Figure 4).
Besides this main impact, secondary peaks are observed on Figure 4. In the case of isodimensional nanoparticles, 17% of values are obtained for the class 2 < P/P0 <3 and 14% for 0.8 < P/P0 <1, indicating that the permeability in these nanocomposites could be equally multiplied by a factor
of 3 or slightly decreased by a factor of 0.8. This feature confirms well the herringbone scatter graph observed when all P/P0 data are plotted as a function of φvol (Figure 3a).
In the case of elongated nanoparticles, 17% of collected data belong to the class 0.6 < P/P0 < 0.8
and another 17% to the class 0.8 < P/P0 < 1. This indicated that even if the main observed effect of the addition of elongated nanoparticles is a weak increase of permeability up to a factor 2, it could also statistically lead to a decrease of the permeability.
In the case of layered nanoparticles, the overall trend of decreasing permeability is confirmed by
the occurrence of secondary peaks, which reveals that 23% of permeability values were obtained for 0.4 < P/P0 0.6 and 21% for 0.8 < P/P0 < 1. In all the cases, P/P0 values higher than 3 are very rare (less than 6% of the studies for every particle shape).
Version postprint
Figure 4. Percentage of permeability values collected in literature for nanocomposites filled with
either iso-dimensional/spherical (light-grey), elongated (dark-grey) or layered (black) nanoparticles as a function of the classes of the relative permeability P/P0
To verify if the conclusions drawn from this global analysis were confirmed for all the tested filler
contents, permeability values were also apportioned into classes of filler volume fraction in addition to the classes of P/P0 values (Figure 5). The classes chosen for filler fractions were 0-5 vol%, 5-10 vol%, 10-20 vol% and 20-30 vol%. For this analysis, the range for P/P0 was limited to a
maximal value of 3, considering that a higher increase of the permeability ratio was an exceptional behavior. In the case of isodimensional nanoparticles, exactly the same evolution of P/P0 is obtained for each filler fraction, with an increase up to a factor 2 of the permeability in
almost 45 % of the cases (Figure 5a). For elongated nanoparticles, the same increase of P/P0 is obtained but only for filler contents lower than 20 vol%. For higher filler contents, no clear tendency is evidenced, with a disordered shape of the curve. This could be due to agglomerated or percolated structures that become frequent for such high concentration in fillers whose effect
Version postprint
on permeability is more unpredictable (Figure 5b). Finally, for nanoplatelets-based
nanocomposites, for filler contents lower than 5 vol%, the evolution of P/P0 is the same as the general one previously observed on Figure 4 and is characterized by a main peak (30% of data) centered on the class 0.6 to 0.8. This main peak shifts to lower P/P0 values, i.e. better efficiency,
for filler contents ranging from 5 to 10 vol%, with a main peak (38%) for P/P0 values in the range of 0.4 to 0.6. For filler content higher than 10 vol%, the decrease in permeability is not confirmed anymore. We noted that studies conducted with such high amounts of platelets (> 10 vol%) were scarce, which makes it difficult to generalize the effect of high contents of platelets on the
permeability of resulting nanocomposites (Figure 5c).
To sum up, beyond the fact that modulation of the permeability is clearly affected by the shape of the nanoparticles, three conclusions remain:
(i) whatever the filler content, the addition of isodimensional particles does not statistically impact the permeability of resulting nanocomposites very much,
(ii) a significant decrease of permeability could be achieved by nanostructuring polymer matrices with the introduction of either elongated or nanoplatelets-shaped nanoparticles, with a much
higher efficiency of layered nanoparticles. Indeed, the use of filler contents higher than 20 vol% are necessary to achieve a significant decrease of P/P0 in the case of elongated nanoparticles while less than 10 vol% are sufficient in the case of nanoplatelets,
(iii) the barrier effect of nanoplatelets is even more pronounced for filler contents ranging from 5 to 10 vol%.
This analysis has also revealed that the behavior of P/P0 is more complex than expected, with the
occurrence of non-monotonic behaviors, especially in the case of elongated nanoparticles. In the following, lines of explanation will be tentatively brought in order to relate this “shape effect” to the morphology of the particle and the (nano)-structure of the composite.
Version postprint
0-5vol% 5-10vol% 10-20vol% 20-30vol% 0 5 10 15 20 25 30 35 40 45 N u m be r o f va lu e s (% ) Relative permeability P/P0 0-5vol% 5-10vol% 10-20vol% 20-30vol% 0 5 10 15 20 25 30 35 40 45 N u m b e r of v a lu e s (% ) Relative permeability P/P0 0-5vol% 5-10vol% 10-20vol% 20-30vol% 0 5 10 15 20 25 30 35 40 45 N u m b e r of v a lu e s (% ) Relative permeability P/P0Version postprint
Figure 5: Percentage of permeability values collected for nanocomposites filled with spheres (a), cylinders (b) and platelets (c) -based composites according to the volume filler content and as a function of the
relative permeability P/P0
4. In-depth investigation and understanding of the mass transfer properties/structure
relationships in nanocomposites
In the following section, a case by case qualitative explanation of the modulation of the permeability according to particle morphology will be proposed by focusing on the nanostructure obtained and its relationship with mass transfer properties. Three cases will be considered: (1)
“ideal” case of monotonic decrease of P/P0, (2) monotonic increase of P/P0 and (3) non-monotonic variation of P/P0. A critical discussion relying on the mechanisms proposed by the different authors will be offered.
4.1. Monotonic decrease of the permeability
Theoretically, the incorporation of impermeable particles displaying a good compatibility with the polymer matrix should favor the decrease of the permeability of gases and water vapor through
an increase of the tortuous path for the diffusing molecules. Such “ideal” cases were largely observed in data collected from literature, as illustrated on Figure 3 for a large range of nanoparticles displaying various shapes, either isodimensional, elongated or nanoplatelets. For the sake of clarity, the exhaustive list of these references is in footnote1. The amplitude of this
1
Among studies that observed a decrease of P/P0, we can cite the following papers:
For spherical particles: TiO2 [Hu et al. [84]], SiO2 nanoparticles [Zoppi et al. [50]], Patel et al. [89,90], Vladimorov et al.
[44], Vassiliou et al. [45], Zhu et al. [40], Sadeghi et al. [43], Sadeghi et al. [81]]
For elongated nanoparticles: cellulose nanocrystals [George et al. [99]]], cellulose nanowhiskers [Saxena et al. [65], Sanchez-Garcia et al. [105,107], Bilbao-Sainz et al. [51]], cellulose micro-fibres [Fendler et al [174]],
For nanoplatelets: montmorillonites [Gatos et al. [30], Strawhecker et al. [160], Chang et al. [63,144], Xu et al. [169], Choi et al. [118], Chien et al. [116,175], Yeh et al. [170], Herrera-Alonso et al. [128,176], Katiyar et al. [134], Alboofetileh et al. [110], Abdollahi et al. [109]], rectorite silicate [Wang et al. [177]], mica silicate [Sanchez-Garcia et al. [178],
Version postprint
decrease largely depends on the particle shape and/or particle volume fraction used. The authors
mainly attributed this result to (1) a tortuosity effect induced by the nanostructure created by the incorporation of an impermeable particle, and to a lesser extent to (2) the modification of the polymer matrix properties by the presence of nanoparticles, or (3) the modification of the
availability of specific sorption sites for the sorption of the diffusing molecule. These three assumptions will be discussed in the following paragraphs.
4.1.1. Tortuosity effect.
When impermeable nanoparticles are incorporated within a polymer matrix, they act as an obstacle to the diffusion and thus the permeation of diffusing molecules, which have to follow a more tortuous pathway. Mathematically, tortuosity (τ) represents the ratio of the distance that a molecular specie must follow through the nanocomposite thickness to the distance through the
neat polymer.
This tortuosity effect is influenced by the volume fraction and the dispersion and distribution states of nanoparticles within the polymer matrix. Concretely, it could be related to two
quantitative parameters, i.e. the in-situ size aspect ratio of the particle and the orientation of nanoparticles.
cellulose nanocrystals [Fortunati et al. [125]], waxy maize starch nanocrystals [Angellier et al. [113]], boron nitride [Swain et al. [161], Kisku et al. [136]] or silicon carbide [Kisku et al. [137], Dash et al. [120]].
Version postprint
In-situ particle aspect ratio.
The size aspect ratio of a nanoparticle is defined as the ratio of its longest dimension to its lowest dimension. Considering the different possible shapes of nanoparticles, it is obvious that the size aspect ratio of a sphere, equal to 1, is lower than that of elongated nanoparticles and
nanoplatelets for which very high size aspect ratio could be achieved.
The achievement of high size aspect ratios theoretically favors the establishment of a more tortuous pathway. This effect is all the greater for nanoplatelets that allow the creation of 2D obstacles. This has been experimentally validated by Gatos et al. [30] who prepared by melt
processing fully-exfoliated nanocomposites from a hydrogenated acrylonitrile butadiene rubber polymer and two layered silicates displaying different sizes, i.e. octadecylamine modified montmorillonites with a size aspect ratio of 100 and synthetic fluorohectorite with a size aspect
ratio of 200. They observed that the highest decrease of oxygen permeability was achieved using the fluorohectorite as filler, which was ascribed to its higher aspect ratio [30]. It must be noted that the achievement of such high in-situ size aspect ratios is exceptional. Indeed, the formation of stacks or tactoïds within the polymer matrix is usually obtained due to the agglomeration
and/or incomplete exfoliation of nanoplatelets, resulting in a decrease of the theoretical size aspect ratio. An intercalated nanocomposite structure is thus less tortuous than a full-exfoliated structure. This implies that the in-situ size aspect ratio is usually different from the one of the
native nanoparticle. As an example, Angellier-Coussy et al. [31] found average values of in-situ size aspect ratio of 17 and 23 for 10.8 and 2.2 vol% of filler, respectively in wheat gluten/montmorillonite based nanocomposites while the size aspect ratio of one native
nanoparticle was about 80. This issue is the same for elongated nanoparticles where agglomeration often occurs.
In practice, the knowledge of the in-situ size aspect ratio is thus necessary to fully understand and predict the impact of tortuosity on mass transfer properties. It is usually evaluated using image
Version postprint
analysis of TEM pictures when nanoparticles can be easily distinguished from the matrix as is the
case for montmorillonite [31]. This analysis is tricky and time consuming. Indeed, a large number of images must be analyzed to obtain a significant representativeness of the whole material. In addition, it is well-known that TEM analysis has some inherent limitations due to the fact that it
projects three-dimensional (3D) objects onto a two-dimensional (2D) plane, resulting in TEM cross-sections that do not necessarily represent the actual size of all the platelets [32]. Furthermore, an ideal image would exhibit sharp transitions from black to white, what is not the case in reality, necessitating the conversion of the original gray-scale TEM micrograph into a black
and white image using a semi-automated approach, this step being inevitably accompanied by errors. And finally, this evaluation must be done for each filler content, since the dispersion state strongly depends on the filler content. All these limitations probably explain why the evaluation of
the in-situ size aspect ratio is rarely experimentally determined. It is usually an imprecise, unrealistic (if the size aspect ratio of the native nanoparticle is considered) or missing data.
In-situ size aspect ratio and dispersion state.
As explained above, the in-situ aspect ratio strongly depends on the particle dispersion state. Contrary to the in-situ size aspect ratio, which is rarely determined, the impact of the particle dispersion state on nanocomposite mass transfer properties has been largely demonstrated. For example, Koh et al. [33] demonstrated with PLA/organo-modified montmorillonites
nanocomposites that the highest decrease of the oxygen and carbon dioxide permeability was obtained for the most exfoliated structure. The same positive impact of exfoliation on permeability decrease was also obtained by Sanchez-Garcia et al. [34] in PHBV-PCL
nanocomposites and by Sun et al. [35] for α-zirconium phosphate/epoxy resin nanocomposites.
It is worth noting that the achievement of a good dispersion state is all the more difficult as the filler content increases due to agglomeration phenomena, as evidenced in many systems such as agar- (Rhim et al. [36]), polyester- (Bharadwaj et al. [37]), polyamide- (Picard et al. [38]) or
Version postprint
polyimide- (Chang et al. [39]) based nanocomposites with montmorillonite as nanoparticles.
Chemical modification of nanoparticles does not always prevent agglomeration, as evidenced by Zhu et al [40] with modified SiO2 particles in poly (vinyl chloride) matrix.
Orientation.
To obtain an optimal decreasing effect on permeability, the largest surface of each nanoparticle must be oriented perpendicular to the direction of the gas diffusion or permeation. Well-oriented and aligned particles perpendicularly to the permeation flux have more impact on the decrease of
the permeability than disoriented particles as regards the tortuosity effect. This effect of orientation is only valid for elongated particles and nanoplatelets and, of course, all the more significant for particles with high size aspect ratios. This effect of orientation is also theoretically much more efficient for nanoparticles displaying high size aspect ratio in two dimensions (such as
platelets) than only in one dimension (such as elongated particles). In practice, it is an extremely challenging task to achieve a regular arrangement of nanoparticles within the polymer matrix. It is strongly dependent on processing methods. Solution intercalation and in-situ-polymerization are more prone to produce nanostructures with well-aligned and oriented particles than melt
intercalation as observed by several authors. It is all the more difficult that particles display high aspect ratio in 2-dimension such as platelets. For example, Messersmith et al. [41] showed that montmorillonites adopted a planar orientation in the poly(ε-caprolactone) polymer matrix after
in-situ-polymerization and solution casting processing while Sanchez-Garcia et al. [42] noted that it was difficult to obtain, using melt processing and compression molding, well aligned and oriented montmorillonites in PHBV-PCL polymer and that a random orientation is at best the most
often achieved.
Version postprint
The incorporation of nanoparticles can modify the structure and thus the mass transfer properties
of the polymer matrix itself. The two main structural modifications reported to contribute to the decrease of P/P0 are (i) a reduction of polymer free volume associated to an increase in the glass transition temperature and/or (ii) an increase in crystallinity due to a nucleating effect of
nanoparticles. The effect of polymer free volume was for example evidenced in the study of Sadeghi et al. [43] by a reduction of the polymer chain mobility in the amorphous phase in the case of polyurethane-silica nanocomposites. The impact of nanoparticles on polymer crystallinity was largely reported for either spherical particles such as silica nanoparticles (Vladimirov et al.
[44]; Vassiliou et al. [45]) or layered particles such as montmorillonite (Sanchez-Garcia et al. [42]; Ghasemi et al. [46]). Crystallites act as obstacles to migrant diffusion.
4.1.3. Decrease of polymer sorption sites.
The chemical modification of the nanoparticle surface is generally performed to reach a better filler/matrix affinity and thus a better dispersion of nanofillers within the polymer matrix. A side effect of this higher affinity is a decrease of the availability of the sorption sites in the polymer. It
is particularly true for highly interactive molecules such as water vapor that interacts though hydrogen bonding with hydrophilic sites. These sites bonded with the nanoparticles are not any more available for water sorption. Such changes in specific interactions between the migrant and the polymer were proposed to explain the decrease of water vapor permeability observed by
Tunc et al. [47] in wheat gluten/montmorillonite or by Lee et al. [48] in soy protein/montmorillonite nanocomposites.
4.2. Monotonic increase of the permeability
Several assumptions are proposed in literature to explain either the absence of significant modification or even an increase of the permeability in nanocomposites: (1) an insufficient tortuosity effect, (2) the occurrence of macroscopic structural defects in the nanocomposite
Version postprint
material induced for instance by particles agglomeration, (3) a significant modification of the
structure of the polymer matrix such as a decrease of crystallinity or molecular weight, and (4) an increase of migrant sorption induced by nanoparticles (case of water vapor for example, for water sensitive materials). It is worth noting that some mechanisms assumed to explain an increase of
P/P0 were previously discussed for explaining a decrease of P/P0 (§ 3.1).
4.2.1 Lack of tortuosity effect.
In some cases, the dispersion state of nanoparticles did not allow to achieve a sufficient tortuosity effect to slow down the diffusion of migrating molecules, especially for small molecules such as
gases. Such an explanation is widely proposed to explain why values of permeability did not change or only slightly decreased in the nanocomposite as compared to the neat matrix. This has been, for example, proposed by Tunc et al. [47] to explain the constancy of O2 permeability in
wheat gluten/montmorillonite nanocomposites. In the same article, authors however demonstrated that the achieved tortuosity was nevertheless sufficient for decreasing permeability of bigger molecules such as aroma compounds. This highlighted that the nature, molecular weight and/or steric hindrance of the migrant are also key parameters governing the
mass transfer properties in nanocomposites.
4.2.2. Macroscopic structural defects
Particle agglomeration.
The presence of both nano- or micro-sized agglomerates and aggregates of particles could induce macroscopic structural defects, which play a major role in the increase of P/P0, as already shown for either spherical-based composites with SiO2 [Cornelius et al. [49]], TiO2 nanoparticles [Zoppi et
al. [50]] or cylinder-based composites with cellulose fibrils [Bilbao-Sainz et al. [51]]. These agglomeration phenomena are related to a bad dispersion of the nanoparticles which is mainly ascribed to (1) mismatching of the particle polarity, as compared to that of the polymer, resulting
Version postprint
in a low affinity between constituents and thus a poor particle/polymer adhesion [50] and/or (2)
inefficiency of the elaboration technique to separate aggregates.
For example, insufficient shearing forces during the melt processing could cause agglomeration of particles. During casting, sol-gel method and in-situ polymerization, coalescence of the particles
during drying of the solution could appear through insufficient particle/particle interactions (“bad compatibility”). This last phenomenon is normally limited by chemical modification of the surface of the particles. But when the effect of this chemical modification is wrongly anticipated it could even amplify/trigger coalescence of particles as evidenced by Zhu et al. [40] in their study of H20
and O2 permeability of silica/PVC nanocomposites with SiO2 surface grafted with polymethyl methacrylate (PMMA). They noticed that high content of filling (> 2.5 vol/vol%) increased the permeability of both O2 and H20 due to an agglomeration phenomenon owing to the tendency of
nanoscale silica modified nanoparticles to be fused together at this concentration. This phenomenon was not anticipated.
Agglomeration could lead to the formation of “interfacial voids” at the particle/polymer matrix interface and to the formation of a preferential pathway for the migration of the molecular
penetrant [Ismail et al. [52], Rafiq et al. [53]]. This is further detailed below in the section dedicated to the “interphase”.
Interphase.
An interphase, i.e. a “third compartment” with its own properties, is generated at the particles/polymer interface due to the establishment of either weak or strong interfacial interactions between the particles and the polymer matrix. Depending on its nature and thickness
(or volume fraction), the interphase could significantly participate to the overall mass transfer properties and strongly influence the overall permeability of the composite as evidenced by Liang et al. [54] in their poly(ethersulfone)/montmorillonite nanocomposites. These authors
Version postprint
hypothesized that the interphase in their nanocomposite structure was made of interface voids
due to a poor adhesion between hydrophilic nanoparticles and hydrophobic polymers contributing to the high gas permeability observed.
4.2.3. Modification of the polymer matrix.
The incorporation of nanoparticles could result in the disruption of polymer chain packing, causing an increase of polymer matrix free volume. This increase in free volume leads to an increase in permeability or to a lesser decrease than expected. This impact on free volume is often just a hypothesis that is not always confirmed experimentally, due to the difficulty to
experimentally access such information.
Such hypothesis of polymer matrix modification with increase of free volume was speculated by several authors for isodimensional particles-based composites with titanium dioxide [Matteucci et
al. [55], Moghadam et al. [56]] or silica nanoparticles [Dougnac et al. [57], Romero et al. [58]] and in elongated particles-based nanocomposites with carbon nanotube [Murali et al. [59]]. An increase of free volume was also hypothesized to occur when using compatibilizing agents due to bad compatibility between the compatibilizer and the surface treated particles (Mittal et al. [60]).
The addition of nanoparticles in a polymer matrix could also hinder the crystallization process if chain mobility is hindered, leading thus to a decrease of the overall crystallinity of the polymer that could contribute to enhance the overall mass transfer within the composite [Dougnac et al.
[57]].
We noted that this increase of free volume is often considered as a global explanation resulting from different phenomena: in addition to the modification of polymer matrix, increase in free
volume could also result in void space formation by nanoparticles aggregation and weak interaction between polymer–nanoparticles at interface [Moghadam et al. [56]]. All these mechanisms are not easily distinguished. Therefore, authors stressed an overall increase of free
Version postprint
volume that they experimentally assessed by density measurements, without distinguishing all
underlying mechanisms. Indeed, if the density of the nanoparticles, crystalline polymer and amorphous polymer phases has their pure component values in the nanocomposites, then the density of a nanocomposite sample, would be equal to the theoretical additive density. The
difference between theoretical and experimental densities can be rationalized by the overall increase of free volume as evidenced by [Matteucci et al. [55]] in spherical-based composites with titanium dioxide.
4.2.4. Increasing migrant sorption.
The increase of P/P0 could be related to the establishment of specific interactions between the molecular penetrant and the material constituents, as largely observed for water vapor and hygroscopic nanoparticles such as silica nanoparticles [Bracho et al. [61], Dougnac et al. [57]] or
microcrystalline cellulose [Dogan et al. [62]], and also for O2 and organo-modified montmorillonite [Chang et al. [63]], for O2 or modified silica nanoparticles [Iwata et al. [64]] or CO2 and titanium dioxide nanoparticles [Matteucci et al. [55]].
Different mechanisms could occur concomitantly, explaining why significant effects on P/P0 are
not systematically observed. For instance, Dogan et al. [62] did not notice any significant change of the water vapor permeability in hydroxyl propyl methyl cellulose/microcrystalline cellulose nanocomposites in spite of a tortuosity effect. This was ascribed to the occurrence of a
competitive effect, i.e. an increased water affinity with the materials. The same happened in the study of Matteucci et al. [55]: they observed an enhancement of CO2 permeability in spherical-based composites with titanium dioxide due to an increase in gas solubility in the nanocomposite
films upon incorporation of highly sorbing nanoparticles into the polymer. This effect is overlapping with the creation of voids and global increase in free volume with increasing particle loading. It should be noted that all these explanations are always hypotheses that are usually not experimentally validated.
Version postprint
Figure 6 is providing summary of the two previous 4.1 and 4.2 paragraphs with key take home
messages about the main mechanisms explaining monotonic increase of decrease of the ratio P/P0.
Figure 6: Main mechanisms explaining monotonic increase of decrease of the ratio P/P0 in nanocomposites
4.3. Non-monotonic variation of P/P0
The permeability towards gases and water vapor did not always monotonically vary. In a general manner, theories already provided above for explaining monotonic decrease or increase of P/P0
remain valid in that case and apply to a specific part of the curve.
The most observed non-monotonic variation of P/P0 is first a decrease of P/P0 until reaching a threshold value of filler content, followed by a sudden increase of P/P0. This evolution is generally ascribed to a change in the nanostructure as a function of filler content. For example, in the work
of Sanchez-Garcia et al. [42] dealing with montmorillonite-based nanocomposites, the permeability first decreased due to a tortuosity effect and then increased for filler contents higher than 5 vol% due to the formation of agglomerates. In the case of elongated particles-based nanocomposites [Dogan et al. [62], Saxena et al. [65], Paralikar et al. [66]], a similar evolution was
observed with the formation of particle agglomerates at higher particle volume fractions (generally > 10 vol%). In addition to agglomeration that could reverse the trend of variation of P/P0, some extensive cracking of the composite film could occur and lead to a complete loss of
⇲ P/P0 Efficient tortuosity effect
high In-situ particle aspect ratio Good dispersion of particles Orientation ⏊ flux
Modification of the polymer matrix
⇣polymer free volume & ⇡Tg
⇡crystallinity (nucleating effect /particles)
Decrease of polymer sorption sites
better filler/matrix affinity
P/P0⇱ Lack of tortuosity effect
Macroscopic structural defects
Particle agglomeration Presence of an interphase
Modification of the polymer matrix
⇡ free volume void space formation
Increasing migrant sorption
Version postprint
barrier properties [Chaiko et al. [67]], which was attributed by the authors to excessive particle
agglomeration at high particle fraction.
An opposite evolution has been also noted in the case of water vapor as migrant: first, an increase of the water vapor permeability probably caused by enhanced affinity between water vapor and
composite constituents displaying a hydrophilic nature and, second, a decrease of the permeability induced by the tortuosity that finally is sufficient enough at high loading rates to decrease the permeability value. This has been observed by Follain et al. [68] for poly(ε-caprolactone)/cellulose nanocrystals.
4.4. Explanation of the evolution of the permeability in line with the evolution of solubility and
diffusivity coefficients
In this section, it is considered that the properties of the polymer matrix are not affected by the
incorporation of nanoparticles and that nanocomposites are two-phases systems with a perfect adhesion at the particle/matrix interface. This makes the relation P=D×S, where P, D and S are respectively the permeability, diffusion and solubility coefficients, valid [49,69]. In order to explain the complex evolution of P/P0 as a function of filler content, some authors tried to
decompose the permeability into diffusivity and solubility and to relate the apparent evolution of P/P0 to change in D or S or both. For that purpose, they generally determined the diffusivity and/or solubility coefficients independently of the permeability.
In nanocomposites, a decrease in permeability should be ideally related to a decrease in both diffusivity and solubility coefficients due to the formation of a more tortuous pathway (influence on D) and to the diminution of the volume for the sorption of gases or vapors. However, this ideal
case was not always observed. In most cases, solubility did not systematically decrease and tended either to remain constant or even to increase.
Version postprint
For example, O2/CO2 solubility was found to remain constant in poly(amide-6-b-ethylene oxide)
[70] or brominated poly(2,6-diphenyl-1,4-phenylene oxide) [71] filled with silica nanoparticles while CO2 solubility was found to increase with the addition of silica particles in polybenzimidazole [72]. Despite the fact that the same nanoparticle was used in these three
studies, the effect on gas solubility obtained was not. This demonstrated that if the particles could be considered as impermeable (D=0), it is not true for their solubility. As mentioned above in § 3.2, increase of S could also be related to the progressive uncovering of active sorption sites in the polymer matrix as a consequence of particle addition and to the creation of specific sites at the
particle/polymer interface that favor the sorption of molecular penetrants as hypothesized by Sadeghi et al. [72] and Suzuki et al. [73].
As regards the diffusivity coefficient, the expected behavior is a decrease due to the restriction of
the motion of molecular penetrant and the creation of a more tortuous path caused by the presence of the particles [72,73]. But the opposite phenomenon could also occur. Sadeghi et al. [74], seeking to understand the increase of the permeability in polyvinyl acetate with the addition of silica nanoparticles, made the assumption that the diffusivity coefficient could increase either
due to a reduction of the packing density of the polymer which provides further open structures for the diffusion of CO2 or to a reduction of the crystallinity which lead to more amorphous phases where diffusion happens. The latter effect was also hypothesized by Kono et al. [75] and
Ahn et al. [76] on silica nanoparticle based nanocomposite. The diffusivity could also remain constant or increase with the addition of impermeable particles due to bad adhesion or compatibility between constituents or the creation of interconnected cavities/channels as
evidenced by Suzuki et al. [73], Kim et al [70] (2001) and Cong et al. [71].
To sum up, following analysis of all aforementioned experimental evidences, we can conclude that there is generally a competition between an increase of the solubility and a decrease of the diffusivity. Therefore, non-monotonic changes of P/P0, in peculiar, decrease of P/P0 followed by

![Figure 7: Evolution of the CO 2 /O 2 permselectivity as a function of particle volume fraction in nanocomposite materials containing either (a) iso-dimensional, either (b) elongate or (c) layered particle Ismail et al [2011] Chiou et al](https://thumb-eu.123doks.com/thumbv2/123doknet/14036263.458567/38.892.231.786.97.787/evolution-permselectivity-function-particle-nanocomposite-materials-containing-dimensional.webp)