HAL Id: hal-00696395
https://hal.archives-ouvertes.fr/hal-00696395
Submitted on 15 May 2020
HAL is a multi-disciplinary open access
archive for the deposit and dissemination of sci-entific research documents, whether they are pub-lished or not. The documents may come from teaching and research institutions in France or abroad, or from public or private research centers.
L’archive ouverte pluridisciplinaire HAL, est destinée au dépôt et à la diffusion de documents scientifiques de niveau recherche, publiés ou non, émanant des établissements d’enseignement et de recherche français ou étrangers, des laboratoires publics ou privés.
Nolwenn Bougon, Luc Aquilina, Jérôme Molenat, Dominique Marie, Yannick
R. Delettre, Emilie Chancerel, Philippe Vandenkoornhuyse
To cite this version:
Nolwenn Bougon, Luc Aquilina, Jérôme Molenat, Dominique Marie, Yannick R. Delettre, et al.. Influence of depth and time on diversity of free-living microbial community in the variably saturated zone of a granitic aquifer. FEMS Microbiology Ecology, Wiley-Blackwell, 2012, 80 (1), pp.98-113. �10.1111/j.1574-6941.2011.01273.x�. �hal-00696395�
Influence of depth and time on diversity of free-living microbial community in 1
the variably saturated zone of a granitic aquifer. 2
Bougon N.1, 2, 5
*
, Aquilina L.1*, Molénat J.3, 6, Marie D.4, Delettre Y. 2, Chancerel E.2 and 3Vandenkoornhuyse P. 2 4
1
Université Rennes 1-CNRS UMR 6118 Géosciences, Campus de Beaulieu, Avenue Leclerc, 5
Rennes, France 6
2
Université Rennes 1-CNRS UMR 6553 EcoBio, Campus de Beaulieu, Avenue Leclerc, 7
Rennes, France 8
3
Agrocampus Ouest – INRA UMR 1069 Sol Agrohydrosystèmes Spatialisation, 65 rue de St-9
Brieuc, Rennes, France 10
4
Station Biologique, CNRS – Université Pierre et Marie Curie UMR 7144, Place Georges 11
Teissier, 29682 Roscoff 12
5
Present address: Cemagref UR MAEP, Pôle Hydroécologie des cours d’eau 13
ONEMA/Cemagref, 3 bis, Quai Chauveau - CP 220 69336 LYON cedex 09, France 14
6
Present address: INRA / LISAH, UMR INRA–IRD–SupAgro, 2 place Viala, 34060
15
Montpellier, France
16
-
*
Corresponding author: CNRS –Université de Rennes 1, UMR 6118 17Géosciences, Campus Beaulieu, 263 avenue du Général Leclerc, 35042 Rennes 18
Cedex, France. Phone: (33) (0).2.23.23.67.79. Fax : (33) (0).2.23.23.60.90. E-mail 19
for N. Bougon: [email protected]. E-mail for L. Aquilina : luc.aquilina@univ-20
rennes1.fr 21
Abstract 23
We investigated the temporal and vertical changes in the microbial communities related to 24
hydrological variations an aquifer (Brittany, France). Five water samplings were carried out, 25
spanning 3 hydrological cycles in the variably and the permanently saturated zones. Seasonal 26
variations in the major anion concentrations (NO3-, SO42- and Cl-) indicated that different 27
physical processes occurred during the recharge process in the 2 zones. The variably saturated 28
zone is mainly dominated by diffusion and advection processes from the soil whereas the 29
permanently saturated zone is controlled by moderate advective transfer from the variably-30
saturated zone. Bacterial diversity was investigated by flow cytometry, 16S rRNA and narG 31
genes analyses. Part of this diversity was new in that 6 of the 27 16S rRNA gene sequence 32
phylotypes were unknown even at the class or phylum level. The narG gene analysis did not 33
reveal any clear variation in time or depth within the nitrate reducers’ community. In contrast, 34
16S rRNA gene analyses showed modifications of community composition that could be 35
related to the hydrologic and chemical contrast between the 2 zones. It was concluded that the 36
physical processes of water transfer could influence bacterial diversity at the soil aquifer 37
interface. 38
39
Keywords: hydrology, microbial community, 16S rRNA gene, T-RFLP, water table 40
fluctuation zone 41
Introduction
43
Aquifer quality is considered as a major point in water protection and directives management. 44
Beside these policies, the understanding of ecosystem health is crucial (Griebler et al. 2010). 45
If stream water quality has been investigated and monitored for a while, aquifer quality has 46
been neglected across the world (e.g. Korbel & Hose 2011). Aquifers are not anymore 47
considered as a water resource but also as a living ecosystem which controls the water quality 48
(e.g. Griebler et al. 2010). Investigations of groundwater microbial diversity and ecosystem 49
have increased in the last few years (e.g. Griebler & Lueders 2009, Bougon et al. 2009). 50
However our understanding of the microbial diversity involved in key biogeochemical 51
processes for groundwater functioning is still limited. The knowledge of groundwater habitats 52
is mainly framed under the characterization of hydrological processes including fluxes, 53
chemistry and geological hetereogeneity (Madsen and Ghiorse 1993). 54
Microbial community (diversity and abundance) in groundwater seems to be related to 55
complex relationships between organic contaminants, nutrients and hydrogeology (Chapelle 56
2000, Christensen et al. 2001, Griebler & Lueders 2009, Pearce et al. 2011). Despite our 57
understanding about the impact of contamination on microbial diversity (e.g. Röling et al. 58
2001), little is known about the impact of physical processes as hydrologic changes on the 59
microbial diversity in groundwater. Studies on porous media revealed that bacterial 60
distribution was mostly affected by passive transport processes (e.g., advection, diffusion or 61
filtration) (Balkwill et al. 1998, Huysman and Verstracte 1993, Trevors et al. 1990) and 62
several models have focused on understanding and predicting microbial transport in natural 63
porous and high nutrient media (e.g. Ginn et al. 2002, Harvey et al. 1993, Murphy and Ginn 64
2000, Rockhold et al. 2004). Few attempts have been made to characterize microbial 65
distribution and activities in unsaturated or variably saturated systems. More research seems 66
to be required to better understand microbial responses to hydrological changes (Fisk et al. 67
2003). 68
Within aquifers, knowledge of the physical processes occurring in the fluctuation zone is also 69
important to our understanding of biological and biochemical processes. This zone of water 70
table fluctuation is unique with highly variable saturation conditions controlling the 71
availability of nutrients to microbial organisms (Legout et al. 2007). Although considered 72
mainly as a transfer zone it also exhibits biogeochemical reactions such as the various 73
denitrification processes (Dunn et al. 2005, Legout et al. 2005). Although the recharge 74
process has been widely investigated (e.g. de Vries and Simmers, 2002), few studies have 75
focused on the processes governing water flow and solutes transfer in the fluctuation zone of 76
the water table. The different processes recently identified in this zone include: rapid vertical 77
fluxes from soil to water table (Legout et al. 2007), lateral fluxes along the hillslope below the 78
soil (Derby and Knighton 2001, Haria and Shand 2004, Rawlins et al. 1997) and cyclic 79
chemistry control by groundwater fluctuations (Fretwell et al. 2005). Hydrological conditions 80
in the variably saturated zone present both seasonal variations and a vertical contrast with the 81
saturated zone. With a seasonal rhythm, conditions change from a permanently-82
saturated zone in depth to a variably-saturated medium, close to the soil. The vertical contrast 83
between the two zones is characterized by a water table and chemical characteristics 84
seasonally close to the soil in the variably-saturated zone and more constant chemical 85
characteristics in the deeper permanently-saturated zone. Groundwater ecosystems are 86
generally characterized by low concentration of dissolved organic carbon and by the lack of 87
light. These factors are amongst the most differences with the soil ecosystem (Gibert 1994, 88
Griebler and Lueders 2009). The investigation of these 2 zones presents an ecological interest 89
by presenting differing environmental conditions but also potential seasonal connections. 90
In this study we (i) analyse the temporal and vertical changes in the microbial communities 91
(i.e. distribution and structure) related to hydrological variations in the water table fluctuation 92
zone of a granitic aquifer and immediately below. The studied aquifer is characterized by 93
nitrate concentrations (Legout et al. 2005) exceeding regularly the upper limit of 50 mg.L-1 94
recommended by EU groundwater directive. Legout et al. (2005) also demonstrated a 95
denitrification potential in the fluctuation zone of this particular catchment. In this context, 96
the work presented herein aims (ii) to address a possible link between the nitrate 97
concentration in groundwater and changes in nitrate reducing community. To do so, 98
molecular tools allowing rapid profiling of microbial community were used. To assess the 99
'global' diversity and 'nitrate reducing' diversity, the 16S rRNA and narG genes were used as 100
targets respectively. The narG gene encoding a subunit of the nitrate reductase that catalyses 101
the reduction of nitrate to nitrite is found in many bacteria (e.g. Firmicutes, Actinomycetes 102
and Proteobacteria) and Archaea (Chèneby et al. 2003, Packman et al. 2004). We hereafter 103
define ‘nitrate-reducing bacteria’ as those bacteria possessing the capacity, within their 104
genome, to transform nitrate to nitrite. As a first approximation, we assumed that ‘nitrate-105
reducing bacteria’ could be assessed by analysing narG gene diversity, although other genes 106
harbour the ability to perform this function. 107
The analysis of temporal and spatial changes in the microbial communities is assessed herein 108
from water samplings using a pan-flute device. This device allows investigating the 109
unsaturated zone by intercepting water at 6 m, 8m, 10 m and 15 m depth by different 110
piezometers. The analysis of the communities of free-living bacteria was coupled with a 111
characterization of chemical and hydrological properties over 2.4 years, during 3 hydrological 112
cycles at each depth. 113
114
Material and methods
116
Site description 117
The Kerrien catchment covers an area of 0.12 km², is located in an agricultural site, mainly 118
devoted to pasture and dairy cows, in south-west Brittany (47°57’N-4°8’W, 2347.35N – 119
117.5E, see Fig. S1 in Supplementary material). The outlet is about 10 km from the sea 120
(Legout 2006, Martin 2003, Martin et al. 2004, Molénat et al. 2007). This catchment serves as 121
a national research observatory for environmental investigations (INSU-CNRS and INRA 122
observatory, http://www.inra.fr/ore_agrhys) which has been intensively monitored for 123
hydrochemistry for more than 10 yrs. The different compartments of the aquifer and their 124
contribution to catchment functioning has been highlighted in previous research (Martin 2003, 125
Martin et al. 2004, Molénat et al. 2007, Pierson-Wickmann et al. 2009) along with solute 126
transfer in the unsaturated zone (Legout et al. 2007). 127
The climate is oceanic with a mean annual precipitation of 1167 +/- 195 mm. The bedrock is 128
fissured, fractured granite, overlain by weathered material within which the shallow 129
groundwater accumulates and fluctuates (Legout et al. 2007). The weathered granite lies 130
between 0.7 and 1.2 m below the soil surface. The soils are mainly sandy loams. The depth of 131
the water-table ranges from 2 to 8 m below the soil surface. A plot with six piezometers at 3 132
to 15 m depth (3, 5, 6, 8, 10 and 15 m) was set up in the weathered material. These 133
piezometers consisted of PVC tubes with a 1-m-thick perforated screen at one end, which 134
allowed the collection of water from a 1-m-thick groundwater layer. Whilst only one 135
piezometer set was investigated for microbiology, three other similar plots are located along 136
the slope of the catchment and a further line of three other plots are located 100 m to the West 137
as a replicate. The chemical concentrations have been monitored for 10years and variations of 138
the vertical chemical gradients have been observed along the slope as well as spatially. This 139
monitoring (Legout et al. 1997, Rouxel et al. 2011) provides a good characterization of the 140
chemical variations with depth and the adequacy of the sampling design. 141
142
Analytical methods 143
The piezometric level in this plot in the Kerrien catchment was continuously recorded from 144
mid-December 2004 until mid-April 2007 (2.4 years). Five water chemical measurements and 145
bacterial samplings were carried out in the different piezometers along the vertical soil-146
groundwater profile during this 2.4 yr period. Three campaigns corresponded to high water 147
(05/25/05; 03/13/06 and 01/25/07) and two to low water levels (01/18/06 and 11/22/06). 148
Physico-chemical parameters such as pH, temperature, redox potential, dissolved oxygen and 149
electrical conductivity were measured in situ. The water samples were filtered in the field 150
through 0.22 µm cellulose-acetate filters (Sartorius Minisart), and stored for less than 24 h in 151
the dark below 4°C before being analyzed for major anions (Cl-, SO42- and NO3-) by ionic 152
chromatography (Dionex DX120) in the CAREN-Geosciences Rennes laboratory facilities. 153
The level of uncertainty for the major anion concentrations was below 4 %. The total 154
dissolved carbon (TDC) and dissolved inorganic carbon (DIC) were analyzed with a 155
Shimadzu TOC 5050A (quantification limits: 0.85 mg L-1; detection limits: 0.08 mg L-1). The 156
dissolved organic carbon (DOC) was calculated from TDC and DIC (i.e. DOC=TDC-DIC). 157
The organic carbon was not measured during the 3rd and 5th campaigns due to technical 158 problems. 159 160 Groundwater sampling 161
Groundwater samples were collected at the Kerrien Site from the piezometers at 6, 8, 10 and 162
15 m depth. This pan-flute device has the advantage to allow the recharge process, seasonal 163
variation and vertical gradient to be monitored, and to allow easy water sampling. For the 164
latter, an ISMA® sampler was used during the first two field campaigns but was replaced in 165
subsequent campaigns by a Grundfos MP1 immersed pump to ensure better efficiency. The 166
ISMA sampler was rinsed three times with deionized water and once with groundwater 167
between each well sampling. The Grundfos pump was rinsed with groundwater. Two liters 168
were collected from each piezometer. The fourth field sampling campaign was characterized 169
by a lack of water in the 6 m depth piezometer. The microbial sampling protocol was adapted 170
from a marine sampling strategy (Massana 2004). Each 2 litre sample was subjected to 171
cascade filtration using three thresholds i.e., 10µm (Isopore™ - TCTP, membrane filters), 172
5µm (Isopore™ - TMTP, membrane filters) and 0.22µm (Sterivex™ -GV, Millipore) via a 173
peristaltic pump. This step was necessary to concentrate the microbial biomass before nucleic 174
acid extraction and was done immediately after sampling in the field. The filters were placed 175
in Petri dishes and stored at 0°C in a refrigerant container, and then at -20°C in the laboratory 176
prior to DNA extraction. DNA was extracted in the 96 hours following the sampling and then 177
stored at - 80°C. 178
The potential effect of well structure (tube and gravel surrounding the tube), on water 179
biochemistry and bacterial diversity, was estimated by sampling before and after purging the 180
borehole (i.e. replicates, see below for details). This purge consisted of removing a water 181
volume equivalent to three times the well volume i.e. a minimum of 90 liters, with a Grundfos 182
MP1 immersed pump. The pump was made of inert materials to avoid any contamination of 183
the pumped liquid. For a given well, we expected the local heterogenity being the highest 184
before and after purge. Thus, for each piezometer we decided to perform 2 true-sampling 185
replicate one before and one after purge. 186
187
Bacterial counts 188
The bacteria were counted by flow cytometry on a FACSort (Becton Dickinson). Two 189
milliliters of water placed in a sterile cryovial were fixed with 7µL of glutaraldehyde in the 190
field and stored in the refrigerant container during the sampling period. Back in the 191
laboratory, the cryovials were dipped in liquid nitrogen and stored at -80°C before analyses. 192
This was done similarly for all the samples. 193
194
DNA Extraction 195
DNA was extracted from the filters (see above, 'groundwater sampling') by physical 196
disruption of cells by bead-beating at a frequency of 30 oscillations per sec for 27s (Retsch 197
MM400, Germany) and by using the DNeasy Plant miniKit (Qiagen) according to the 198
manufacturer's protocol. This method was chosen from preliminary tests using different 199
strategies as beat-beating frequencies and durations, standard CTAB extraction method and 200
Dneasy Plant mini kit (results not shown). 201
202
Primers 203
A set of narG sequences of bacteria and Archaea, available from the GenBank database, were 204
aligned and scanned for conserved regions that could provide suitable primer targets. Two 205
degenerated primers, narGr TTTTCSTACCAGGTCGC-3') and narGf (5'-206
TAYGTCGGGCAGGAAAA-3'), were selected from the analysis to amplify a specific 840 bp 207
fragment of the narG gene (Bougon et al. 2009). 208
The universal bacterial primers (Orphan et al. 2000, modified by Vandenkoornhuyse et al. 209
2007), Eub-519F GTTTCAGCMGCMGCCGCGGT) and Eub-1390R (5’-210
GTTTGACGGGCGGTGTGT) were used to amplify a 871 bp internal fragment of the 16S 211
rRNA gene. 212
16S rRNA and narG genes amplifications 214
PCRs amplifications were performed for each 16S rRNA and narG genes. The PCRs 215
amplifications were performed ina total volume of 50 µl containing 0.2 to 0.3 µg of purified 216
DNA, 250 µM of each deoxyribonucleotide triphosphate (dATP, dCTP, dGTP, dTTP; 217
Promega, Madison WI), 1 µL of proof reading Taq DNA polymerase(5U/µl - Applied 218
Biosystems), 1x Taq DNA polymerase buffer containing 1.5 mM magnesium chloride 219
(Applied Biosystems) and 2 µM of Eub-519F and Eub-1390R for the 16S rRNA gene 220
amplification or 1 µM narGr and narGf for the narG gene amplification. For the 16SrRNA 221
gene amplification, the cycling regime was an initial step at 94°C for 2 min 30s, followed by 222
35 cycles at 94°C for 30 s, 52°C for 1 min, and 72°C for 50 s. The amplification ended by a 223
final extension step at 72°C for 10min. For the narG gene amplification, the cycling regime 224
was an initial step at 94°C for 1 min 30 s; followed by 36 cycles at 94°C for 30 s, 51°C minus 225
0.1°C per cycle for 1 min 15 s, and 72°C for 1 min 30 s. The program ended by a final 226
extension step at 72°C for 10 min. All the amplifications were done in an MJ Research PTC-227
100TM thermocycler. Amplifications were checked by electrophoresis (4 µl of PCR product in 228
1% agarose in 0.5×TBE buffer). 229
230
Terminal-Restriction fragment length polymorphisms (T-RFLPs) 231
Environmental DNA extracts were amplified with fluorescently labelled primers i.e. Eub-232
519F (5’-[6FAM] GTTTCAGCMGCMGCCGCGGT) and Eub-1390R (5’-[5Hex] 233
GTTTGACGGGCGGTGTGT), or narGf (5'- [6FAM] TAYGTCGGGCAGGAAAA-3') and 234
narGr (5'-[5Hex] TTTTCSTACCAGGTCGC-3'). The specificity of amplification was 235
checked and PCR products were purified using the High Pure PCR product purification kit 236
(Roche) according to the manufacturer's protocol. Two aliquots of the purified amplicons 237
were digested, one with 2 U HinfI and the other with StyI restriction enzymes (Promega), at 238
37°C for 2 h in a low adsorption microtube (Axygen) to limit the loss of T-RFs during the 239
different steps of the protocol. The quantity of digested DNA per reaction corresponded to 1/3 240
of a PCR reaction. The digested products were precipitated with 2 volumes of absolute 241
alcohol and 1/10 volume of 3M Acetate buffer pH 5.4. The mixture was then placed 242
overnight at -20°C, and centrifuged at 16400 g for 20 min at 4°C. The pellets were washed in 243
200 µL of 70% alcohol, centrifuged at 16400g for 10 min, and incubated for 20 min at 37°C. 244
The dried pellets were resuspended in 10 µL of ultrapure water and placed for 2 to 4 h in 245
darkness on melting ice. 246
The quantity of T-RFs to load on the sequencer was defined in preliminary tests to accurately 247
size the fragments (no signal saturation mainly). Aliquots of the digested products (1 µl) were 248
mixed with 9 µl of deionized formamide and ROX labelled GS400HD internal size standard. 249
T-RFs were separated and sized using an automated sequencer ABI Prism® 3130xl DNA 250
analyser (Applied Biosystems). The size of the T-RFs was estimated in reference to the 251
internal standard (Genemapper version 3.7 software, Applied Biosystems) which allowed 252
accurate sizing of the T-RF lengths. Because of the use of the GS 400HD internal standard, 253
the accuracy of the sizing of the T-RFs was good in between 50 bp and 400 bp. Thus only the 254
fragments within this interval were used for the data analyses. The sequencer detected all 255
fluorescent DNA fragments and background noise. The samples/formamide mixture and 256
partial digestions may generate signals that do not correspond to a true terminal restricting 257
fragment (T-RF). These potential artefacts were avoided by performing 3 replicates (i.e. 258
independent PCRs and independent digestions). These true replicates eliminated all 259
inconsistent peaks and increased the number of observed T-RFs per T-RFLP profile by 260
retaining any very small but consistently present peaks. Thus there was no need to apply a 261
minimal peak cut-off height. Background noise was determined by comparing the replicates 262
of the profiles of the peaks (Vandenkoornhuyse et al. 2003). By using this strategy, between 1 263
to 35 TRF and 1 to 27 TRF were detected respectively using HinfI and StyI. It should also be 264
underlined that the reproducibility was excellent in between replicates (i.e. maximum 265
divergence observed in terms of presence/absence was 9.5 %). However, we have noticed 266
important differences in the peak intensities. Even more problematic, we observed differences 267
in peak intensities even for identical samples ran in different capillaries. Thus, only 268
presence/absence of a given T-RF was analysed. 269
270
Clone library construction and sequencing 271
The purified PCR products from 16S rRNA gene amplifications were cloned. The first step 272
was to add a non-complemented A to the amplicons using an A-overhanging post-273
amplification procedure. One unit of Taq DNA polymerase (Invitrogen), 1x concentrated Taq 274
DNA polymerase buffer (Invitrogen) and 0.1 mM of dATP was added to the purified 275
products, and incubated for 15 min at 72°C. The ligation mixture containing 1.5 µL of 3'A-276
tailed PCR products, 1.0 µL of pGEM-T vector, 5.0 µL of rapid pGEM-T buffer and 1 µL of 277
T4-DNA ligase (pGEM-T cloning kit, Promega) in a final volume of 10 µL was incubated 278
overnight at 4°C. Transformation of E. coli DH5α competent cells (Invitrogen) was carried 279
out following the manufacturer's instructions. The positive clones were screened by PCR 280
amplifications targeting sequences of the vector with the primers T-7 and SP-6. Cloned DNA 281
fragments (871 bp) were sequenced for the 2 strands on an automated sequencer ABI Prism® 282
3130xl DNA analyser (Applied Biosystems). This cloned library was built to highlight 283
whether or not an original microbial diversity exists in the studied aquifers. The purpose of 284
this analysis was thus not to compare bacterial communities among samples. 285
286
Sequence data analyses 287
All the contigs were produced using Sequencher 4.7 (GeneCodes) and all the nucleotides for 288
each sequence were checked by the software and corrected manually when required. After 289
cloning and sequencing, chimeras were eliminated by analyzing the sequences with the 290
chimera check program on the Ribosomal RNA Database website. A multiple alignment of 291
the checked 16S rRNA gene sequences was performed using ClustalX 1.81 (Thompson et al. 292
1997) and refined by eye. Each sequence was compared with the NCBI sequences using the 293
Basic Local Alignment Search Tool (BLASTn). 294
Three techniques were used to calculate the phylogenetic relationships between 48 known 295
bacterial sequences (i.e. the highest BLAST hits, closest phylogenetic neighbours and 296
additional sequences belonging to the different bacterial phyla) and the 107 environmental 297
sequences. These were (i) phenetic reconstruction using the Kimura 2-parameters (K2P) 298
distance model and clustering using the neighbor joining (NJ) algorithm (Saitou and Nei 299
1987) with Clustal X 1.81; (ii) maximum parsimony (MP) reconstruction (Swofford 1993) 300
done by a heuristic tree search with tree bisection and reconnection (TBR) as swapping 301
algorithm and the use of 500 replicates of random addition of sequences to find the shortest 302
tree and (iii) maximum likelihood (ML) reconstruction using the GTR+I+G distance model, 303
selected from modeltest analyses (Posada and Crandall 1998). The MP and ML Phylogeny 304
were calculated using PAUP 4.0β10 (Sinauer associates). Bootstrap support at the nodes was 305
estimated from 500 pseudo-replicates for MP, 100 for ML and 1000 replicates for the NJ 306
phylogenies. The chosen outgroup was an uncultured Crenarchaeota (AJ347774). 307
308
Patterns of microbial community analyses 309
The information provided by the different T-RFs was combined by applying a multivariate 310
approach based on principal component analysis (PCA). Non-centred PCAs were calculated 311
because they maintain the mean differences between variables (i.e. frequency of observation 312
of each T-RF, Vandenkoornhuyse et al. 2003). The statistical reliability of the data was 313
determined from the PCAs by computing confidence ellipses and stars joining the gravity 314
centre to each dot of the considered modality in the vectorial space (Sokal and Rohlf 1995). 315
The PCA analyses were implemented with the ADE-4 software package (Thioulouse et al. 316
1997). 317
318
Nucleotide sequence accession numbers. 319
The 16S rRNA gene sequences recovered in this study were deposited in the GenBank 320
nucleotide sequence database under the accession numbers FJ429673 to FJ429781. 321
322
Community comparisons 323
Genetic diversity (hereafter meaning species richness) was estimated using the Shannon index 324
H’. The proportion of species i in relation to the total number of species (Pi) was calculated, 325
and then multiplied by the logarithm of this proportion (log2 Pi). The resulting product was 326
summed across species, and multiplied by -1: 327
(1) 328 329
where Pi is the frequency of a given T-RF. This synthetic index was used to compare the 330
species richness of the nitrate-reducing communities in relation to the different forcing 331
variables. 332
The Morisita-Horn index provides a similarity measurement based on presence-absence data 333
only (Magurran 1988). This index is not influenced by sample size or richness (Wolda, 1980). 334
The Morisita-Horn index was calculated as follows: 335 (2) 336 337 CmH= 2
∑
i= 1 n (ani×bni)( da+db) ( aN×bN ) H'=−∑
i=1 n Pi×log2Pi;where CmH is the Morisita-Horn index of similarity, N is the total number of species for 338
communities A and B; aN and bN are the total number of individuals of all species collected 339
from community A and B, respectively; ani and bni are the number of individuals of the ith 340
species collected from community A and B, respectively. The denominator incorporates two 341
terms which are defined as: 342
(3) 343
and
344
This index was used to compare sample pairs such as two campaigns for a given depth and 345
two depths for a given campaign. The index was calculated using EstimateS software 346
(Colwell 2005). The Morisita-Horn index ranges from 0 (no congruence between samples) to 347
1 (full congruence). As species abundance is taken into account, the index of communities 348
containing the same species but in different abundances will be less than 1 (Heijs et al., 2006; 349 Juottonen et al., 2005). 350 351
Results
352 353 Hydrogeology/Hydrochemistry 354 Hydrogeology 355The water-table fluctuation depth ranged from 2.1 to 6.1 m below the soil surface (Fig. 1) 356
during the 2.4 years of monitoring. The hydrological year 2004/2005 was relatively dry. The 357
highest water-table level was 4.2 m during December 2004. The recharge period during the 358
following year (2005-2006), was relatively long with a slow water table increase during 359
winter and a final peak during spring (highest level 2.9 m during March). In comparison, the 360
recharge process was greater during winter of the final hydrological year (2006-2007), the 361
level of the high water table ranging from 3.8 to 2.1 m from January to March. Comparison 362 2 S = i 2 i bN bn = db
∑
1 2 S = i 2 i aN an = da∑
1with long-term chronicles revealed that the first two monitoring years could be considered as 363
relatively dry (results not shown). 364
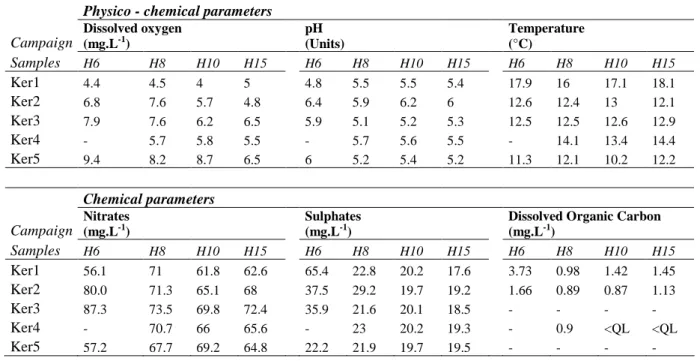
Groundwater chemistry 365
The groundwater was characterized by constant temperature, slight acidity (Tab. 1), low total 366
organic carbon concentrations and high nitrate concentrations (Tab. 1). For the sake of clarity, 367
we mainly used two depth measurements as a reference to the variably-saturated zone (6 m 368
depth) and the permanently-saturated zone (15 m depth). Two chemical trends were apparent 369
within the data set: a relatively stable chemical composition in the permanent aquifer (15 m 370
depth) and time-related chemical variability in the water-table fluctuation zone (6 m depth) 371
(Fig. 1, Tab. 1). Such evolution is characteristic of this catchment. It was observed for several 372
years along the piezometer plots replicates placed in the hillslope (Legout et al. 1997; Rouxel 373
et al. 2011). 374
Groundwater samples at 6 m depth showed variations in chloride concentrations ranging from 375
17.7 mgL-1 (12/20/2006) to 47.2 mgL-1 (01/27/2005) (Fig. 1). These variations were also 376
correlated with nitrate (∆=31.2 mgL-1), sulphate (∆=43.2 mgL-1) and dissolved oxygen (∆=5 377
mgL-1) concentrations (Tab. 1), and were closely linked to the hydrological fluctuations. The 378
highest chloride, nitrate and sulphate concentrations were observed during the low water 379
period (the whole 2004-2005 cycle) and the lowest concentrations were observed at the 380
beginning of the recharge period (January-February 2006 and January 2007). 381
A slight vertical gradient was noted for oxygen, with relatively higher concentrations at 6 and 382
8 m depths (Tab. 1). The hydrological cycle was also characterized by higher oxygen 383
concentrations at all depths during the periods of high water table (Ker3 and Ker5). 384
385
Purge effect 386
The bacterial cell counts were estimated by flow cytometry. The number of cells ranged from 387
2.3 105 to 2.5 106 per mL and did not show any clear gradient with depth (Fig. S2 in 388
Supplementary material). Comparison of the cell counts before and after purging the borehole 389
revealed modifications related to purging i.e. a decrease in bacterial cells at 6, 8 and 10 m. 390
However, only slight differences were apparent between T-RFLP analyses of the community 391
structure of free-living bacteria before and after the purges (Fig. S3 in Supplementary 392
material). Homology in diversity signatures among sample pairs ranged 78% to 98%. Thus, 393
ellipses drawn on the PCA vectorial space overlapped considerably indicating no significant 394
statistical differences. Heterogenity between true replicates was so low that our results 395
suggested that the community of free-living bacteria analysed in each sample could be 396
considered as representative of the groundwater community. It also confirms the reliability of 397
the sampling design. 398
399
Phylogenetic analyses 400
A sequence analysis of a fragment of the 16S rRNA genes was performed to better understand 401
the phylogenetic diversity of microorganisms in groundwater. The aim of this analysis was 402
not to compare communities. Accordingly, the sequencing depth was not the same in all the 403
samples. Twenty seven different phylotypes were obtained (Fig. 2). The resulting rarefaction 404
curves (not shown) indicated that the number of phylotypes was probably under-estimated. 405
Strikingly, 6 of these 27 phylogenetic species did not belong to a known class or phylum 406
(phylotypes 1, 2, 3, 6, 9, 11; Fig. 2). Most of the observed phylotypes in the Proteobacteria 407
phylum were also new. Only 6 of the 27 phylotypes (phylotypes 5, 14, 16, 17, 20, 24; Fig. 2) 408
displayed a high level of homology with known bacteria. The diversity at the Kerrien soil-409
aquifer interface seemed to be original and possibly specific to this environment. This could 410
result from (i) the use of new primers (Vandenkoornhuyse et al. 2007) not widely used up to 411
date and a related bias in the knowledge , (ii) the very limited number of studies of microbial 412
diversity published for this particular environment. The diversity of soil microorganisms is 413
now better understood. If the detected microorganisms had colonized the aquifer habitat after 414
percolation from the soil surface, a more classical bacterial diversity would be expected. The 415
bacterial communities at 6 m contained mainly α-, β-, and γ- proteobacteria phylotypes which 416
are closely related to Pseudomonas and to a Rickettsiella known to be abundant in soils. None 417
of the results obtained during sub-sampling of the 16S rRNA gene sequences contradicted the 418
hypothesis that bacterial community composition should be modified with depth or that the 419
microbial community at 6 m would be more closely connected to the soil community than 420
microbial communities from deeper samples. 421
422
Comparisons of microbial communities based on 16S rRNA gene diversity signatures 423
T-RFLP analyses provide an interesting approach for assessing the microbial diversity and 424
dynamics of microbial communities that occur temporally or spatially in response to 425
environmental perturbations (Liu et al. 1997).The 2 enzymes chosen to digest the 16S rRNAs 426
amplicons generated 720 different T-RFs. This high level of detected polymorphism suggests 427
the presence of considerable diversity. The experimental design was defined to address the 428
hypothesis of possible differentiation of the microbial community in connection to depth and 429
time. 430
Time (Fig. 3) affected the community in both the long and short term. As regards the 431
sampling date, the bacterial community compositions of the closest samplings (i.e. Ker4/Ker5 432
and Ker2/Ker3) showed greater similarity than those of the more distant (Ker1/Ker5). This 433
can be seen in the proximity of the Ker4 /Ker5 campaigns and in the strong difference 434
between Ker1 and Ker5 at 15 m (Fig. 3) and indicates a time-dependent community structure. 435
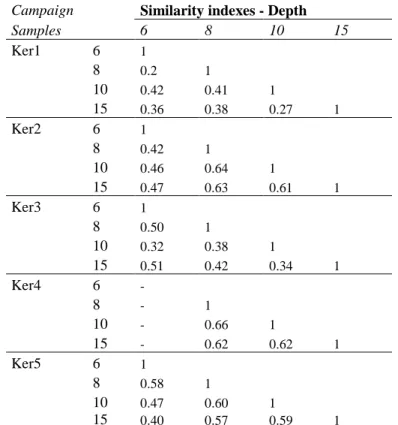
This effect is also apparent in the similarity index (Tab. 2a). Apart from some values obtained 436
during the Ker1 campaign, this index increased over time in the Ker3/Ker4 and Ker4/Ker5 437
campaigns. Maximum similarity (Tab. 2a) was found between Ker4 and Ker5 at 15 m, as also 438
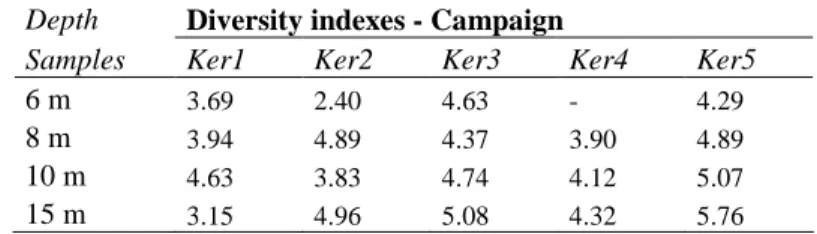
shown in Figure 3. The greatest diversity (Tab.3) was observed during the high water periods. 439
The Shannon index ranged from 4.4 to 5.1 at Ker3 and from 4.3 to 5.8 at Ker5 with the 440
highest values occurring at 15 m. The PCAs and the similarity indexes indicate that the 441
communities evolved towards more homogeneous structures during the monitoring period. 442
The diversity results indicate that short term variations in community structure occurred 443
during the high water periods. 444
The T-RFLP diversity signatures generated for each depth revealed different community 445
structures, those from 6 m and 8 m depth showing greater similarity than those from 10 m and 446
15 m. The highest similarity indexes were obtained between 8/10 and 15 m in each campaign. 447
For the Ker2 and Ker4 campaigns, the index rose to 60% similarity between the 8 m and 15 m 448
depths (Tab. 2b). Two different communities i.e. one at 6 m and the other at 8/10/15 m could 449
be distinguished from the similarity indexes. 450
451
narG gene diversity 452
The non-centred PCA did not indicate any clear structuring of the nitrate reducer community 453
in relation to depth (Fig. 4). However, some modifications of the nitrate reducer community 454
were independent of depth (i.e. the difference between the Ker1 & Ker2 communities and 455
those of Ker4 & Ker5, Fig 4). These results accord with the16S rRNA gene analysis which 456
indicated dynamic changes in the microbial community over time. 457
458
Recharge hydrological conditions 459
In this section, we investigated the nature of physical water transfer mechanisms and the 460
effects of these physical hydraulic recharge processes on chemical concentrations in order to 461
provide a clear framework to the investigation of the relationships between microbial 462
communities and hydrological conditions. Chemical composition, as regards nutrient and 463
oxygen concentrations, was relatively homogeneous, with time and depth, throughout the 464
entire groundwater section. No variation in the physico-chemical parameters (dissolved 465
oxygen and pH) was detected between the water table fluctuation zone (3-8 m) and the 466
permanently saturated zone (8-15 m) (Tab. 1). As mentioned above, we used the 6 and 15 m 467
depth as representative of the variably- and permanently-saturated zones. Slightly lower 468
oxygen concentrations were found at 15 m depth (Tab. 1) but the redox conditions remained 469
relatively oxidant whatever the depth and time. The Kerrien subsurface is characterized by a 470
homogeneous redox environment. In contrast it is apparent from the chloride concentration 471
that hydraulic processes are important and modify the anion concentration (Fig. 1). The 472
nitrate and sulphate concentrations also exhibit variations but these variations have no deep 473
impact on biological activity. Nitrates are always available and no reducing conditions 474
develop. A seasonal variation in Cl- was found at 15 m but was limited compared to that at 475
6 m. The high Cl- variations observed at 6 m were strongly related to water table fluctuations. 476
During periods when the water table was low, the chloride concentrations at 6 m were higher 477
than at any other depth whereas during periods when the water table was high, the chloride 478
concentrations at 6 m were lower than at any other depth (Fig. 1). The observed variations in 479
chloride concentration can be explained by the recharge processes. Different water 480
compartments i.e. mobile porosity and immobile porosity are mobilized during recharge 481
(Legout et al. 2007). Mobile porosity transfers solutes down to the water-table by advection 482
through the effect of gravity in the mobile pore volume. Immobile or matrix porosity 483
exchanges solutes with the mobile pore volume by diffusion. The mobile/immobile concept of 484
water fluxes allows interpretations of the observed chemical variations. 485
(i) At 6 m depth, at the beginning of the hydrological cycle, the immobile porosity contains 486
water with high chloride concentrations brought about by evapotranspiration during summer. 487
As the water-table rises, waters containing a high proportion of rainwater are transferred by 488
mobile porosity. This leads to saturation of the bulk volume of the water-table fluctuation 489
zone, and low solute concentrations. Solute mixing processes then occur by diffusion between 490
matrix porosity and mobile porosity, producing concentrations similar to those at 15 m. The 491
entire process is highly time-dependent. At 6 m depth, there is a seasonal variation from a 492
diffusive-dominant process during summer to an advective-dominant process during recharge 493
period. Whilst the first period is characteristics of matrix water, the second one is 494
characteristic of precipitation and soil water rapidly transferred from the soil. 495
(ii) At 15 m depth, seasonal variation is much more limited and mainly related to vertical 496
transfer from the variably saturated zone. Although this variation is also time-dependent, it is 497
mainly due to vertical transfer from the variably saturated zone to the permanently saturated 498
zone. This description provides an interesting framework to investigate the effects of physical 499
transfer on microbial communities since the redox parameters are mainly constant from 500
surface to depth and nitrates are always available whatever the conditions. In the 2 zones, 2 501
physical recharge processes occur. From diffusion to advection from soil in the variably-502
saturated zone, and moderate advective transfer from the variably- to the permanently-503
saturated zone are the main drivers of the environmental changes in the two superposed 504
ecosystems. The effects of seasonal changes in the hydrological conditions at 6 and 15 m 505
depth on the microbial communities are investigated below. 506
507
DISCUSSION 508
1. Bacterial diversity characterization 509
The number of bacteria in the water samples was close to other measures in groundwater 510
environments (Pedersen 1997) with values ranging from 2 105 to 2 10 6 cells per milliliter (see 511
Fig. S2 in Supplementary material). These numbers are clearly less than those found in soil 512
environments and correspond only to unattached bacteria. It has been estimated that 1010 513
prokaryote microorganisms can coexist in one gram of soil (Torsvik et al. 1990) 514
corresponding to total community of attached and pelagic bacteria. The difference observed 515
can be explained by (i) the absence of the attached microorganisms in our samples and by (ii) 516
the low total organic carbon content of groundwater samples, as in the Kerrien aquifer. The 517
bacterial diversity was surprisingly high in that at least 27 different phylotypes were found 518
(Fig. 2) which probably represented a subset of the real diversity in this environment. 519
Saturation was not reached on the rarefaction curves. Our results are in agreement with other 520
studies mainly performed on porous aquifers where β and γ Proteobacteria predominated 521
(Bordenave et al. 2007, Detmers et al. 2004, Dojka et al. 1998, Hess et al. 1997, Reardon et 522
al. 2004, Rodríguez-Martínez et al. 2006). It might be possible that Archaea were present in 523
our environmental DNAs since Archaea have recently been shown to predominate over their 524
better known bacterial counterparts during ammonia oxidation (the first step of nitrification) 525
in pristine aquifers (Leininger et al. 2006). Contrary to expectations based on the literature 526
(LaMontagne et al. 2003), a greater diversity of free-living bacteria was observed at 10 and 527
15 m than at 6 m. In fact, LaMontagne et al. (2003) who showed a decline in bacterial species 528
richness with depth, compared bacterial communities in the subsurface soil and the vadose 529
zone (1-4 m). In our study, the subsurface soil was not taken into account and the variably 530
saturated zone (3-8 m) was compared with the permanently saturated zone (8-15 m). 531
2. Relationships between nitrate reducing community and nitrate concentrations 532
A heterotrophic lifestyle is mundane in micro-organisms in nature. Heterotrophic nitrate 533
consumption was demonstrated in a similar environment in a previous study (Legout et al. 534
2007). The main electron acceptor in the Kerrien aquifer is nitrate which is available 535
irrespective of depth and time (Tab. 1). 536
The absence of a clear differentiation of the nitrate-reducing community with depth cannot be 537
attributed to the sampling approach. No difference was found before and after the purge (i.e. 538
true replicates) of the pan-flute piezometers (Fig S3 in Supplementary material). The stability 539
of nitrate reducing communities can be attributed to the chemical concentration of minerals, 540
in particular the high nitrate concentration and very low amount of carbon which remained 541
homogeneous throughout the water column. We suggest that this homogenous oligotrophic 542
status is the main driver of this community stability. It is in agreement with other findings 543
(Rivett et al. 2008). Along with that, we observed a contrasting pattern of divergence in the 544
nitrate reducer community between different sampling campaigns only in the first sampling at 545
6 m. This sample was characterized by a low NO3-/Cl- ratio (1.4) compared to the other 546
campaigns (~3). Chloride is known to be a conservative element and is only influenced by 547
physical processes such as evaporation or dilution (i.e. mixing). The absence of a concomitant 548
decrease in chloride implied that the ‘low’ nitrate concentration was due to nitrate reducer 549
activity. The T-RFLP analysis only indicates the diversity of free-living bacteria and not their 550
activity. 551
3. Influence of seasonal variations of physical recharge processes on community 552
structure 553
The water pumped from a well is not representative of all the groundwater present around the 554
well, but only of the mobile water. Water which is more strongly bound to rock, especially 555
within the micropores (De Marsily 1994), may constitute an active part of the groundwater, 556
from a biological point of view, as observed in similar sites (Ayraud et al. 2008, Legout et al. 557
2005, Tarits et al. 2006). The relative contribution of mobile vs immobile water from a given 558
bacteria in water samples from highly permeable layers may over-represent the free-living 560
bacteria (Goldscheider et al. 2006). However the diversity within our true replicates (i.e. water 561
sample before and after pumping for a given piezometer) indicate that the purge had no effect 562
on community structure (Fig. S3 in Supplementary material). From this it is concluded that 563
the free-living bacteria in water might be a proxy of the bacteria in aquifers. 564
The relationships between microbial populations and their environment are often complex and 565
non-linear (Palumbo et al. 2004). In the case of the Kerrien aquifer, the distribution of 566
bacterial diversity is related to environmental characteristics expressed as seasonal variations, 567
as shown in Figure 4. Since the physico-chemical parameters (i.e. pH, dissolved oxygen) 568
remain stable through time especially at 15 m, the composition and structure of the bacterial 569
community in the subsurface groundwater should thus be driven mainly by hydrological 570
conditions, i.e. physical recharge processes described above. The effects of large seasonal 571
variability at 6 m depth and limited variability at 15 m depth are presented below. The effect 572
of the vertical contrast between the variably- and permanently-saturated zones is investigated 573
in section 4. 574
Effect of seasonal physical processes on time-related bacterial diversity (6 m depth): An 575
increase in microbial diversity was observed in the fluctuation zone during high water table 576
periods (Tab.3). During low water table periods, the decline in chloride concentration was 577
concomitant with a decrease in diversity. The chloride concentration at 6 m depth was 578
strongly related to diffusion/mixing and dependent on microporosity, as explained above. 579
Chloride diffusion might also be concomitant with bacterial diffusion. During subsurface 580
bacterial transport, bacteria can passively migrate with the ambient groundwater but they also 581
can attach to or detach from the solid matrix and flow or swim along a chemical gradient, 582
(Fenchel and Finlay 2004). In oligotrophic environments, chemotaxis can be a very important
583
transport mechanism (Ginn et al. 2002). This active process is however oriented and 584
chemotaxis is generally related to food availability which could be relevant when moving 585
from reduced conditions of micro-porosity to oxygen-rich macro-porosity. The cyclic 586
hydrological stresses are expected to induce a seasonal variation through advective transport, 587
which allows chemotaxis when the water content is sufficiently high to create a continuous 588
water film (Schaefer et al. 1995), and to limit transport conditions governed by capillary 589
forces when the water content is low (Huysman and Verstracte 1993). This variation may 590
explain the short-term changes in diversity apparent from the T-RFLP diversity signatures of 591
the 16S rRNA gene amplicons. The increase in diversity during high water periods might be 592
related to an introduction of bacteria from the soil. As explained above, during this period 593
there is a large introduction of precipitation water which has been rapidly transferred from the 594
soil to the variably-saturated zone. 595
Effect of seasonal physical processes on depth-related bacterial diversity (15 m depth): The 596
physical processes are different in the deeper zone. The weathered granite is constantly 597
saturated with water and therefore the bacteria are not subjected to cyclic hydrological stress. 598
The periods of high water are characterized by increased diversity and a ‘blending’ of the 599
bacterial communities along the water column. Comparisons of the communities at 6 m and 600
15 m during the periods of high water in the different campaigns (Ker3 and Ker5 samples) 601
revealed greater homogeneity than during the periods of low water when discrimination 602
between 6 m and 15 m was easier (Tab. 2b, Tab. 3). This variation in diversity can be 603
explained by a mixing of non-native and native species. Indeed, almost the same number of 604
bacterial cells was found at 15 m and 6 m (Fig. S2 in Supplementary material). A connection 605
between the bacterial communities at 6 m and 15 m results from the occurrence of vertical 606
fluxes of solutes and bacteria during the recharge process. The long distance passive dispersal 607
of bacteria is facilitated by their small size. 608
4. Structuring of the microbial communities in the variably- and permanently- saturated 610
zones (influence of depth) 611
We here discuss the microbial structuring in the hydrologically contrasted zones showing 612
highly variable conditions and stable conditions. Stable conditions are generally associated 613
with an increase in diversity, whereas disturbed environments lead to the outgrowth of 614
dominant adapted populations (Haack et al. 2004, Torsvik et al. 2002), which can result in an 615
‘epidemic’ population structure […] when a successful individual arises and increases 616
rapidly to produce an epidemic clone […] (Maynard-Smith et al. 1993). In fact,
617
environmental changes or perturbations might lead to higher infraspecific diversity and allow 618
the selection of more rapidly adapted genotypes, and the appearance of an ‘epidemic’ 619
population structure (e.g. Vandenkoornhuyse et al. 2001). 620
The results obtained for the vadose zone are in accordance with the hypothesis of increased 621
bacterial community diversity under stable conditions. The water table fluctuation zone 622
displays a specific community and a lower diversity (Fig. 3; Tab. 3). A few meters lower, the 623
communities at 15 m depth present higher diversity related to seasonal mixing with the more 624
specific bacteria from the variably saturated zone. 625
This compartmentalization with depth over time is apparent as a clear structuring of the 626
bacterial communities (Fig. 3). Microbial interactions may also contribute to the community 627
structure but little is known about the species interactions that occur within microbial 628
communities during transport processes (Balkwill et al. 1998). Our results do not confirm a 629
potential interaction during transport but instead emphasize the potential ‘mixing’ of bacterial 630
communities from two different environments. 631
632
The estimates of bacterial diversity and comparisons of community composition along a depth 633
community structuring. Despite the relative similarity of the physico-chemical conditions 635
over time, the bacterial communities could be differentiated whatever the depth. This suggests 636
that bacterial community structure and diversity were influenced by the physical processes of 637
water migration. They might also be explained by local competition between microorganisms 638
which could result in differentiation of the communities over time and a subsequent drift in 639
community composition. The physical transport induced by the recharge process would lead 640
to a higher diversity in the permanently saturated zone, even several meters below the zone of 641
water table variation. Our results suggest that the physical processes of water fluxes in the 642
aquifer play an important role in bacterial community structure. 643
The investigated site presents rather specific characteristics such as a water table depth which 644
remains relatively shallow and fluctuates rapidly (Martin et al., 2004). Various kinds of 645
geological formations, vadose thickness and heterogeneity would lead to various influences of 646
physical processes and water transfer kinetics. However, the recharge mechanisms can be 647
considered as ubiquist and the overall characteristics of the hydrological cycle in the upper 648
part of the aquifers may concern a large number of various kinds of aquifers. More precisely, 649
the contrast between the permanently- and the variably-saturated zone, the seasonal effects of 650
diffusion and advection in the variably-saturated zone, and the seasonal connection of the 651
variably-saturated zone with the soil water may constitute a major driver to microbial 652
community structuring in many aquifers. Further studies should be however carried out to 653
asses to which extent the observed microbial patterns extend to other aquifers. 654
655 656
Acknowledgments 657
This work was supported by the CNRS ‘programme de recherche ECCO-PNBC’ and by the 658
ANR Biodiversité (ANR InBioProcess Project). The authors are grateful to Pierre Marmonier, 659
Théodore Bouchez, Georges Barbier, Lionel Ranjard, Flavia Nunes, for helpful discussions; 660
Odile Hénin for analytical work; Diana Warwick for improvement of an earlier version of the 661 manuscript. 662 663 REFERENCE 664
Ayraud V, Aquilina L, Labasque T, Pauwels H, Molenat J, Pierson-Wickmann AC, Durand 665
V, Bour O, Tarits C, Le Corre P, Fourre E, Merot P & Davy P (2008) 666
Compartmentalization of physical and chemical properties in hard-rock aquifers deduced 667
from chemical and groundwater age analyses. Appl Geochem 23:2686-2707. 668
Balkwill DL, Murphy EM, Fair DM, Ringelberg DB & White DC (1998) Microbial 669
communities in high and low recharge environments: implications for microbial transport 670
in the vadose zone. Microbial Ecol 35:156-171. 671
Bordenave S, Goñi-Urriza MS, Caumette P & Duran R (2007) Effects of heavy fuel oil on the 672
bacterial community structure of a pristine microbial mat. Appl Environ Microbiol 73: 673
6089–6097. 674
Bougon N, Aquilina L, Briand MP, Coedel S & Vandenkoornhuyse P (2009) Influence of 675
hydrological fluxes on the structure of nitrate-reducing bacteria communities in a peatland. 676
Soil Biol Biochem 41: 1289 – 1300.
677
Chapelle FH (2000) The significance of microbial processes in hydrogeology and 678
geochemistry. Hydrogeol J 8:41-46. 679
Christensen TH, Kjeldsen P, Bjerg PL, Jensen DL, Christensen JB, Baun A, Albrechtsen HJ 680
& Heron G (2001) Biogeochemistry of landfill leachate plumes. Appl Geochem 16:659-681
718. 682
Chèneby D, Hallet S, Mondon A, Martin-Laurent F, Germon JC & Philippot L (2003) Genetic 683
characterization of the nitrate reducing community based on narG nucleotide sequence 684
analysis. Microbial Ecol 46:113-121. 685
Colwell RK (2005) EstimateS: Statistical estimation of species richness and shared species 686
from samples. Version 7.5. User's Guide and application published at: 687
http://purl.oclc.org/estimates. 688
De Marsily G (1994) Hydrogéologie : Comprendre et estimer les écoulements souterrains et 689
le transport de polluants. Paris, Ecole des Mines de Paris. 690
De Vries JJ & Simmers I (2002) Groundwater recharge: an overview of processes and 691
challenges. Hydrogeology Journal 10: 5–17. 692
Derby N & Knighton R (2001) Field-scale preferential transport of water and chloride tracer 693
by depression-focused recharge. J Environ Qual 30:194–199. 694
Detmers J, Strauss H, Bergmann U, Knittel K & Kuever J (2004) FISH shows that 695
Desulfotomaculum spp. are the dominating sulphate-reducing bacteria in a pristine aquifer.
696
Microbial Ecol 47:236– 242.
697
Dojka MA, Hugenholtz P, Haack SK & Pace NR (1998) Microbial Diversity in a 698
Hydrocarbon- and Chlorinated-Solvent-Contaminated Aquifer Undergoing Intrinsic 699
Bioremediation. Appl Environ Microbiol 64:3869-3877. 700
Dunn AM, Silliman SE, Dhamwichukorn S & Kulpa CF (2005) Demonstration of microbial 701
transport into the capillary fringe via advection from below the water table. J Hydrol 702
306:50-58. 703
Fenchel T & Finlay BJ (2004) The ubiquity of small species: patterns of local and global 704
diversity. BioScience 54:777-784. 705
Fisk MC, Ruether KF & Yavitt JB (2003) Microbial activity and functional composition 706
among northern peatland ecosystems. Soil Biol Biochem 35:591-602. 707
Fretwell BA, Burgess WG, Barker JA & Jefferies NL (2005) Redistribution of contaminants 708
by a fluctuating water table in a micro-porous, double-porosity aquifer: Field observations 709
and model simulations. J Contam Hydrol 78:27-52. 710
Gibert J (1994) Basic attributes of groundwater ecosystems and prospects for research. In: 711
Groundwater Ecology (eds J Gibert, JA Stanford & DL Danielopol) pp 571. Academic
712
Press, San Diego, CA. 713
Ginn TR, Wood BD, Nelson KE, Scheibe TD, Murphy EM & Clement TP (2002) Processes 714
in microbial transport in the natural subsurface. Adv Water Resour 25:1017-1042. 715
Goldscheider N, HunkelerD & Rossi P (2006) Review: Microbial biocenoses in pristine 716
aquifers and an assessment of investigative methods. Hydrogeol J 14:926-941. 717
Griebler C & Lueders T (2009) Microbial diversity in groundwater ecosystems. Freshwater 718
Biology 54: 649-677.
719
Griebler C, Stein H, Kellermann C, Berkhoff S, Brielmann H, Schmidt S, Selesi D, Steube C, 720
Fuchs A & Hahn HJ (2010) Ecological assessment of groundwater ecosystems – Vision or 721
illusion? Ecol eng 36:1174-1190. 722
Haack SK, Fogarty LR, West TG, Alm EW, McGuire JT, Long DT, Hyndman DW & Forney 723
recharge – influenced chemical gradients in a contaminated aquifer. Environ Microbiol 725
6:438-448. 726
Haria AH & Shand P (2004) Evidence for deep subsurface flow routing in forested upland 727
Wales: implications for contaminant transport and stream flow generation. Hydrol Earth 728
System Sc 8:334-344.
729
Harvey RW, Kinner NE, MacDonald D, Metge DW & Bunn A (1993) Role of physical 730
heterogeneity in the interpretation of small-scale laboratory and field observations of 731
bacteria, microbial-sized microsphere, and bromide transport through aquifer sediments. 732
Appl Environ Microbiol 29:2713-2721.
733
Heijs SK, Aloisi G, Bouloubassi I, Pancost RD, Pierre C, Sinninghe Damste JS , Gottschal 734
JC, van ElsasJD & Forney LJ (2006) Microbial Community Structure in Three Deep-Sea 735
Carbonate Crusts. Microbial Ecology 52: 451–462 736
Hess A, Zarda B, Hahn D, Häner A, Stax D, Höhener P & Zeyer J (1997) In situ analysis of 737
denitrifying toluene- and m-xylene-degrading bacteria in a diesel fuel-contaminated 738
laboratory aquifer column. Appl Environ Microbiol 63:2136-41. 739
Huysman F & Verstracte W (1993) Water-facilitated transport of bacteria in unsaturated soil 740
columns: Influence of cell surface hydrophobicity and soil properties. Soil Biol Biochem 741
25:83-90. 742
Juottonen H, Galand PE, Tuittila ES, Laine J, Fritze H & Yrjälä K (2005) Methanogen 743
communities and Bacteria along an ecohydrological gradient in a northern raised bog 744
complex. Environ Microbiol 7: 1547–1557. 745
Korbel KL & Hose GC (2011) A Tiered framework for assessing groundwater ecosystem 746
health. Hydrobiologia 661:329-349. 747
LaMontagne MG, Schimel JP & Holden PA (2003) Comparison of subsurface and surface 748
soil bacterial communities in California grassland as assessed by terminal restriction 749
fragment length polymorphisms of PCR-amplified 16S rRNA genes. Microbial Ecol 750
46:216-227. 751
Legout C, Molenat J, Lebevre S, Marmonier P & Aquilina L (2005) Investigation of 752
biogeochemical activities in the soil and unsaturated zone of weathered granite. 753
Biogeochemistry 75:329-350.
754
Legout C (2006) Etude des mécanismes hydrologiques et biogéochimiques de la recharge des 755
nappes à surface libre. Mémoire de thèse CAREN Université Rennes 1 180pp. 756
Legout C, Molenat J, Aquilina L, Gascuel-Odoux C, Faucheux M, Fauvel Y & Bariac T 757
(2007) Solute transfer in the unsaturated zone-groundwater continuum of a headwater 758
catchment. J Hydrol 332:427-441. 759
Liu WT, Marsh TL, Cheng H & Forney LJ (1997) Characterization of microbial diversity by 760
determining terminal restriction fragment length polymorphisms of genes encoding 16S 761
rRNA. Appl Environ Microbiol 63:4516-4522. 762
Leininger S, Urich T, Schloter M, Schwark L, Qi J, Nicol GW, Prosser JI, Schuster SC & 763
Schleper C (2006) Archaea predominate among ammonia-oxidizing prokaryotes in soils. 764
Nature 442:806-809.
765
Madsen EL & Ghiorse WC (1993) Groundwater microbiology: subsurface ecosystem 766
processes. In : Aquatic Microbiology – An ecological Approach (Ed. TE Ford), pp 167-767
213. Blackwell Scientific Publication, Oxford. 768
Magurran AE (1988) Ecological diversity and its measurements. Princeton university press, 769
Princeton (New Jersey). 770
Massana R,Castresana J,Balagué V, Guillou L, Romari K, Groisillier A, Valentin K& 771
Pedrós-Alió C (2004) Phylogenetic and Ecological Analysis of Novel Marine 772
Stramenopiles. Appl Environ Microbiol 70:3528-3534. 773
Martin C (2003) Mécanismes hydrologiques et hydrochimiques impliqués dans les variations 774
saisonnières des teneurs en nitrates dans les bassins versants agricoles. Approche 775
expérimentale et modélisation. Rennes, Université de Rennes I. 776
Martin C, Aquilina L, Gascuel-Odoux C, Molénat J, Faucheux M & Ruiz L (2004) Seasonal 777
and inter-annual variations of nitrate and chloride in stream waters related to spatial and 778
temporal patterns of groundwater concentrations in agricultural catchments. Hydrol 779
Process 18:1237–1254.
780
Maynard-Smith J, Smith NH, O’Rourke M & Spratt BG (1993) How clonal are bacteria. Proc 781
Natl Acad Sci USA 90: 4384-4388.
782
Molénat J, Aquilina L, Pierson-Wickmann AC, Legout C, Marmonier P, Ruiz L, 783
Vandenkoornhuyse P, Bougon N, Gascuel C, Mérot P, Faucheux M, Labasque T, Hamon 784
Y & Hénin O (2007) Etude du rôle de l’interface sol-nappe sur les processus de Transfert 785
de solutés, d’érosion chimique et sur la diversité bactérienne dans un bassin versant 786
SONATE), Actes du colloque de clôture du programme Ecosphère Continentale. Toulouse, 787
5-7 décembre, 6 pages. 788
Murphy EM & Ginn TR (2000) Modeling microbial processes in porous media. Hydrogeol J 789