Ambiguous Statistics
-
How a Statistical Encodin
in the Periphery Affects Perception
by
Alvin Andrew
Raj
B.S., University of Washington (2006)
S.M., Massachusetts Institute of Technology (2008)
Submitted to the Department of Electrical Engineering and Computer
Science
in partial fulfillment of the requirements for the degree of
Doctor of Philosophy
at the
MASSACHUSETTS INSTITUTE OF TECHNOLOGY
February 2013
©
Massachusetts Institute of Technology 2013. All rights reserved.
Author ...
Department of Electrical Engineering and Computer Science
January 15, 2013
Certified by ...
...
...
Ruth Rosenholtz
Principal Research Scientist
Thesis Supervisor
Accepted by...
-
... ....LesliA. Kolodziej'ski
Chair, Department Committee on Graduate Students
Ambiguous Statistics
-
How a Statistical Encoding in the
Periphery Affects Perception
by
Alvin Andrew Raj
Submitted to the Department of Electrical Engineering and Computer Science on January 15, 2013, in partial fulfillment of the
requirements for the degree of Doctor of Philosophy
Abstract
Recent understanding in human vision suggests that the periphery compresses visual information to a set of summary statistics. Some visual information is robust to this lossy compression, but others, like spatial location and phase are not perfectly represented, leading to ambiguous interpretations. Using the statistical encoding, we can visualize the information available in the periphery to gain intuitions about human performance in visual tasks, which have implications for user interface design, or more generally, whether the periphery encodes sufficient information to perform a task without additional eye movements.
The periphery is most of the visual field. If it undergoes these losses of information, then our perception and ability to perform tasks efficiently are affected. We show that the statistical encoding explains human performance in classic visual search experiments. Based on the statistical understanding, we also propose a quantitative model that can estimate the average number of fixations humans would need to find a target in a search display.
Further, we show that the ambiguities in the peripheral representation predict many aspects of some illusions. In particular, the model correctly predicts how polar-ity and width affects the Pinna-Gregory illusion. Visualizing the statistical represen-tation of the illusion shows that many qualitative aspects of the illusion are captured by the statistical ambiguities.
We also investigate a phenomena known as Object Substitution Masking (OSM), where the identity of an object is impaired when a sparse, non-overlapping, and tem-porally trailing mask surrounds that object. We find that different types of grouping of object and mask produce different levels of impairment. This contradicts a theory about OSM which predicts that grouping should always increase masking strength. We speculate some reasons for why the statistical model of the periphery may explain
OSM.
Thesis Supervisor: Ruth Rosenholtz Title: Principal Research Scientist
Acknowledgments
I am immensely grateful to my doctoral thesis advisor, Ruth Rosenholtz, for being a terrific advisor - kind, patient, understanding, insightful, and posessor of a sense of humour that found my oddness amusing. She has taught me so much about science and life.
To Ted Adelson, my master's thesis co-advisor, I am also very thankful. His insight on vision, science, and how to think visually has been hugely influential, and his mentorship has been invaluable.
Many thanks to the rest of my thesis committee: Antonio Torralba, and Bill Freeman, for great insight into how to make this thesis at least an order of magnitude better with insightful comments, suggestions, and critiques.
In writing this thesis, my wife, Patrice Metcalf-Putnam, has been patiently sup-portive, and has motivated me with daily rewards of a puppy picture for each com-pleted page. Thanks also to my mother, Julie, for being supportive and understand-ing. And to my brother, Allan, for teaching me about many odd and interesting things.
To Dieter Fox, Jeff Bilmes, Marina Meila and Amar Subramanya, thank you for getting me interested in research and for guiding me in my undergraduate studies. To Gregory Ferencko, thank you for helping me get acclimated to academics in the United States.
During my academic journey at MIT, I am privileged to have met and worked with brilliant collaborators: Kimo Johnson, Benjamin Balas, Jie Huang, Forrester Cole, and Livia Ilie. I also thank all my wonderful labmates for great discussions, lunch meetings, and the obligatory geeky escalation of ideas: Phillip Isola, Ce Liu, Yuanzhen Li, Lavanya Sharan, Nat Twarog, Roland Van den Berg, Krista Ehinger, Derya Akkaynak Yellin, Bei Xiao, Rui Li, Xiaodan Jia, Xuetao Zhang, Shuang Song. Many thanks to John Canfield for being a terrific lab administrator.
To my Harding roommates: Michael Bernstein, Oshani Seneviratni, Grace Woo, and Jenny Yuen, thanks for an unforgettable time, for making our cheap rental truly
amazing, and of course, bura. My deepest gratitude to all.
Contents
1 Introduction 21
1.1 O utline . . . . 21
2 Statistical Encoding in the Periphery 25 2.1 O utline . . . . 25
2.2 Why care about peripheral vision? . . . . 25
2.3 Isn't it just about acuity? . . . . 27
2.4 Visual Crowding . . . . 29
2.5 Coarse Representation of Visual Information . . . . 31
2.6 C onclusion . . . . 33
3 Visualizing Statistics 35 3.1 O utline . . . . 35
3.2 Texture Models as Compressed Representations of Visual Appearance 36 3.3 Stimuli Not Accurately Represented by the Portilla-Simoncelli Texture M odel . . . . 40
3.4 Visualizing Statistics in the Entire Visual Field . . . . 42
3.4.1 Example Syntheses . . . . 47
3.5 Related Work . . . . 50
3.6 Future Work . . . . 51
3.6.1 Convergence and Statistics . . . . 51
3.6.2 Space of statistics . . . . 51
3.6.4 End-Stops . . . .
3.6.5 Speed improvements . . . .
3.6.6 Further testing of model parameters . . . . .
3.7 Conclusion . . . .
4 Visual Search
4.1 O utline . . . . 4.2 Puzzles of Visual Search . . . .
4.3 Relationship Between Peripheral Vision and Search 4.4 Experiment 1: Classic Visual Search . . . .
4.4.1 M ethod . . . .
4.4.2 R esults . . . . 4.5 Experiment 2: Mongrel Discrimination . . . .
4.5.1 Subjects . . . .
4.5.2 Procedure . . . . 4.5.3 R esults . . . . 4.6 D iscussion . . . . 4.6.1 Varying the number of items in each patch .
4.7 Future W ork . . . .
4.8 Conclusion . . . .
5 Modeling Visual Search
5.1 Outline . . . . 5.2 Introduction . . . . 5.3 Modeling Visual Search . . . . 5.3.1 Ideal vs Heuristic . . . 5.3.2 Saccade Length . . . . 5.3.3 Memory . . . . 5.3.4 Pooling Region Density 5.4 Experiment . . . . 5.4.1 Results and Discussion
54 55 55 55
. . . .
. . . .
5.5 5.6
5.4.2 Ideal vs Heuristic . . . 5.4.3 Saccade Constraints . 5.4.4 Memory . . . . 5.4.5 Pooling Region Density Future Work . . . . Conclusion . . . . 6 Visual Illusions 6.1 O utline . . . . 6.2 Pinna-Gregory Illusions . . . . 6.3 Prior work . . . . 6.4 Polarity . . . .
6.4.1 Experiment 1: Effects of Polarity . . .
6.5 Square Width . . . .
6.5.1 Experiment 2: Effects of Square Width
6.6 Square Tilts . . . .
6.6.1 Experiment 3: Effects of Tilt Angle . .
6.7 Visualizing the statistics of the illusions . . . . 6.7.1 Spirals vs Circles . . . .
6.8 Conclusion . . . .
Object Substitution Masking
7.1 Outline . . . .
7.2 OSM . . . .
7.3 Experiment 1: Collinearity 7.3.1 Method . . . .. 7.3.2 Results . . . .. 7.4 Experiment 2: Containment 7.4.1 Subjects . . . .. 7.4.2 Method . . . .. 7.4.3 Results . . . .. Grouping Grouping 83 84 84 85 86 86 87 87 89 91 93 95 100 103 104 106 108 110 111 119 119 120 122 122 123 124 124 124 125 77.5 Discussion . . . . 7.6 Conclusion . . . .
8 Applications and Conclusions 8.1 Outline . . . . 8.2 Efficient User Interactions . . .
8.2.1 Analysis of some designs
8.2.2 Future Work . . . .
8.3 Mazes ... ...
8.3.1 Future Work . . . . 8.4 Summary of Contributions . . .
A Images Used In Mechanical A.1 Gold Standard Dataset . . A.2 Color and Polarity . . . . A.3 Square Width . . . .
A.4 Shape of Elements . . . . A.5 Tilt of Squares . . . .
B Illusory Patch Statistics
B.1 Patches from Illusion . . . . Turk Experiment
. . . .
. . . .
126 128 129 129 130 130 132 132 133 133 135 135 140 144 147 150 155 155List of Figures
2-1 The fovea (blackened) occupies a very small area compared to the periphery, which constitutes everything else in the scene. . . . . 26
2-2 In the simulated acuity loss (b) of the original image in (a), the fixation was placed in the middle of the image. The simulation assumes loss of acuity as measured in [56] and that the image's width occupies approximately 12" v.a. horizontally (i.e., if you hold this image about 16 to 20 inches from your eyes). Notice that the simulation exhibits a lot of details in the scene, yet it is difficult to have been able to introspect all these details while fixating in the middle of the scene. . 28
2-3 In the simulated acuity loss (b) of the original image in (a), the fixa-tion was placed in the middle of the image. The simulafixa-tion assumes loss of acuity as measued in [56] and that the image's width occupies approximately 12" v.a. horizontally. The text in the simulated acuity loss is still easily readable yet when trying to read the original text, one must make multiple fixations. This indicates that the loss of acuity is not sufficient to account for why one needs to make those fixations. . 29
2-4 Crowding Demonstration . . . . 30
2-5 Comparison of a low resolution representation vs a feature statistics summary when limited to 1000 numbers. . . . . 32
3-1 Texture synthesis aims to create arbitrarily sized images that share the visual appearance of a sample texture. . . . . 37
3-2 Synthesis using the Heeger-Bergen method, by matching subband
his-tograms in a steerable pyramid decomposition [16] . . . . 38
3-3 Synthesis by matching subband histograms in a steerable pyramid de-com position [16] . . . . 39
3-4 Example Portilla-Simoncelli syntheses . . . . 40
3-5 The ambiguities in representing a single letter are few, but in complex stimuli with multiple letters, the statistics do not sufficiently constrain the synthesis so that the letter identities are preserved in the represen-tation . . . . 42
3-6 Simple contours do not have representations that allow much ambiguity in the m odel . . . . 43
3-7 More complicated contours are difficult for the statistics to represent unambiguously. Note that the synthesis produced an illusory T junc-tion in the middle, indicating that the model would have difficulty discriminating these rotated L-like structures from T junctions. . . . 44
3-8 (a-b) When all elements are black, the statistics are unambiguous about the color of the various oriented line segments. (c-d) When there are black and white line segments, the model hallucinated a white vertical line segment even though the original image had no such combination 45 3-9 Pooling regions are placed in a log-polar grid. . . . . 46
3-10 The texture tiling algorithm in progress . . . . 46
3-11 G iraffe . . . . 47
3-12 Parachute . . . .. . . . . 48
3-13 Street scene .. . . ... .. . ... .... . . . . 49
3-14 Ducks ... .. .. ... 50
3-15 Space of statistics in natural images . . . . 52
3-16 The "Healing Grid" illusion [22]. After staring at the center of the image for 30 seconds, the regularity appears to spread from the center of the grid. Perhaps priors in interpretations of ambiguous statistics drive this illusion. . . . . 53
3-17 The problem in representing end stops. . . . .
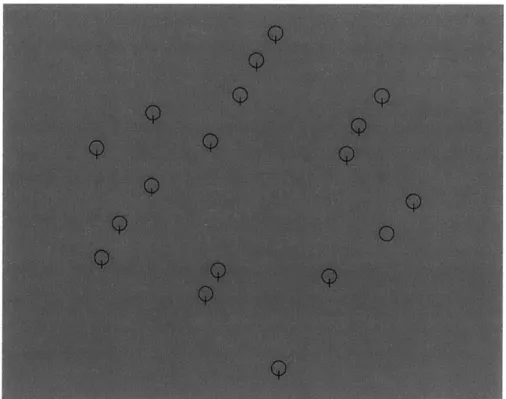
4-1 A typical visual search task: search for 0 . . . . 59
4-2 Mean reaction times (RTs) for correct target-present trials are shown, averaged across subjects, for each combination of condition and set size. The legend gives the slope of the RT vs. set size function for each condition, a typical measure of ease of search. . . . . 64
4-3 : Example target+distractor and distractor-only patches (columns 1 and 2) for five classic visual search conditions: (a) tilted among ver-tical; (b) orientation-contrast conjunction search; (c) T among L; (d)
o
amongQ;
and (e)Q
among 0. For each patch, we synthesized 10 images with approximately the same summary statistics as the original patch. Examples are shown in the rightmost 4 columns, at increased contrast, for visibility). In Experiment 2, observers viewed each syn-thesized image for unlimited time and were asked to categorize them according to whether they thought there was a target present in the original patch. . . . . 664-4 The correlation of the log of the search slopes to the log of the statistical discriminability (R2 - .99) . . . . 68
5-1 The model measures noisy estimates of "targetness" from overlapping pooling regions across the visual field. . . . . 74
5-2 Various methods of imposing a saccade cost . . . . 80
5-3 Visualization of pooling regions in a patch from the visual field, as the pooling region placement parameters are varied. . . . . 81
5-4 Results of some of the best fitting models . . . . 82
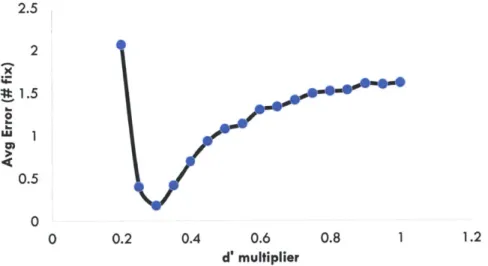
5-5 Error of the ideal decision model as experimental d/ is scaled . . . . . 83
5-6 Normalized Search Time for the Various Saccade Rules . . . . 84
5-7 Normalized Search Time for the Various Amounts of Memory . . . . 85
5-8 Normalized Search Time for the Various Amounts of Pooling Region D ensity . . . . 85
6-1 Pinna-Gregory Illusions . . . . 89
6-2 The Pinna Illusion. . . . . 90
6-3 The statistics in the black squares image in (a) are not ambiguous, which is why the synthesis in (b) reflects a good replication of (a). But when polarity variations are introduced in (c), the statistics of the black and white squares image show some ambiguity, as seen in the synthesis in (d). Some squares have both black and white edges, and there is more noise in the image. This suggests that the statistics allows some phase ambiguity and do not accurately represent the visual information in the original image. . . . . 93
6-4 The statistics in the white squares image in (a) produce syntheses that are fairly unambiguous as seen in (b), but the statistics allow more errors when polarity is varied on the lines in (c), as can be seen from the visualization of those statistics in (d). Notice that the synthesis hallucinates a connection from the bottom line to the top line. . . 94
6-5 White Squares diminish the illusory effect of the intertwining stimulus 95 6-6 One pair from the intertwining tilts polarity set . . . . 97
6-7 One pair from the spiraling tilts polarity set . . . . 98
6-8 A typical pairing from the gold standard questions. It should be obvi-ous which image looks more illusory. . . . . 99
6-9 Results from the polarity experiment on the intertwining images . . . 99
6-10 Results from the polarity experiment on the spiraling images . . . . . 100
6-11 (a) White squares with Intertwining Tilts. (b) shows a visualization of the magnitudes of the oriented subbands in the steerable complex pyramid of the white squares stimuli in (a). . . . . 101
6-12 W idth 1.0 . . . . 102
6-13 W idth 2.0 . . . . 102
6-14 W idth 3.0 . . . . 103
6-15 Results from the width experiment on the intertwining and spiraling im ages . . . . 104
6-16 When squares are aligned to the tangent of the ring they lie on, there
is reduced illusory percept. . . . . 105
6-17 Non-oriented subband of Figure 6-16 . . . . 106
6-18 Filling in the middle of the "square" with the alternate polarity of the sides roughly visualizes the oriented filter responses (as appropriately rotated). Speculatively, the middle line corresponds to "illusory" line segments that are aligned along the squares' tilt on each ring. These give the impression of longer tilted line segments along each "ring". . 107 6-19 Patches taken from applying various tilts to the squares of the spiraling illusion. From left to right: original patch, oriented subband (first derivative), and "bumps" or local maxima (i.e., thresholded second derivative) . . . . 108
6-20 Mean Line Length vs Tilt Angle . . . . 112
6-21 Relative Illusory Strength vs Tilt Angle . . . . 113
6-22 Visualization of the statistics in the intertwining illusion . . . . 114
6-23 Visualization of the statistics in the spiraling illusion . . . . 114
6-24 Visualization of the statistics in the white squares stimuli . . . . 115
6-25 Rings extracted from the intertwining image: original and synthesized 115 6-26 Rings extracted from the spiraling image: original and synthesized . . 116
6-27 Rings extracted from the white squares image: original and synthesized 116 6-28 Orientation Profile of "Linearized" Illusory Images. Because these im-ages are actually composed of concentric circles, their resulting orien-tation profiles are of lines with constant radius (x-axis) . . . . 117
6-29 Orientation Profile of "Linearized" Visualizations of Statistics from il-lusory Images. These synthesized images exhibit some properties of the percept from their respective original images. The orientation profile of the white-squares synthesis essentially resembles concentric circles, as per 6-28, while that of the spiraling and intertwining syntheses pro-duce orientation profiles that are consistent with spiraling or multiple oriented curves. . . . . 118
6-30 Stare at the red dot. It is difficult to classify which image is actually the spiral. They share highly similar visual statistics. . . . . 118
7-1 Object Substitution Masking . . . . 120 7-2 Each box represents a different hypothesis. The stimuli on display
activate various hypotheses about what object is present at a given location. These hypotheses have temporal inertia in order to be robust to noise, and their strengths slowly degrade in time. [28] . . . . 120 7-3 A trial where the mask was collinear with the target. . . . . 122 7-4 A trial where the mask was not collinear with the target . . . . 123 7-5 OSM impairs the non-collinear grouping more than the collinear grouped
stimuli. In this case, grouping produced less masking. . . . . 124 7-6 A trial where the mask was inside the target . . . . 125 7-7 A trial where the mask was outside the target . . . . 126 7-8 OSM impairs performance more when the four dots are inside the
tar-get item, indicating that containment grouping produce more masking. 127
8-1 (a) What can people tell about the GPS display? (b) Visualization of information available in the periphery, fixating on the car. . . . . 131 8-2 (a) The New York city subway map (b) Visualization of information
available in the periphery while fixating on "city hall". . . . . 131 8-3 (a) Stylized New York city subway map (b) Visualization of information
available in the periphery while fixating on "city hall". . . . . 132 8-4 (a) This maze is trivial to solve (b) Visualizing the statistics shows that
one can easily find a path from the start to the end without needing to move the fixation . . . . 133 8-5 (a) This maze is more difficult to solve (b) Visualizing the statistics
shows that one needs to make more fixations to figure out where a path leads... ... 134
A-2 Concentric Circles Alternating Polarity of Rings... A-3 Dots in Concentric Circles Alternating Polarity of Rings
136 . . . . 136
A-4 Concentric White Circles Concentric White Dots in Concentric Circles With E Concentric Circles With Concentric Circles With A-9 Unmodified Illusions . . A-10 Alternating Polarity in C( A-11 Alternating Polarity with A-12 Alternating Polarity with A-13 Alternating Polarity of Ri A-14 Positive Polarity in One
T
A-15 Positive Polarity in Two A-16 Positive Polarity in Two A-17 Width 0.5 . . . .. A-18 Width 1.0 . . . .. A-19 Width 1.5 . . . .. A-20 Width 2.0 . . . .. A-21 Width 2.5 . . . .. A-22 Width 3.0 . . . .. A-23 Squares (Unmodified Illu A-24 One Line . . . .. A-25 Two Lines . . . .. A-26 Three Lines . . . .. A-27 Three Lines, Middle Lin A-28 Double Triangle1
. . . A-29 Double Triangle 2 . . .A-30 Tilted 50 . . . . Is A-5 A-6 A-7 A-8 .ircle... Circles . . . . lack Lines . . . . Vhite Lines . . . . Vhite Lines 2 . . . . ... lor . . . . Multiple Colors . . . . Multiple Colors, Randomized Slightly ngs . . . . on e . . . . Tones . . . . Colors [oe.... . . . ioo... io)... Oppsie. Plat... .i.n. . . . . iOn)oit .P.la.r..t.y . . . . . . . . . . . . A-31 Tilted 100 137 137 138 138 139 140 140 141 141 142 142 143 143 144 144 145 145 146 146 147 147 148 148 149 149 150 150 151
A -32 Tilted 15 . . . .. 151 A -33 Tilted 200 . . . . 152 A -34 Tilted 25 . . . . 152 A -35 Tilted 300 . . . . 153 A-36 Tilted 35 . . . . 153 A-37 Tilted 40 . . . .. 154
B-I Two-Lines Spiral Tilt: Black-White . . . . 155
B-2 Visualization of the statistics from Figure B-1. Each column corre-sponds to a different autocorrelation width window. Larger windows will collect more spatial information. The different rows correspond to different randomly generated seeds. . . . . 156
B-3 Two-Lines Spiral Tilt: White . . . . 156
B-4 Visualization of the statistics from the Figure B-3. Each column cor-responds to a different autocorrelation width window. Larger windows will collect more spatial information. The different rows correspond to different randomly generated seeds. . . . . 157
Chapter 1
Introduction
Seeing is typically an active process. When watching a movie, reading, walking, or searching for keys, people move their eyes around to perform tasks. But sometimes, it isn't necessary to make many or any eye movements at all. Why do people need to move their eyes for some tasks, but not others? This thesis suggests the answer is that the periphery encodes enough summary information about the visual input so one does not need to make eye movements for some tasks, but the same information is insufficient for other tasks. Further, in this thesis, the type of summary information is hypothesized to be that of statistics computed on the visual field in overlapping regions that increase in size as they get further from the center of fixation. We show evidence supporting this hypothesis in visual search and in visual illusions.
1.1
Outline
In Chapter 2, the role of peripheral vision is revisited with recent understanding from human vision. This includes psychophysical studies on visual crowding, where researchers find that humans do poorly in identifying an object in the periphery when there are other objects flanking it. We examine a statistical model of peripheral vision that accounts for those results in crowding. Chapter 3 examines the statistical model discussed in Chapter 2. The representational capability of the model is investigated, and in addition, we propose an algorithm to visualize the information contained in
that statistical model.
In Chapter 4, we discuss visual search, a task where subjects are asked to find a target in a search display (i.e., find a tilted line among vertical lines). The key insight contributed in this thesis is that most of the search display is peripheral. Thus, peripheral vision is required to simply perform the task in pop-out search conditions (detecting a target at a glance), or is needed to guide eye movements to the target location. Given the prominent role peripheral vision plays in visual search, we examine whether the loss of information in the peripheral representation can explain why certain types of searches are easy or difficult. When people are asked to search for a target among some distractors, their reaction time depends on the type of search task involved. For example, the search for a tilted line among vertical is fast, but the search for a T among L is not. Puzzlingly, there are search asymmetries:
Q
among 0 is fast, but 0 amongQ
is slow. The discriminability of the target item to a distractor item has not sufficed as an explanation, because each target item is easily discriminable from any given distractor item. We show that this is the case, and that a measure of statistical discriminability of patches from search displays correlates well with search performance.Beyond correlations, we may make quantifiable predictions of search performance. In Chapter 5, a quantitative model based on the experimental results in Chapter 4 is proposed, and its performance evaluated. The model is a variant of an ideal saccadic targeter that saccades to the most likely target location. Various considerations common to modeling visual search and human vision are incorporated into the model: memory, saccade length preferences, pooling region density, and whether a heuristic instead of an ideal model is used to infer the most likely target location. The modeling results correspond well to human performance.
Visual illusions are often studied because we can gain insight into the visual sys-tem, by investigating instances where it seems to be broken. If the peripheral visual system loses a large amount of visual information, as is suggested in this thesis, there are likely many instances of visual stimuli where the summary information provided
of illusory stimuli - the Pinna-Gregory illusions. We show that a statistical view of the periphery predicts how various modifications of the illusion will affect the illusory strength, and that the visualization of the statistical information from the images exhibits many aspects of the illusions.
Thus far, we have discussed the periphery in the context of static stimuli and illusions. Another strange phenomena where performance in object identification is more severely affected in the periphery is that of object substitution masking (OSM).
OSM describes a form of masking where the presence of a sparse, non-overlapping,
and temporally trailing mask impairs the perception of an object when attention is distributed over a large region. The masking strength appears strongest in the periphery, though it is possible to elicit masking in the fovea as well. In Chapter 7,
we show that different types of groupings affect masking strength differently, contrary to the prediction by Moore and Lleras
[32]
that stronger grouping should lead to stronger masking. This suggests that a lower-level explanation other than "object files" may underlie some of the results in OSM. We also suggest a line of future work, expanding the static model to a spatio-temporal model of peripheral vision as a potential explanation for this phenomena. Further modeling work and psychophysical experiments are required to test whether such a model could explain OSM.In Chapter 8, we discuss some applications of visualizing the information available to peripheral vision to help design better user interfaces, and to understand why mazes are difficult or easy to solve. Some additional areas of future work are discussed, and we conclude with a summary of the contributions made in this thesis.
Chapter 2
Statistical Encoding in the
Periphery
2.1
Outline
In this chapter, we discuss why it is important to understand the peripheral visual system, discuss what is known about the periphery, then consider a model of periph-eral vision that explains the puzzling data about visual crowding in the periphery. The work presented in this chapter introduces research done in the Perceptual Science Group at MIT by Benjamin Balas, Ruth Rosenholtz, and Lisa Nakano [3], and is the background needed to understand the extension of that work that is presented in this thesis.
2.2
Why care about peripheral vision?
Why should anyone care about peripheral vision? In Figure 2-1 a circle in the center
of the image is blacked out, roughly occupying the area that the fovea would occupy (about 2' visual angle, assuming you were 25in from the image). The area occupied
by the fovea is tiny compared to the periphery. The importance of this observation
can be easy to overlook. Almost all of one's visual field is peripheral, and so under-standing how visual information is encoded in the periphery is necessarily important
Figure 2-1: The fovea (blackened) occupies a very small area compared to the pe-riphery, which constitutes everything else in the scene.
for understanding the human visual system.
There are many tasks which humans only need a single glance to perform, such as pop-out search [53], material perception [47], scene recognition [42], and animal vs no animal categorization [49]. In a single fixation, the visual area processed by the fovea is dwarfed by the periphery. Unless one is lucky enough to have fixated on a distinctive image feature that happened to be sufficiently informative for the task, the fovea would not contribute much useful information.
When looking at any particular scene, humans typically scan the visual environ-ment by fixating on one location, then saccading to the next, and so on. Information is gathered and processed during each fixation, but not during saccades [30]. This points to a fairly discrete algorithm that the visual system uses to make sense of the visual environment.
The need to make saccades even in reading this manuscript implies that the un-derlying encoding of the visual field is not uniform. If it were uniformly encoded, saccades would not serve a purpose because no new information would be gained by
fixating at a new location.
Not only does the periphery occupy most of the visual field, but as a consequence, the periphery may additionally encode global structures that span a large area. These global features have proven to be important for scene gist recognition [34].
Larson and Loschsky [25] find that the peripheral vision system is more impor-tant for scene recognition than the fovea. In an gaze-contingent display, they either imposed an artificial scotoma to their subjects to simulate the loss of the fovea, or blocked off peripheral vision. Under one of those two conditions, subjects were asked to categorize a number of scenes. Scene recognition performance of subjects with a
10" diameter scotoma in a 27"X27' display were only slightly worse than a control
condition where the entire scene was visible. In contrast, subjects with the periphery blocked off required a 20" diameter circle "fovea" visible to achieve similar perfor-mance.
2.3
Isn't it just about acuity?
Even after accounting for the visual area the fovea and periphery occupies, Larson and Loschsky find that performance was uneven for foveal vs peripheral processing of information. Clearly, the encoding of visual information in the fovea is different than in the periphery.
This is unsurprising given our everyday experience of simply not being able to tell exactly what's "out there" in our peripheral vision. The encoding of visual informa-tion in the periphery has been studied from a large number of perspectives and has shaped much of the classic understanding of peripheral vision - that acuity and color discriminability is worse as distance from the fovea increases.
Many studies on the retina have show that the density of photoreceptors decrease as eccentricity increases [43]. Having this understanding of peripheral vision, one could then simulate the expected information loss from peripheral vision by blurring an image with an appropriately sized filter at each location, depending on its distance to the simulated fovea [1].
V 'V "~~ "~' .~ VrV~'~
~t~
VV.~
V~"* V'VV~j. '.F!~{
(a) Original Image7.
7r
7,7-(b) Simulated Acuity Loss
Figure 2-2: In the simulated acuity loss (b) of the original image in (a), the fixation was placed in the middle of the image. The simulation assumes loss of acuity as mea-sured in [56] and that the image's width occupies approximately 12' v.a. horizontally (i.e., if you hold this image about 16 to 20 inches from your eyes). Notice that the simulation exhibits a lot of details in the scene, yet it is difficult to have been able to
The alligator raises one of its limbs to its mouth, in a classic "Oh my!" gesture, holding that pose for a few seconds. The alligator then hangs its head down, then looks away in the distance. The alligator seems to sigh, then looks back at the chess board. The alligator moves one of his pieces, checkmating Jon. The alligator looks at Jon reluctantly, then chomps Jon's king and chews on it slowly.
(a) Original Image
- o14e Of its I imbs t
y! "gesture, holding that pe e
a Te l Uatr then hangs it., hea donFte ,
ne otance. The alligator sees t mp ta t thchess board. The alligat
~
~
Jon. The al Ii~ia*~~'~efl~~psJon' a k in n wl
(b) Simulated Acuity Loss
Figure 2-3: In the simulated acuity loss (b) of the original image in (a), the fixation was placed in the middle of the image. The simulation assumes loss of acuity as mea-sued in [561 and that the image's width occupies approximately 12" v.a. horizontally. The text in the simulated acuity loss is still easily readable yet when trying to read the original text, one must make multiple fixations. This indicates that the loss of
acuity is not sufficient to account for why one needs to make those fixations.
Figure 2-2 shows an example of simulated peripheral acuity loss of a beach scene. What one might notice is that not much information is lost at all. Looking at one's visual environment shows crisp details that are not blurry in the periphery. To make this point clearer, notice that in Figure 2-3, where peripheral acuity loss is applied to an image of some text, that essentially all the words are still legible, yet we still need to move our eyes to read it. This indicates that perhaps the encoding in the periphery loses more than just acuity alone.
2.4
Visual Crowding
If not acuity, what might underlie this lack of ability to identify things or read words
in the periphery? There have been a large number of studies on a phenomenon known as visual crowding, where the ability to identify an object in the periphery is more difficult when it is flanked by distracting objects. See [27] for a literature review.
A
(a) Single Letter
BAV
(b) Three Letters
+
B
A
V
(c) Three Letters Spaced Apart Figure 2-4: Crowding Demonstration
When fixating on the plus in Figure 2-4 a, the isolated letter is easy to identify, but in (b), when the same letter is flanked by two distracting letters , it is more difficult to determine its identity. Bouma found that when the letters are spaced beyond approximately 1/2 the central target's distance from fixation (eccentricity), the performance is improved once again, as demonstrated in Figure 2-4c [4]. Further, when subjects are asked about what they saw in these crowded letter displays, they reported not seeing the central letter at all, or that they saw letter-like shapes made up of mixtures of parts from several letters [26, 29].
This is puzzling behavior, in which the visual system seems to retain much of the details necessary to perceive letters or letter parts, but not encode the information necessary to keep track of the locations of those details. The ease of recognizing an isolated target indicates that crowding is not simply due to reduced visual acuity. Instead, the visual system seems to lose additional information about the stimulus. Some researchers attribute this effect to excessive feature integration [37], and propose
that the visual information is jumbled within pooling regions that grow linearly with eccentricity (radius .5 * eccentricity), and are elongated radially from the fovea [50].
Letters are not the only type of object that is subject to lower identification per-formance when surrounded by flankers in the periphery. There is evidence that color, orientation, hue, and size are all subject to crowding [551. Sufficiently complicated objects may even crowd themselves [29]. Parsimony would prefer a simple explana-tion for this diverse set of stimuli that suffer crowding effects. It suggests a general mechanism that the peripheral visual system employs to process information, as op-posed to a special mechanism that activates whenever the visual system detects more than a single object present and messes up the visual information.
2.5
Coarse Representation of Visual Information
Why might the visual system represent information in such a manner that allows these
types of phenomena to occur? It is useful to consider how a vision system might be built with a constraint that there is a bandwidth limit for how much information may be processed through the pipeline at any given time. The human visual system seems to adopt an active vision approach to manage the information bottleneck.
To view a scene, humans actively fixate on areas that they want more detail on, while obtaining coarser information in the periphery, perhaps to guide the visual system in deciding where next to make an eye movement, and to give context for the details in the fovea. But what type of representation should the coarse encoding in the periphery use?
(a) Letters (b) Low Resolution (c) Statistical Summary
Figure 2-5: Comparison of a low resolution representation vs a feature statistics summary when limited to 1000 numbers.
Figure 2-5 shows what type of information would be contained in several types of compressed encodings limited to roughly 1000 numbers. In (b) the low-resolution encoding is able to preserve information about where the letters are in the display. In (c), a statistical representation based on a texture model proposed by Portilla and Simoncelli [41] makes location mistakes, but preserves information about letter fragments. In (c), it is difficult to know any particular letter's identity, but one can tell that the shapes in the image are letter-like stuff in the figure.
Balas, Nakano, and Rosenholtz [3] proposed that the visual system computes statistical summaries of visual information in local, overlapping pooling regions placed throughout the visual field. The model proposes that the visual system computes information equivalent to marginal and joint statistics of responses of V1-like oriented feature detectors across position, scale, and orientation based on the texture model proposed by Portilla and Simoncelli [41]. The details of the statistical encoding are discussed in detail in Chapter 3.
Balas et al measured subjects' ability to discriminate between the statistical sum-maries of stimuli in a 4-Alternative-Forced-Choice task. Please see the methodology in [3] for details. The performance in that task was compared against how well hu-mans could discriminate between those types of stimuli in a crowding task. The types of stimuli tested included various letters in varying fonts, different types of objects, and some symbols. They found that the performance in the statistical discrimination
task predicted performance in the crowding task of those classes of stimuli. This sug-gests that the information loss due to this compression predicts what types of stimuli are subject to reduced identification performance in the periphery, and further, how much that performance will be affected.
2.6
Conclusion
It is important to study and understand peripheral vision because the periphery comprises most of the visual field, and behaves in a seemingly odd manner, as shown by experiments in visual crowding.
If we take the bottleneck in information processing into account, this odd behavior could be understood as a side effect of an information compression effort by the peripheral visual system. Balas et al [3] propose and show that the texture model in Portilla-Simoncelli [41] captures much of the nature of compression that visual information undergoes for a single pooling region in the periphery for a number of objects and letters.
This work in this thesis extends the work by Balas et al, applying the peripheral model they propose to explain a number of phenomena, and proposing an algorithm to visualize the information in all the pooling regions so the information contained in the periphery as a whole may be examined. In the next chapter, we investigate the statistical encoding used in the model.
Chapter 3
Visualizing Statistics
3.1
Outline
In this chapter, the details of the statistical model discussed in Chapter 2 are explored. Our choice of statistics is a working hypothesis of the information that the visual system extracts in the periphery. We examine some methods of modeling the visual appearance of textures by characterizing a texture as: a set of marginal statistics from a pyramid decomposition (Heeger-Bergen [16]), or joint statistics from a steerable complex pyramid decomposition (Portilla-Simoncelli [41]).
The Portilla-Simoncelli texture model represents many types of real and artificial textures well, but does poorly at representing spatial location, phase, and makes some mistakes about complex shapes and images in general. We argue that these areas of poor representation are shared by the peripheral visual system, and so the statistics used in the Portilla-Simoncelli representation are a good candidate for a working hypothesis of the information that the visual system extracts in the periphery. In addition, we argue that it would be difficult to adapt non-parametric models of visual appearance to model how the periphery represents information, because it would be difficult for those models to make these kinds of mistakes. In particular, the non-parametric approaches have difficulty in hallucinating visual "stuff" not present in the original image, for example, a white vertical line, when the original image contained only black verticals and white horizontals.
Balas et al [3] suggest that the Portilla-Simoncelli texture model captures the information contained in a single pooling region in the periphery, and so synthesizing images that shared the same texture parameters effectively visualizes the information that the pooling region contained. Their work showed that the model can predict the information contained in a number of types of letter array stimuli and some object arrays.
Extending that initial work, in this thesis, we provide additional support for the conjecture that the model captures the same visual information as the peripheral visual system does. In particular, we find that the model makes similar errors that humans make in regards to phase and contour perception. Further, we propose a method to visualize the information in all the pooling regions in the visual field simultaneously.
The work in this chapter presents work that I conducted under the supervision of Ruth Rosenholtz. My contribution was in developing the algorithm to visualize the statistics in the entire visual field.
3.2
Texture Models as Compressed
Representa-tions of Visual Appearance
Texture synthesis is a technique that aims to produce a new, arbitrarily sized image that looks like a sample texture image. For example, given the small patch in Figure 3-1(a), the goal is to produce more of the same visual appearance, like in (b). In order to produce larger images that share the visual appearance, the texture synthesis algorithm either explicitly or implicitly defines a model of texture that it uses to synthesize a new image to match the underlying model. We examine two parametric texture models that encode the marginal statistics (Heeger-Bergen [16]) and joint statistics (Portilla-Simoncelli [41]) of oriented subbands from a steerable pyramid decomposition of the sample image.
(a) Sample (b) Desired Output
Figure 3-1: Texture synthesis aims to create arbitrarily sized images that share the visual appearance of a sample texture.
texture, the synthesis algorithm needs to produce the new image as though the same process that generated the sample texture also generated the new image. If the texture model manages to synthesize images that appear like the original sample, it has in a sense captured the nature of the stochastic process that generated the original sample. In the case of explicit, parametric texture models, the number of parameters in the model are typically much smaller than the number of pixels in the input image.
What visual information is lost if we only retain the parameters of a texture model? Because these are texture synthesis models, they provide methods for visualizing the information contained in the encoding. Consider the Heeger-Bergen texture model. It computes histograms of subbands in a steerable pyramid and synthesizes new textures iteratively matching the corresponding histograms from a random noise image. In addition to the subbands of the pyramid, the pixel histogram is also matched.
and Figure 3-3 is an example where it is very easy to distinguish the original from the synthesis. If images are represented as a set of histograms, then all images which share the same set of histograms form an equivalence class of images under that representation. Variations within that class correspond to the ambiguities that could arise from compressing the visual information to just those histograms. So, by looking at these syntheses, we can gain intuitions about the ambiguities inherent in this representation.
(a) Sample (b) Synthesized
Figure 3-2: Synthesis using the Heeger-Bergen method, by matching subband his-tograms in a steerable pyramid decomposition [16]
The Portilla-Simoncelli texture model on the other hand, computes joint statis-tics of subbands of a complex steerable pyramid. In particular, the shapes of the distributions of subband responses are measured in addition to joint statistics of the steerable complex pyramid. The joint statistics include correlations between orien-tations at any scale, correlations between neighboring scales, autocorrelations within subbands, and some phase statistics. Figure 3-4 show examples of texture synthesis with the Portilla-Simoncelli model. The syntheses seem to preserve extended struc-tures better, as compared against Heeger-Bergen. Overall it seems to be able to synthesize images that are plausible extensions of the samples. It does not, however, fully preserve all the visual details of the original image, and it introduces irregular-ities that one wouldn't expect to observe in processes that generate those types of
(a) Sample (b) Synthesized
Figure 3-3: Synthesis by matching subband histograms in a steerable pyramid de-composition [16]
images.
In the following, we use a slight variation of the texture model in [41]. For robust-ness, as modifying skewness and kurtosis often results in numerical instabilities on artificial images, we use histograms instead to represent the shapes of the marginal distributions of the subbands. We also allow the model to compute statistics only over a specified region in the sample texture, as well as enforce the statistics to match only in a specified area in the image being synthesized. To compute the statistics over a given area, we simply compute the various statistics, applying a weight to each location based on the mask. Synthesis is performed similarly, with normalization weights appropriately computed for correlation and autocorrelation modifications. To produce color syntheses, we use Independent Components Analysis [20] to obtain a decorrelated space in which to run three separate syntheses, then recombine the outputs after the synthesis step is complete.
(a) Sample (b) Synthesized
(c) Sample (d) Synthesized
Figure 3-4: Example Portilla-Simoncelli syntheses
3.3
Stimuli Not Accurately Represented by the
Portilla-Simoncelli Texture Model
The human perception system makes errors. If the representation underlying the perceptual system itself is ambiguous on the same types of errors, then the represen-tation is a likely explanation. Does the represenrepresen-tation we propose exhibit ambiguities where human perception makes errors?
In chapter 2, the Portilla-Simoncelli statistics were presented as a feature-space where difficulty in categorizing the statistical representations of arrays with multiple objects predicted how difficult the crowding task using those stimuli would be. Figure
3-5 shows that the model does not have difficulty in representing a single letter, but
no longer easy to establish. It should be noted that these syntheses exhibit artifacts from the implementation of the synthesis procedure (the synthesis assumes image wrap around - i.e., top is connected to bottom, and left is connected to right).
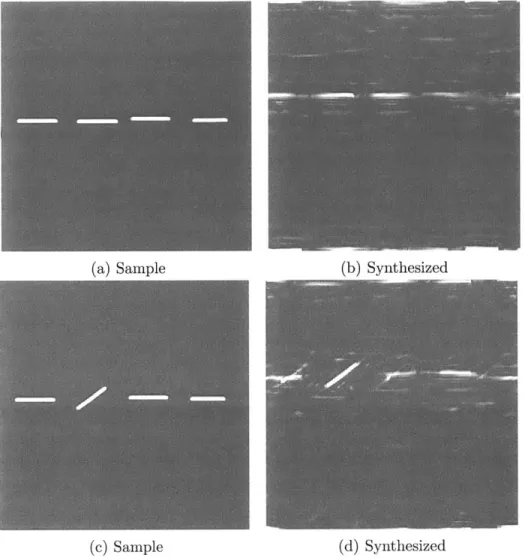
In Figure 3-6 the syntheses do not exhibit many ambiguities about the contour, but in Figure 3-7 the model is not able to unambiguously represent the more complicated contour. In particular, we notice that it hallucinated a T junction when there were no such junctions in the original image.
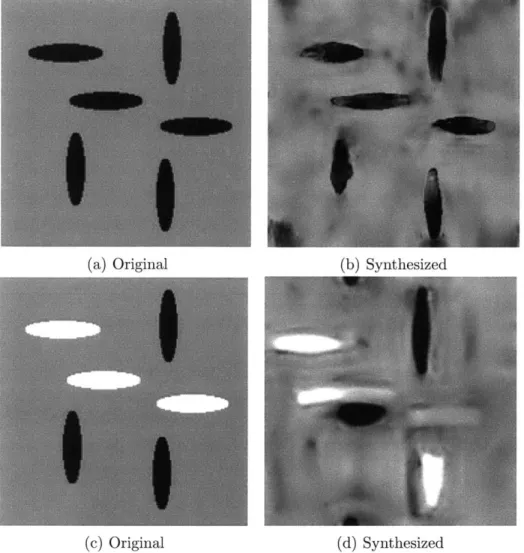
We consider another synthesis in Figure 3-8. When all elements are black, the statistics are unambiguous about the color of the various oriented line segments. (c-d) When there are black and white line segments, the model hallucinated a white vertical line segment even though the original image had no such combination. This may be an indication that ambiguities in the statistical description can explain why illusory conjunctions like those often reported in visual search occur. Note also that these illusory combinations of color and orientation are difficult to reproduce in parametric synthesis models, for example in [10, 9, 24]. This is because these non-parametric models tend to only use small (perhaps irregular shaped) parts from the original image in the synthesis algorithm, which makes it difficult to hallucinate parts that were never present in the original.
Clearly, the Portilla-Simoncelli model allows many ambiguities about the visual information it tries to represent in the examples presented in this section. However, by optimizing the model to capture texture appearance, the model also seems to have selected model parameters that allow ambiguities that fool the peripheral visual system. The errors the model makes are the types of errors that humans also make in the periphery. In visual crowding, people do poorly in identifying letter identities when the letter is flanked by surrounding letters. In addition, phase discrimination in the periphery is also known to be poor in humans [50, 33].
Additionally, Balas [2] shows that humans were not very good at parafoveal dis-crimination of real vs synthesized Portilla-Simoncelli textures. These lines of evidence suggest at least that the choice of the Portilla-Simoncelli texture model will suffice for a working hypothesis for the set of visual information that the peripheral visual
(a) Original (b) Synthesized
(c) Original (d) Synthesized
Figure 3-5: The ambiguities in representing a single letter are few, but in complex stimuli with multiple letters, the statistics do not sufficiently constrain the synthesis so that the letter identities are preserved in the representation.
system computes.
3.4
Visualizing Statistics in the Entire Visual Field
We have noted that texture models can be viewed as compression algorithms for vi-sual appearance and have identified the Portilla-Simoncelli model as one that seems to capture the same types of information that the human visual system does. How-ever, the Portilla-Simoncelli model makes the assumption that the sample texture is generated from a stationary process (i.e., does not change depending on position), and
(a) Sample (b) Synthesized
(c) Sample (d) Synthesized
Figure 3-6: Simple contours do not have representations that allow much ambiguity in the model
so compression is difficult to achieve in most natural images where this assumption is violated.
Balas et al suggested that these statistics are computed across the visual field, in local, overlapping pooling regions whose size grow with eccentricity [3]. The lo-cal pooling regions where these statistics are computed help relax the assumption of a global stationary process that generated the visual field. Without considering overlaps, the global stationary process assumption is reduced to a locally-stationary process, where locality is defined by the pooling regions. Allowing pooling regions to overlap, however, makes the locally-stationary assumption even weaker, as pooling
(a) Sample (b) Synthesized
Figure 3-7: More complicated contours are difficult for the statistics to represent
unambiguously. Note that the synthesis produced an illusory T junction in the middle, indicating that the model would have difficulty discriminating these rotated L-like structures from T junctions.
regions are allowed to influence each other.
While Balas et al showed that it was useful to visualize the statistics of a single pooling region in the periphery [3], a natural question that follows is what about the entire visual field? The work on single pooling regions suggest that we might be able to gain additional intuitions about the global structures in stimuli that span a larger visual area, by extending that idea to visualize the local statistics in pooling regions across the entire visual field. How might we achieve this?
To visualize the peripheral representation of an image given the fixation point, we first lay out a number of pooling regions over the image. The pooling regions are placed in a log-polar grid, as depicted in Figure 3-9. The pooling regions are oval because it is the shape suggested by the research on visual crowding [50]. We place sufficient pooling regions to cover the entire image, plus some additional rings beyond, to allow the model to deal with the edges of the image as well. Having pooling regions with blank images as input,constrains those regions to be blank (blank regions are perfectly represented by the statistics). This constrains where where the algorithm will synthesize the non-blank visual "stuff".
(a) Original (b) Synthesized
(c) Original (d) Synthesized
Figure 3-8: (a-b) When all elements are black, the statistics are unambiguous about the color of the various oriented line segments. (c-d) When there are black and white line segments, the model hallucinated a white vertical line segment even though the original image had no such combination
over a central region where the fovea is because there is little loss of information close to the center of fixation. Then, it iterates over all the pooling regions, constraining the local region to have the same statistics as the corresponding local region in the original image. We cannot offer any convergence guarantees at this point, but the model seems to converge after 50 to 100 iterations on the images we have tested it on.
r
Figure 3-9: Pooling regions are placed in a log-polar grid.
(a) Sample
3.4.1
Example Syntheses
In the following examples, the fixation is in the middle of the image.
(a) Original
(b) Synthesized
(a) Original (b) Synthesized
(a) Original
t .,
(b) Synthesized
(a) Original
(b) Synthesized
Figure 3-14: Ducks
3.5
Related Work
Freeman and Simoncelli [14] independently published a similar model to the work presented in this thesis. Both models are inspired by the suggestion by Balas et al in
[3], and are approximately computing the same statistics. Some differences between their model and the model presented here are that they use different pooling region shapes and constrain statistics of overlapping pooling regions jointly.
3.6
Future Work
3.6.1
Convergence and Statistics
The synthesis procedure does not perfectly constrain random noise images to match the desired statistics. The distance between the synthesized image's statistics and the desired statistics vary greatly depending on the types of images. This makes it difficult to define a stopping rule. One possibility to address this problem is to better characterize what types of statistics are difficult for the synthesis algorithm to match by comparing the difference in the space of statistics for the image and the
synthesized image, in a large dataset.
3.6.2
Space of statistics
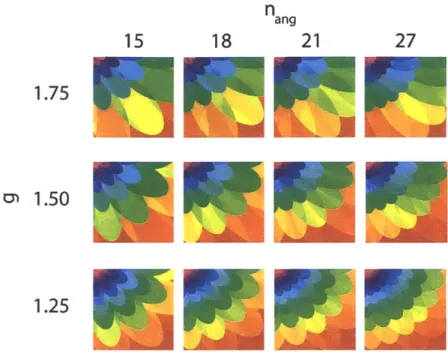
Because we are able to compute the statistics for an arbitrary image patch, and these statistics seem to correlate well with peripheral vision perception, what can we say about natural image statistics, and what the space of statistics are on a natural image dataset? Using images taken from LabelMe [45], we computed Portilla-Simoncelli statistics from a million natural image patches at various scales from 600 images.
Figure 3-15 shows patches from those images. We place an image patch where its statistics' projection onto the two-dimensional subspace that optimally describes the highest variance of the dataset (using PCA [38]). To a first approximation, the first two principal components seems to describe orientation - horizontal patches appear near the bottom right and vertical patches in the top left. Further research is needed to better represent this space of statistics so that we may eventually predict the perceptual difference of two patches in the periphery given the statistics of those patches.
Figure 3-15: Space of statistics in natural images
Additionally, better understanding the space of statistics may help with problems where the human visual system seems to prefer certain solutions over others, when the statistics allow many interpretations. For example, the "Healing Grid" illusion [22] in Figure 3-16, if one stares at the center of the image for about 30 seconds, one tends to perceive a regular grid in the periphery. Our model currently cannot account for why this interpretation of the statistics is preferred over others. Perhaps a regularity prior on the possible interpretations (perhaps from natural image statistics) can account for these types of effects.


![Figure 3-2: Synthesis using the Heeger-Bergen method, by matching subband his- his-tograms in a steerable pyramid decomposition [16]](https://thumb-eu.123doks.com/thumbv2/123doknet/13937259.451324/38.918.200.721.353.636/figure-synthesis-heeger-bergen-matching-subband-steerable-decomposition.webp)
![Figure 3-3: Synthesis by matching subband histograms in a steerable pyramid de- de-composition [16]](https://thumb-eu.123doks.com/thumbv2/123doknet/13937259.451324/39.918.182.704.126.401/figure-synthesis-matching-subband-histograms-steerable-pyramid-composition.webp)