Publisher’s version / Version de l'éditeur:
Scientific Reports, 8, 1, 2018-02-19
READ THESE TERMS AND CONDITIONS CAREFULLY BEFORE USING THIS WEBSITE. https://nrc-publications.canada.ca/eng/copyright
Vous avez des questions? Nous pouvons vous aider. Pour communiquer directement avec un auteur, consultez la
première page de la revue dans laquelle son article a été publié afin de trouver ses coordonnées. Si vous n’arrivez pas à les repérer, communiquez avec nous à PublicationsArchive-ArchivesPublications@nrc-cnrc.gc.ca.
Questions? Contact the NRC Publications Archive team at
PublicationsArchive-ArchivesPublications@nrc-cnrc.gc.ca. If you wish to email the authors directly, please see the first page of the publication for their contact information.
Archives des publications du CNRC
This publication could be one of several versions: author’s original, accepted manuscript or the publisher’s version. / La version de cette publication peut être l’une des suivantes : la version prépublication de l’auteur, la version acceptée du manuscrit ou la version de l’éditeur.
For the publisher’s version, please access the DOI link below./ Pour consulter la version de l’éditeur, utilisez le lien DOI ci-dessous.
https://doi.org/10.1038/s41598-018-21559-8
Access and use of this website and the material on it are subject to the Terms and Conditions set forth at
Cooling aerosols and changes in albedo counteract warming from CO2
and black carbon from forest bioenergy in Norway
Arvesen, Anders; Cherubini, Francesco; Del Alamo Serrano, Gonzalo;
Astrup, Rasmus; Becidan, Michael; Belbo, Helmer; Goile, Franziska; Grytli,
Tuva; Guest, Geoffrey; Lausselet, Carine; Rørstad, Per Kristian; Rydså, Line;
Seljeskog, Morten; Skreiberg, Øyvind; Vezhapparambu, Sajith; Strømman,
Anders Hammer
https://publications-cnrc.canada.ca/fra/droits
L’accès à ce site Web et l’utilisation de son contenu sont assujettis aux conditions présentées dans le site LISEZ CES CONDITIONS ATTENTIVEMENT AVANT D’UTILISER CE SITE WEB.
NRC Publications Record / Notice d'Archives des publications de CNRC:
https://nrc-publications.canada.ca/eng/view/object/?id=2d960319-439a-414d-b640-718306678b1a
https://publications-cnrc.canada.ca/fra/voir/objet/?id=2d960319-439a-414d-b640-718306678b1a
Cooling aerosols and changes in
albedo counteract warming from
CO and black carbon from forest
bioenergy in Norway
Anders Arvesen , Francesco Cherubini , Gonzalo del Alamo Serrano , Rasmus Astrup ,
Michael Becidan , Helmer Belbo , Franziska Goile , Tuva Grytli , Geofrey Guest
,,
Carine Lausselet , Per Kristian Rørstad , Line Rydså , Morten Seljeskog , Øyvind Skreiberg ,
Sajith Vezhapparambu & Anders Hammer Strømman
Climate impacts of forest bioenergy result from a multitude of warming and cooling efects and vary by location and technology. While past bioenergy studies have analysed a limited number of climate-altering pollutants and activities, no studies have jointly addressed supply chain greenhouse gas emissions, biogenic CO luxes, aerosols and albedo changes at high spatial and process detail. Here, we present a national-level climate impact analysis of stationary bioenergy systems in Norway based on wood-burning stoves and wood biomass-based district heating. We ind that cooling aerosols and albedo ofset – % of total warming, leaving a net warming of or 9 kg CO e MWh− for stoves
or district heating, respectively. Large variations are observed over locations for albedo, and over technology alternatives for aerosols. By demonstrating both notable magnitudes and complexities of diferent climate warming and cooling efects of forest bioenergy in Norway, our study emphasizes the need to consider multiple forcing agents in climate impact analysis of forest bioenergy.
Bioenergy from forest biomass is renewable and a potential climate change mitigation solution. Least-cost and sustainable pathways to climate stabilization as envisaged by energy scenario literature typically involve signif-icant increases in the use of forest bioenergy in decades to come, oten in conjunction with use of carbon cap-ture and storage in order to achieve negative carbon dioxide (CO2) emissions1–3. Unlike other renewable energy
sources, bioenergy is a combustible fuel energy source, exhibiting characteristics (e.g., possibility for energy stor-age and transport by road, rail or water) that can help to yield diversiied low-carbon energy systems.
Assessing the climate change impacts of forest bioenergy is complex, because it involves a multitude of cli-mate forcing agents. Traditionally, and still the case in prevailing clicli-mate policy frameworks and many assess-ment models4, bioenergy is designated as carbon neutral. As is recognized in literature5–7 and recent legislative
eforts8, this paradigm does not consider that there can be an initial period where carbon accumulates in the
atmosphere because emissions from biomass combustion occur at a faster rate than CO2 uptake by vegetation
re-growth. his temporal asymmetry induces a perturbation of the global carbon cycle and climate system, which result in a temporary warming efect9. Further, burning biomass leads to emissions of near-term climate forcers
(NTCFs) that exert warming or cooling efects over a relatively short time period. Notable NTCFs are black car-bon (BC), organic carcar-bon (OC), carcar-bon monoxide (CO), volatile organic compounds (VOC), mono-nitrogen oxides (NOx) and sulphur oxides (SOx)10. he net climate impacts of NTCFs are the result of many complex
efects with diferent temporal evolutions at play, and their quantiication is subject to large uncertainties11. Some
of these pollutants (NOx, CO, VOCs) are precursors to the formation of tropospheric ozone, a powerful GHG.
Others are primary aerosols (BC, OC) or precursors to secondary aerosols (NOx, SOx) that inluence climate
in various ways. For example, OC and SOx result in an increase in scattering of solar radiation, and hence cool
Industrial Ecology Programme and Department of Energy and Process Engineering, Norwegian University of Science and Technology (NTNU), Norwegian, Norway. SINTEF Energy Research, Norwegian, Norway. Norwegian Institute of Bioeconomy Research, Norwegian, Norway. National Research Council Canada, Ontario, Canada. Norwegian University of Life Sciences, Norwegian, Norway. Correspondence and requests for materials should be addressed to A.A. (email: anders.arvesen@ntnu.no) or F.C. (email: francesco.cherubini@ntnu.no)
Received: 12 September 2017 Accepted: 6 February 2018 Published: xx xx xxxx
the climate system. Finally, wood harvest-induced alterations of surface albedo and other biophysical factors afect climate12,13. he magnitude and direction (warming or cooling) of biophysical climate efects vary and are
strongly site-speciic14,15. Alteration of surface albedo directly afects the global radiation balance12,16, and is
par-ticularly important in areas with seasonal snow cover17,18.
Life cycle assessment (LCA) is a widely applied tool for assessing the climate impacts of energy options19,20.
he strength of LCA is that it takes into consideration not only direct emissions from combustion, but also emissions occurring upstream in supply chains. Climate impact assessments in existing bioenergy LCAs mainly focus on emissions of GHGs (e.g., refs21,22). However, there is a growing literature showing that surface albedo
changes23–27 and NTCFs28,29 can be important in shaping the climate impacts of bioenergy, and hence should be
included in climate impact assessment30. To our knowledge, no bioenergy LCA studies undertaken at a national
scale with technology-level detail have simultaneously examined the climate efects of supply chain GHGs, bio-genic carbon luxes, NTCFs and surface albedo changes. hese efects can be consistently included in LCA by employing emission metrics that translate the efects to common units, such as CO2-equivalents31.
Here, we assess the balance of climate cooling and warming efects of wood stove and district heating forest bioenergy in Norway. he 100-year global warming potential (GWP) is used to characterize and aggregate climate efects of diferent climate forcers. We integrate a mapping of regional wood harvest and bioenergy supply chains in Norway, sets of emission factors established from own experimental data and other sources, own computed geographically explicit GWPs for biogenic carbon luxes and changes in surface albedo, and GWPs for GHGs and NTCFs from the IPCC (see Methods). In this way, we are able to present a irst-of-its-kind elucidation of the mag-nitudes of and balance between climate warming and cooling efects from multiple forcing agents associated with forest bioenergy at a national level. We ind that cooling from OC and albedo changes ofset 60–70% of warming from BC and GHGs, leaving net total warming efects of 69 kg CO2e MWh
−1
for district heating and 340 CO2e
MWh−1
for wood stove heating on average. hese magnitudes are signiicantly lower than (for district heating) or comparable to (for wood stoves) GHG emissions associated with fossil oil-based heating. hey appear com-parable or large in comparison to life cycle GHG emissions of heating based on renewable electricity. Estimated total cooling and total warming from forest bioenergy are both substantial: total cooling efects are in the range of 200–400 kg CO2e MWh
−1
and warming efects 300–800 kg CO2e MWh −1
.
Results
Forest biomass-to-bioenergy systems.
Norway is a country with vast forest resources. We focus on two important applications of forest bioenergy in Norway: wood-burning stoves and wood biomass-based dis-trict heating. Wood stove bioenergy represents a major application of forest biomass and source of BC and OC emissions in Norway32. In comparison to stoves, forest biomass-ired plants for district heating are a larger-scaleapplication with more pollution abatement.
We model four kinds of residential irewood stoves, classiied as either old or new, clean-burning stoves, and as operating at either partial load or nominal load. We distinguish ive categories of combustion plant sizes. he vari-ous stove and combustion plant types are distinguished by diferent eiciency and emission factor values, consider-ing a Norway mix of biomass fuel types (see Methods). Table 1 gives estimated wood harvest amounts attributed to the technologies under study, and heat delivery and thermal eiciency values for year 2010. Total wood stove bio-energy production is roughly 80% greater than district heating biobio-energy. Stove biobio-energy is largely produced from partial load operation (69%, with the remainder coming from nominal load). Nearly half of the district heating bio-energy is produced by plants in the 1 < 10 MW capacity range. Attributed harvest amounts exceed the amounts of inal fuel because of losses and burning along the supply chain to produce biofuels. At the same time, waste wood, overall constituting 9% of the feedstock for district heating, is assumed to not require any harvest. A caveat of our analysis is that harvest quantities are attributed to irewood under certain simplifying assumptions necessary due to gaps in available data. In particular, we model private harvest and net import as if it occurs in Norway with a county distribution equal to the distribution of irewood consumption (see Methods for details).
Breakdowns per wood classes of forest harvest attributed to bioenergy are shown in Fig. 1, distinguishing the ten most important counties in terms of harvested amount (covering 73% of Norway total), tree species and forest productivity classes. he top six counties (53% of Norway total) are all in the south-eastern part of Norway,
Attributed harvest (1000 dry t year−1) Heat output (GWh year−1) hermal eiciency (%) Bio DH < 1 MW 60 235 82–83 Bio DH 1 < 10 MW 270 1100 85–86 Bio DH 10 < 20 MW 120 500 89–91 Bio DH 20 < 50 MW 36 157 91–93 Bio DH > 50 MW 65 291 93–95
Stoves, old, partial load 340 1180 67
Stoves, old, nominal load 180 610 65
Stoves, new, partial load 430 1610 72
Stoves, new, nominal load 180 659 69
Table 1. Annual attributed wood harvest, annual heat output and combustion plant thermal eiciency values
for district heating and residential wood stoves in Norway (year 2010). DH = district heating; MW = megawatt. Combustion plant eiciencies vary depending on fuel type.
a region with intensive forest management and characterized by much more snow cover than the coastal western part. It is also the region with the largest forest resource potentials33. Estimated birch harvest is fairly constant
across counties, as birch is predominantly (84%) used for irewood and irewood demand is similar across coun-ties. Spruce and pine harvest is comparatively high in the south-east; this is connected to harvest for district heating.
Global warming potentials (GWPs).
100-year GWP values for well-mixed GHGs (excluding CO2 ofbiogenic origin) and NTCFs are obtained from the ith IPCC Assessment Report10. We use GWP values that
include climate-carbon feedbacks for non-CO2 gases. his is in line with recent UNEP-SETAC guidelines for
LCA30 and supported by the conclusion of the IPCC that including climate-carbon feedbacks “likely” (page 714
in ref.10) yields better estimates, albeit with higher uncertainty10. We employ GWP factors for six NTCFs (black
carbon, BC; organic carbon, OC; carbon monoxide, CO; volatile organic compounds, VOC; mono-nitrogen oxides, NOx; and sulphur oxides, SOx) and estimates of uncertainty intervals (±standard deviation) as given by
the UNEP-SETAC30 on the basis of ranges presented by the IPCC10.
For biogenic CO2 and surface albedo, we compute GWP factors for the nineteen Norwegian counties, three
tree species (birch, spruce and pine) and two forest productivity classes (see Methods). Figure 2 shows the GWP values for CO2 emissions from biomass combustion and post-harvest albedo dynamics for birch and spruce
(results for pine are available in Supplementary Fig. S1).
GWP for CO2 emissions from biomass combustion are relatively smaller for forests with relatively higher
productivity, as the resource turnover time is shorter34. Under the same site class, values tend to be higher in
mountainous areas and at increasing distance from the coast. Values for deciduous species (birch) are lower than those for coniferous species (spruce and pine), because birch plantations have signiicantly shorter turnover times (about 60–70 years against 90–100 years). GWP for changes in surface albedo are lower (that is, lower on a negative scale) for site classes with lower productivity. his is because the longer a forest takes to regrow the more sustained is the post-harvest change in surface albedo over time, because the snow-masking efect of canopy closure is delayed if compared to a high productive site. Albedo GWP factors are particularly signiicant in the central mountainous areas of the country, mainly owing to abundant snowfalls. Further, they tend to be more signiicant for deciduous trees than for coniferous species because of the defoliation process of birch-tree types in wintertime, which increases the fraction of snow-covered land exposed to solar radiation.
Net GWP values, meaning the combined contributions from carbon GWP and albedo GWP, vary for the dif-ferent counties, tree species, and site classes (supplementary Fig. 2). For pine and spruce with high productivity, the carbon contribution dominates and the net GWP values are positive for all counties. For birch, in some coun-ties contributions from albedo dominate even with high productivity, resulting in net negative values of GWP.
Climate warming and cooling efects.
Table 2 shows climate impacts per unit of heat output, broken down by six categories of climate forcers. Figure 3 presents a visual display of the results. We ind that several climate forcing agents contribute to comparable degrees to the overall climate warming and cooling impacts, with a combined, net efect that is warming. Considering all climate alterations, combined warming amounts to 760 kg CO2e MWh−1 for stove heating and 270 kg CO2e MWh−1 for district heating; similarly, combined coolingare 420 kg CO2e MWh−1 and 210 kg CO2e MWh−1. hus, we are let with a net warming of 340 kg CO2e MWh−1
for stove heating and 69 CO2e MWh−1 for district heating. By comparison, direct and supply chain GHG
emis-sions associated with delivering electricity to consumers connected to a distribution grid in Norway has been estimated to 42, 190 or 580 kg CO2e MWh−1, depending on whether Norwegian, Nordic or European electricity
Figure 1. County breakdown of total annual wood harvest attributed to district heating and wood stove
bioenergy in Norway (year 2010). Top ten counties in terms of total attributed harvest are shown. Stacked categories represent species (birch, spruce, pine) and forest productivity class (high, medium). Hedmark, Oppland, Akershus, Buskerud, Østfold and Telemark are in south-east Norway; Sør-Trøndelag and Nord-Trøndelag are in central Norway (north of south-east part); and Hordaland and Møre og Romsdal are in coastal west Norway.
is assumed35. If assuming the same electricity is used to drive a heat pump with a seasonal coeicient of
perfor-mance of 3, the emissions would be 14, 65 or 190 kg CO2e MWh−1. By further comparison, one prospective study
estimates a carbon footprint of European electricity production in 2030 of roughly 100 kg CO2e MWh−1 20 in a
2 °C mitigation scenario. he carbon footprint of burning fossil oil is 320 kg CO2e MWh−136, or 360 kg CO2e if
considering a 10% distribution loss as assumed in the present study for bioenergy district heating (see Methods). hese comparisons are intended to aid interpretation of the magnitude of the estimated bioenergy impacts, but bearing in mind that the carbon footprints for electricity and oil options do not consider biogenic CO2, albedo
or NTCFs.
Signiicant biogenic CO2 warming and albedo cooling are common for all heating alternatives (though with
variations): Biogenic CO2 is responsible for 27% and 81% of total warming while albedo cooling ofsets 27% and
64% of total warming for average wood stove and district heating bioenergy, respectively. For heating stoves, there is an additional important warming efect from BC (constituting 50% of total warming for stoves) and cooling efect from OC (ofsetting 26% of total warming). Besides warming from BC and biogenic CO2, 15% and 12%
of total warming for wood stoves and district heating, respectively, are ascribed to supply chain GHGs, which include methane (CH4) and nitrous oxide (N2O) emitted directly from stoves or combustion plants. Direct CH4
and N2O emissions represent, respectively, 50% and 6% of the total supply chain GHG emissions for wood stoves.
he most important source of fossil CO2 is transport of irewood to the (stove) users, followed by irewood
chop-ping (before retail).
In Fig. 3, the variation in BC and OC impacts across wood stove categories can be a challenge to interpret, as they depend on both overall particulate matter (PM) emissions and the shares of PM that are BC or OC, and because BC and OC have opposing (warming/cooling) efects. Nominal load stoves have much lower PM emis-sions than partial load stoves, and new stoves have much lower PM emisemis-sions than old stoves. BC fractions of PM are appreciably higher for nominal operation than for partial operation, while OC fractions are comparable
Figure 2. Global warming potentials calculated with a 100-year time horizon (GWP100) for CO2 emissions
and changes in surface albedo associated with birch and spruce forest bioenergy in Norway. Plots in let and right columns are for high and medium forest productivity classes, respectively. GWP values are expressed in kg CO2e per kg of CO2 emissions from biomass combustion. he maps were created by using ArcMap 10.3
(Supplementary Table S2). he substantial BC warming and OC cooling associated with partial load stoves is a result of large overall PM emissions. he substantial BC warming for nominal load stoves (especially old stoves) is attributable to high BC fractions of PM for nominal load stoves. hese are also the reasons why, in Fig. 3, the net total climate impact is signiicantly lower for partial load old stoves than for nominal load old stoves.
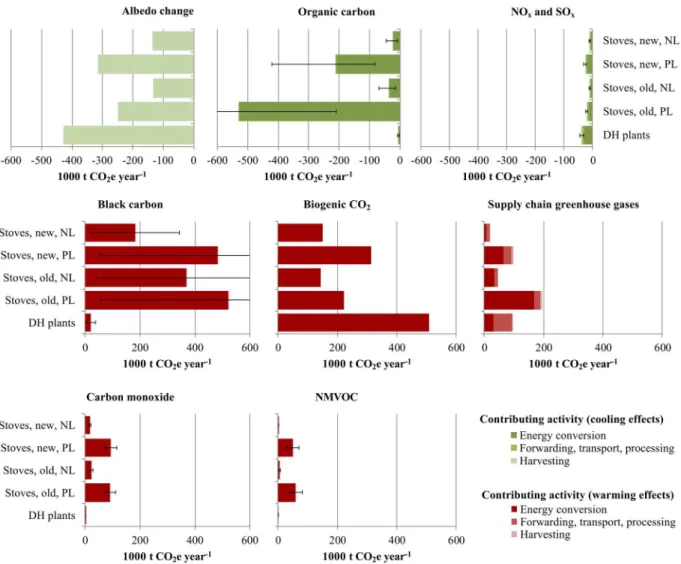
Figure 4 shows the annual climate impacts of bioenergy from wood stove and district heating in Norway. Unlike in Fig. 3, impacts are measured as annual absolutes; hence, they depend on heat delivery and harvest volumes (cf. Table 1). he total warming efect amounts to 3.7 Mt CO2e year
−1
and total cooling −2.2 Mt CO2e year −1
, which yields a net total warming of 1.5 Mt CO2e year
−1
(equivalent to 5% of total Norway GHG emissions, as discussed in supplementary Climate warming and cooling efects). As can be seen from Fig. 4, partial load stoves are the dominant cause of climate impacts associated with OC and BC, and of the less important impacts associated with CO and NMVOC. Also evident from the igure is the dominance of energy conversion (i.e., biomass combustion) and harvest activities in causing climate impacts. As an indication of uncertainty stemming from GWP values for NTCFs, ranges (±standard deviation) are included for NTCF results in Fig. 4 based on refs10,30.
District heating Stoves, old, PL Stoves, old, NL Stoves, new, PL Stoves, new, NL Stoves, combined Climate cooling per unit of heat output (kg CO2e MWh−1)
Albedo change −190 −210 −220 −200 −200 −200
Organic carbon −1.7 −450 −57 −130 −34 −200
NOx −15 −12 −12 −11 −12 −12
SOx −1.2 −5.3 −5.4 −5.2 −5.1 −5.2
Total cooling −210 −680 −290 −340 −250 −420
Climate warming per unit of heat output (kg CO2e MWh−1)
Black carbon 8.5 440 600 300 280 380
Biogenic CO2 220 190 240 190 230 200
Supply chain greenhouse gases 42 160 77 62 31 89
Carbon monoxide 0.69 76 36 58 27 55
NMVOC 0.13 49 9.2 31 2.1 29
Total warming 270 920 960 650 560 760
Net climate impacts per unit of heat output (kg CO2e MWh−1)
Net total 69 240 670 300 310 340
Annual totals (1000 t CO2e year−1)
Total cooling −470 −800 −180 −550 −170 −1700
Total warming 630 1100 590 1000 370 3100
Net total 160 290 410 490 200 1400
Net total as share of Norway GHG 0.3% 0.5% 0.8% 0.9% 0.4% 3%
Table 2. Climate cooling and warming efects by climate forcers and technologies. PL = partial load;
NL = nominal load. Numbers are rounded to two signiicant digits.
Figure 3. Total annual impacts per unit heat output for wood stove and district heating bioenergy. Let panel
shows a total of six wood stove and combustion plant categories separately; right panel shows total across all stove and plant categories. DH = district heating; PL = partial load; NL = nominal load.
Our results further substantiate the conclusion of ref.37 that BC, despite frequently overlooked in climate
impact analysis of bioenergy systems, can be a major climate warming species for small-scale combustion units such as wood stoves. Combustion plants and district heating for providing residential space heating shows lower PM emissions than wood stove heating, owing to higher eiciencies and pollution control equipment installed in combustion plants. Future research and technological improvements can target abatement of BC emissions from wood stoves in order to yield climate beneits.
County contributions and variations for carbon and albedo impacts.
Albedo GWPs exhibit a much greater scatter than carbon GWPs (Fig. 5). his is evident both across species-productivity classes for single coun-ties and across councoun-ties for single species-productivity classes, and arises because snow cover and forest density diferences among counties signiicantly inluence albedo GWP. Counties with high attributed harvest levels (cf. Fig. 1) tend to display relatively high albedo GWP (Fig. 5, let column), which ampliies the importance of the highest-harvest counties for albedo climate impacts. When albedo impacts are normalized to total county-level attributed harvest, impacts vary by up to a factor of three among counties (Fig. 5, right column). Meanwhile, normalized climate impacts from carbon vary only slightly, with variations caused mainly by diferent shares held by birch to total attributed harvest and lower GWP values for birch.Limitations and uncertainties.
Uncertainties are present in various parts of our analysis, including the mapping of bioresources, compilation of emission inventories, and climate impact characterization. One notable source of uncertainty is the allocation of forest harvest to counties in combination with diferences in albedo impact intensities between counties, as discussed in the previous section. Further, the GWP metrics for NTCFs considered are representative of global average responses10, although impacts from NTCFs can be spatially andFigure 4. Annual climate impacts of bioenergy from wood stove and district heating. Albedo impacts are
attributed to the harvesting activity category. Supply chain GHGs include direct CH4 emissions from biomass
combustion and storage, besides all fossil GHG. DH = district heating; PL = partial load; NL = nominal load. Ranges relect uncertainty (±1 standard deviation) for GWP values for NTCFs10,30. Range for organic carbon,
stoves, old, PL extends to −1100; for black carbon, stoves, new, PL to 910; for black carbon, stoves, old, NL to 700; and for black carbon, stoves, old, PL to 990 (all numbers in 1000 t CO2e year
−1
temporally heterogeneous. For instance, the climate impact response to an emission pulse is generally higher in the northern hemisphere, and higher over land than oceans38. his particularly applies to aerosol species, owing
to their short lifetimes and low degree of mixing in the atmosphere11. Regional speciic responses and emission
metrics for NTCFs are available39,40, but additional studies are required to determine their robustness10,41. he
standard deviation results included in Fig. 4 demonstrate high uncertainty of BC and OC impact estimates for wood stove bioenergy.
Radiative forcing impacts and associated GWP metrics are evaluated under a constant background climate and in the absence of potentially important biophysical feedbacks, such as surface roughness or evapotranspi-ration changes10. Future changes in climate can have two contrasting efects on emission metrics for forest
bio-energy in Norway. On the one hand, carbon metrics may decrease as boreal areas experience more favourable growing conditions34. On the other hand, albedo metrics may decrease owing to reduced snowfall. Reduced
surface albedo in a forest productive region of Norway in March 2100 is estimated to be about 10% or 25% in two trajectories of climate change42 (the representative concentration pathways 4.5 and 8.5)43. Further, future growth
in CO2 atmospheric concentrations will increase the fraction of CO2 remaining airborne over time because of
saturation in ocean and land carbon stocks44, and, at the same time decrease the marginal radiative eiciency of
CO210. However, emission metrics are relatively insensitive to these efects because they are nearly ofsetting each
other45,46.
Another source of uncertainty derives from the emission factor estimations for BC and OC for wood stoves. Uncertainties arise due to a number of factors, including particle concentration variations, sampling and analy-sis methods, and experimental setup47. We expect overall uncertainty to be higher for BC than for OC. For BC,
uncertainty is probably higher for new stoves than for old stoves. In the future, emissions of climate-cooling OC are expected to decrease signiicantly, due to improved combustion technology and replacement of old stoves by new. Emissions of climate-warming BC are more diicult to reduce, as BC formation is more coupled to combus-tion condicombus-tions that are diicult to control or design. A key factor is to avoid local lame extinccombus-tion at relatively cold locations in the combustion chamber where soot cannot be burnt out. High uncertainties of PM, BC and OC emission factors for residential wood combustion are not unique to our estimates, but are also present in other estimates in literature37,48.
he 100-year GWP has been the metric of choice within the UNFCCC to date. Alternative metrics (e.g., 20-year GWP or the 100-year global temperature potential) are conceptually different or incorporate tem-poral proiles of radiative forcings in diferent ways10. he 100-year GWP is the recommended metric by the
UNEP-SETAC guidelines for LCA for addressing “the shorter-term rate of warming (next decades)” (page 63 in ref.30).
Figure 5. Carbon and albedo global warming potentials (GWPs; let column), annual carbon and albedo
climate impacts (centre column) and annual carbon and albedo climate impacts normalized to total annual harvest (right column) by county. Top ten counties in terms of total attributed harvest are shown, with
breakdowns into tree species and forest productivity classes (as in Fig. 1). GWP values are weighted averages for two forest classes distinguished by distance to forest road (see Methods).
Final remarks.
Our analysis illustrates the complexity of assessing the climate impacts of forest bioenergy. Factors of complexity include the sizeable diferences not only in overall PM emissions among wood stove classes, but also in the fractions of PM that are cooling or warming. he strong location-dependence of normalized albedo impacts represents another element of complexity. he notable and comparable magnitudes of climate cooling and warming efects from diverse forcing agents, the variation in impacts between bioenergy technolo-gies for some forcing agents and the variation across counties for some agents, emphasize the need to consider multiple forcing agents in climate impact analysis of forest bioenergy and provide a rationale for further research in this vein. Unlike non-combustion renewable energy options, forest bioenergy depends on continuous harvest and combustion. While fossil GHG emissions associated with producing infrastructure such as wind turbines will decrease towards zero as economies phase out fossil fuels49–51, wood harvest and combustion will continue tocause changes in surface albedo and emissions. he balance of climate cooling and warming efects of bioenergy is hence likely to be a subject of continuous interest.
Methods
Wood consumption, eiciencies and emission factors for residential wood stoves.
We deine four combinations of old/new stoves and partial/nominal load operation, distinguished by diferent eiciency and emission factor values. We classify stoves produced ater 1998 (when new regulations setting limits on particle emissions from stoves were enacted) as new and stoves produced before that year as old. Old stoves typically have glass windows with air lushing, but no insulation of the combustion chamber and no secondary air. New stoves are characterized by advanced technology facilitating clean burning (i.e., secondary air, glass lushing, insulated combustion chamber and sometimes double glasses). In addition, a limited number of ultra-modern stoves also use automatic regulation systems and specially designed combustion chambers to achieve even lower emissions of unburned substances.We use a weighted average approach to establish wood consumption and emission factors for each of the four stove categories, as briely described below (see Supplementary Methods and ref.47 for further details).
Supplementary Table S2 contains the eiciency and emission factor data. We assume that 80% of irewood is birch and other hardwoods and 20% spruce, and other sotwoods, based on consumer survey results52,53 (see
also Methods, Assumptions to overcome data deiciencies for irewood). he relative shares burned in old stoves is 47% and in new stoves 48% (wood burned in open ireplaces represents the remainder of the total, but is not explicitly represented in our analysis)54. We assume a distinct use pattern (no night-time burning) for the portion
of wood burned in “large” cities (amounting to 6.3% of total irewood)47. he respective shares of operating time
on partial load and nominal load are derived from the cumulative normal distribution used in the Norwegian test standard55: 65% and 35% for old stoves, and 70% and 30% for new stoves. Old stoves are assumed to be operated
more oten on nominal load than new stoves since they are mostly installed in older, less insulated and leakier houses.
Following the approach outlined above, we determine new emission factors for CO2, CH4, CO, NMVOC,
par-ticulate matter (PM) indicators (including BC and OC) and SO2. he factors for CO2 take into account the carbon
content of non-CO2 emission components. Emission factors for N2O and NOx are the same as in the Norwegian
emission inventory method56. We here use black carbon (BC) as synonymous to elemental carbon (EC), although
they are deined diferently (BC refers to optical properties, EC to physical properties57). It may be noted that to a
larger degree than in the rest of Europe, wood stoves in Norway are ired with limited combustion air supply (i.e., operation at below the stoves’ nominal power), contributing to more unfavourable combustion conditions and higher emissions of unburned substances for Norwegian stoves58,59.
Based on experimental data from past tests47, we assume eiciencies for old stoves of 67% and 65% at part and
nominal load, respectively, higher than the 50% currently assumed by Statistics Norway56. For new stoves at part
and nominal load, we assume 72% and 69%, in line with the 70% assumed by Statistics Norway.
Biomass consumption, eiciencies and emission factors for combustion plants.
We collect information on type of biomass fuel, thermal capacity and eiciency for about 600 biomass district heating plants from an oicial operation permits database60 and direct communication with Enova SF under the NorwegianMinistry of Petroleum and Energy. Only district heating plants are considered here, excluding localized heat generation not connected to a heat distribution network (e.g., combustion facilities delivering heat for internal use in pulp and paper or sawmilling industries). We classify the plants into ive heat output capacity categories (cf. Table 1) and ive main biomass fuel type categories (wood chips, sawdust/shavings, pellets, briquettes and waste wood; some less important fuel types, for instance husk, are not explicitly represented). Based on the combustion plant survey results, we assume that eiciency increase with plant size (from 82–83% for the smallest size category to 93–95% for the biggest), with some variations depending on the fuel type. We assume emission factor values by evaluating information from multiple sources56,61–63. he fractions of PM
10 that are BC and OC are assumed to
be 4.3% and 17%, respectively64. See Supplementary Methods for further details and Supplementary Table S3 for
numerical eiciency and emission factor data.
Supply chain operations and associated emissions.
We employ the method of life cycle assessment (LCA) to attribute in a coherent manner emissions occurring over product lifespans and supply chains to the bioenergy products under study19. In our analysis, supply chain operations comprise any pre-harvest activities(seedlings production and planting, forest thinning), operations that take place in the forest (e.g., sawing, chop-ping, loading, forwarding), fuel storage and processing (e.g., chipping), and transport by car (for irewood) or pipeline (district heating) to inal users. We assume 10% overall heat loss in district heating pipes65. In order
to determine GHG and NTCF emissions associated with fossil fuel combustion, we collect information on key parameters describing forests and wood harvest in Norway (e.g., mean stem size, area of cutting sites, tree species
distribution) from the Norwegian national forest inventory66, and use this information to group forest area in
Norway into 36 cases according to dominating species, forest productivity and region. Next, we employ cost productivity models (most notably, from refs67–72) to establish detailed accounts of productive machine hours for
each stratum, and then estimate the associated diesel fuel consumption and emissions using conversion factors from refs61,73. Finally, inventories of equipment, material and energy requirements are connected to the LCA
data-base Ecoinvent36 in order to achieve extensive coverage of efects indirectly associated with bioenergy. Production
of key infrastructure and assets (shed, tractor, power saw, wood stove, combustion facility, etc.) is taken into account.
Additional details are added to the supply chain analysis for biogenic CO2 and albedo change speciically.
Unlike the employed GWP values for GHGs and NTCFs, the employed GWPs for CO2 and albedo are explicit
in location (aggregated at a county level), tree species and forest productivity class. Hence, an analysis explicitly connecting biomass burned and biomass harvest by counties, species and productivity classes becomes necessary. We achieve this by collating and balancing data from surveys of wood harvest and produced biomass products66,
irewood consumption by counties52, and type and amount of fuel consumption of district heating plants (based
on survey undertaken in this study). Biomass is burned in industry for the production of bioenergy fuels (i.e., woodchips, pellets, briquettes) or for the production of intermediate products (e.g., sawdust) used to produce bioenergy fuels. Drawing upon ref.74, we assign forest biomass burning in sawmill and fuel-producing industries
to district heating bioenergy using mass-based allocation. Consequently, quantities of wood harvest attributed to district heating bioenergy in our analysis exceed the quantities of fuel combusted in the district heating plants by roughly 15%.
Assumptions to overcome data deficiencies for firewood.
Estimates of Norwegian household irewood consumption in 2010 by counties are available from Statistics Norway, based on consumer survey results52,53. According to the survey results, 40% of the total consumption is sourced from commercialsuppli-ers, implying that 60% comes from private (non-commercial) sources. Firewood trade statistics indicate that irewood import to Norway constituted 10–16% of total consumption in 2000–2016, and that irewood export from Norway is relatively small (at least one order of magnitude smaller than import)52. In addition, a portion
of the commercial irewood consumption originates from recovered wood (e.g., from surplus wood from timber production) that cannot easily be traced via forestry statistics. Owing to these factors, using information from the Norwegian national forest inventory-based harvest model75 we are able to cover only a small portion (7%)
of total irewood consumption. For the remainder consumption, we lack county-speciic information on forest parameters and harvest. We apply the following assumptions and simpliications to overcome this data gap prob-lem. One, we treat all irewood production as if it was produced in Norway (i.e, disregarding potentially diferent production for net imported wood). Two, we assume that the county distribution of irewood production mirrors the county distribution of consumption as indicated by consumer survey results52. hree, we implement a ixed
share of 80% birch and other hardwoods and 20% spruce and other sotwoods across all counties. his is in rough correspondence with statistics on commercial irewood production from timber in Norway in 1996–200552 (more
recent data or data pertaining to non-commercial irewood production are not available). Four, we uniformly adopt county-speciic ratios between spruce and pine harvest, between diferent forest site classes and between diferent distances to forest road from the Norwegian national forest inventory-based harvest model75, assuming
these ratios are representative for all irewood harvest.
Post-harvest carbon and albedo dynamics.
Stand-replacing forest disturbances alter the net exchange of CO2 between the land and atmosphere, with consequences for CO2 atmospheric concentration and climatesystem76,77. In addition to CO
2 emissions from oxidation of harvested products, post-harvest forest stands are
usually a source of carbon for some years ater disturbance because CO2 emissions from heterotrophic
respira-tion (Rh) exceed carbon sequestrarespira-tion in new trees via net primary productivity (NPP)78,79. Once residues have
decomposed and NPP increases, the net ecosystem exchange (NEE, NEE = Rh – NPP) becomes negative, and the forest ecosystem acts as a net carbon sink. he transition from carbon source to carbon sink usually occurs within the irst two or three decades following stand replacement, and largely depends on the amount and decay rate of post-harvest forest residues remaining in the forest to decompose80.
Post-harvest NPP is determined using an empirical harvest model based on the Norwegian national forest inventory, which provides spatial explicit information on tree species relative abundancy, volume, age, site-class, and distance to forest road of the forest plot75. he most abundant tree species in Norwegian forests are spruce
(Picea Abies), pine (Pinus Sylvestris) and birch (mixed species). he Rh response to the harvest event is obtained from YASSO07, which estimates changes in soil carbon and decomposition rate of forest harvest residues with climate-explicit variables such as the mean annual temperature, average annual precipitation, and mean ampli-tude of average monthly minimum and maximum temperature81. Post-harvest net CO
2 exchanges are estimated
for each plot ater combining the NPP and Rh proiles. Results are then aggregated at a county level per dominant tree species (spruce, pine, and birch), distance from forest road (short or medium), and site productivity class (medium or high). We therefore have 12 possible combinations of NEE proile per county. Because forest distribu-tion in the country is heterogeneous, there are missing data in some counties for certain tree species. For instance, forests at high latitude are little productive, and therefore let out from our analysis.
Changes in surface albedo occur ater forest harvest, when the solar relective property of the surface is per-turbed and the surface masking efects of trees is reduced82. Open land usually has higher albedo (i.e., higher
relectivity of incoming solar radiation) than forested land, and the diference is ampliied in regions afected by seasonal snow cover12,15. When the forest regrows the surface albedo change gradually declines and returns to
the pre-harvest level. his temporary perturbation causes a cooling contribution that can be of the same order of magnitude of the impacts associated with carbon luxes24,83. We use post-harvest county-average volume
increments to predict monthly-mean albedo dynamics using a simultaneous unmixing and non-linear regres-sion model84. he model is based on multi-year satellite retrievals of MODIS surface albedo (MCD43A3)85, high
resolution land cover maps86, and meteorological records87 and uses forest structure information (volume and
age) and climate variables (temperature and snow water equivalents) to characterize albedo variations in Norway across latitude, seasons, land cover types, and topography. It relies on an extensive analysis of surface albedo changes across space and in time in Norwegian forests88.
Climate impact assessment.
NEE proiles represent the ecosystem carbon response to the harvest event and are the basis for the computation of emission metrics for forest bioenergy. hese metrics are computed fol-lowing the standard protocol used by the 5th IPCC Assessment Report10, which uses a multi-model mean for theimpulse response function (IRF) of CO244. First, the IRF associated with CO2 emissions from biomass combustion
are produced for each case (county, tree species, site index, and distance to forest road) ater the integration with the global carbon cycle through a mathematical convolution34. he IRF describes the case-speciic change in CO
2
atmospheric concentration from bioenergy CO2 emissions and the associated site-speciic NEE proiles. his is
then converted into radiative forcing as the product between the speciic IRF for CO2 from bioenergy and CO2
radiative eiciency (deined as the radiative forcing per kg increase in atmospheric burden of the gas), under the common assumption that for suiciently small emissions and approximately constant background conditions the radiative eiciency can be approximated as time-invariant89. According to the latest IPCC assessment report, the
background atmospheric CO2 concentration is held constant to the average concentration in 2010 (389 ppmv).
By integrating the RF we then obtain the AGWP which is then used to calculate the GWP metric with a time horizon of 100 years10.
Radiative forcing from changes in surface albedo are computed according to a simpliied 1-layer atmospheric transfer model24,25, which is found to perform reasonably well when compared with more sophisticated
mod-els90. A change in albedo is translated to a change in global radiative forcing at the top of the atmosphere ater
combination with the monthly-mean incoming solar radiation at the surface and a global average atmospheric transmittance parameter. Spatial explicit mean incoming solar radiation is gathered per month and latitudinal/ longitudinal degree for all Norway as the 22-year mean of the downwelling solar radiation lux at surface level91.
he radiative forcing is then normalized to the unit of biomass harvested, time-integrated, and used to compute GWP with a time horizon of 100 years.
he present calculated GWP values (Fig. 2) are generally in line with those reported in past studies. A study that quantiies spatially explicit CO2 emission metrics for forest bioenergy estimates mean 100-year GWPs for
Norway between 0.44 and 0.69 kg CO2e per kg CO2 (national aggregated value covering birch, spruce and pine
species)34. Another study computes 100-year GWPs for a Norwegian spruce plantation in the county of Hedmark
in the range of 0.44 and 0.62 kg CO2e per kg CO292. Previous estimates of 100-year GWP for surface albedo from
spruce plantations in Hedmark are between −0.3 and −0.4 kg CO2e per kg CO226,31.
Data availability.
he data that support the indings of this study are available from the corresponding authors upon request.References
1. Van Vuuren, D. P., Bellevrat, E., Kitous, A. & Isaac, M. Bio-energy use and low stabilization scenarios. he Energy Journal 31, (2010). 2. Rose, S. et al. Bioenergy in energy transformation and climate management. Climatic Change 123, 477–493 (2014).
3. Sanchez, D. L., Nelson, J. H., Johnston, J., Mileva, A. & Kammen, D. M. Biomass enables the transition to a carbon-negative power system across western North America. Nature Clim. Change 5, 230–234 (2015).
4. Creutzig, F. et al. Bioenergy and climate change mitigation: an assessment. GCB Bioenergy 7, 916–944 (2015).
5. Berndes, G., Ahlgren, S., Börjesson, P. & Cowie, A. L. Bioenergy and land use change—state of the art. Wiley Interdisciplinary Reviews: Energy and Environment 2 (2013).
6. Cherubini, F., Peters, G. P., Berntsen, T., StrØMman, A. H. & Hertwich, E. CO2 emissions from biomass combustion for bioenergy: atmospheric decay and contribution to global warming. GCB Bioenergy 3, 413–426 (2011).
7. Hudiburg, T. W., Law, B. E., Wirth, C. & Luyssaert, S. Regional carbon dioxide implications of forest bioenergy production. Nature Climate Change 1, 419 (2011).
8. European Commission, http://eur-lex.europa.eu/legal-content/EN/TXT/?uri=CELEX:52016SC0246 (2016).
9. Cherubini, F., Gasser, T., Bright, R. M., Ciais, P. & Stromman, A. H. Linearity between temperature peak and bioenergy CO2 emission rates. Nature Clim. Change 4, 983–987 (2014).
10. Myhre, G. et al. In Climate Change2013: he Physical Science Basis. Contribution of Working Group I to the Fith Assessment Report of the Intergovernmental Panel on Climate Change (eds T. F. Stocker et al.) Ch. 8, 659–740 (Cambridge University Press, 2013). 11. Fuglestvedt, J. S. et al. Transport impacts on atmosphere and climate: Metrics. Atmospheric Environment 44, 4648–4677 (2010). 12. Bonan, G. B. Forests and Climate Change: Forcings, Feedbacks, and the Climate Beneits of Forests. Science 320, 1444–1449 (2008). 13. Lucia, P. et al. Biophysical efects on temperature and precipitation due to land cover change. Environmental Research Letters 12,
053002 (2017).
14. Bright, R. M., Zhao, K., Jackson, R. B. & Cherubini, F. Quantifying surface albedo and other direct biogeophysical climate forcings of forestry activities. Global Change Biology 21, 3246–3266 (2015).
15. Jackson, R. B. et al. Protecting climate with forests. Environmental Research Letters 3, 044006 (2008).
16. Betts, R. A., Falloon, P. D., Goldewijk, K. K. & Ramankutty, N. Biogeophysical efects of land use on climate: Model simulations of radiative forcing and large-scale temperature change. Agricultural and Forest Meteorology 142, 216–233 (2007).
17. Bala, G. et al. Combined climate and carbon-cycle efects of large-scale deforestation. Proceedings of the National Academy of Sciences
104, 6550–6555 (2007).
18. Davin, E. L. & Noblet-Ducoudré, N. d. Climatic Impact of Global-Scale Deforestation: Radiative versus Nonradiative Processes. Journal of Climate 23 (2010).
19. Hellweg, S. & Milà i Canals, L. Emerging approaches, challenges and opportunities in life cycle assessment. Science 344, 1109–1113 (2014).
20. Hertwich, E. G. et al (eds.). Green energy choices. he beneits, risks, and trade-ofs of low-carbon technologies for electricity production. United Nations Environment Programme (UNEP), http://apps.unep.org/publications/index.php?option=com_ pub&task=download&ile=012131_en (2016).
21. Staples, M. D., Malina, R. & Barrett, S. R. H. he limits of bioenergy for mitigating global life-cycle greenhouse gas emissions from fossil fuels. Nature Energy 2, 16202 (2017).
22. Gibon, T., Hertwich, E. G., Arvesen, A., Singh, B. & Verones, F. Health benefits, ecological threats of low-carbon electricity. Environmental Research Letters 12, 034023 (2017).
23. Fabio, C. et al. Quantifying the climate impacts of albedo changes due to biofuel production: a comparison with biogeochemical efects. Environmental Research Letters 9, 024015 (2014).
24. Cherubini, F., Bright, R. M. & Strømman, A. H. Site-speciic global warming potentials of biogenic CO 2 for bioenergy: contributions from carbon luxes and albedo dynamics. Environmental Research Letters 7, 045902 (2012).
25. Bright, R. M., Cherubini, F. & Strømman, A. H. Climate impacts of bioenergy: Inclusion of carbon cycle and albedo dynamics in life cycle impact assessment. Environmental Impact Assessment Review 37, 2–11 (2012).
26. Guest, G., Bright, R. M., Cherubini, F. & Strømman, A. H. Consistent quantiication of climate impacts due to biogenic carbon storage across a range of bio-product systems. Environmental Impact Assessment Review 43, 21–30 (2013).
27. Muñoz, I., Campra, P. & Fernández-Alba, A. R. Including CO2-emission equivalence of changes in land surface albedo in life cycle assessment. Methodology and case study on greenhouse agriculture. he International Journal of Life Cycle Assessment 15, 672–681 (2010).
28. Iordan, C., Lausselet, C. & Cherubini, F. Life-cycle assessment of a biogas power plant with application of diferent climate metrics and inclusion of near-term climate forcers. Journal of Environmental Management 184, Part 3, 517–527 (2016).
29. Tsao, C. C. et al. Increased estimates of air-pollution emissions from Brazilian sugar-cane ethanol. Nature Clim. Change 2, 53–57 (2012).
30. Levasseur, A. et al. in Global guidance for life cycle impact assessment indicators. Volume 1. (eds R. Frischknecht & Olivier Jolliet), http://www.lifecycleinitiative.org/training-resources/global-guidance-lcia-indicators-v-1/, United Nations Environment Programme (UNEP) (2016).
31. Cherubini, F., Bright, R. M. & Strømman, A. H. Global climate impacts of forest bioenergy: what, when and how to measure? Environmental Research Letters 8, 014049 (2013).
32. Statistics Norway, Emissions of black carbon and organic carbon in Norway 1990–2011, https://www.ssb.no/natur-og-miljo/ artikler-og-publikasjoner/_attachment/107884?_ts=13dfd568678 (2013).
33. he Norwegian Water Resources and Energy Directorate (NVE). Bioenergi i Norge [Bioenergy in Norway], http://webby.nve.no/ publikasjoner/rapport/2014/rapport2014_41.pdf (2014).
34. Cherubini, F. et al. Global spatially explicit CO2 emission metrics for forest bioenergy. Scientiic Reports 6, 20186 (2016). 35. Arvesen, A., Hauan, I. B., Bolsøy, B. M. & Hertwich, E. G. Life cycle assessment of transport of electricity via diferent voltage levels:
A case study for Nord-Trøndelag county in Norway. Applied Energy 157, 144–151 (2015). 36. Ecoinvent. Life cycle inventory database v2.2. Swiss Centre for Life Cycle Inventories (2010).
37. Mitchell, E. J. S. et al. Heating with Biomass in the United Kingdom: Lessons from New Zealand. Atmospheric Environment 152, 431–454 (2017).
38. Joshi, M. M., Lambert, F. H. & Webb, M. J. An explanation for the diference between twentieth and twenty-irst century land–sea warming ratio in climate models. Climate Dynamics 41, 1853–1869 (2013).
39. Collins, W. J. et al. Global and regional temperature-change potentials for near-term climate forcers. Atmos. Chem. Phys. 13, 2471–2485 (2013).
40. Shindell, D. T. Evaluation of the absolute regional temperature potential. Atmos. Chem. Phys. 12, 7955–7960 (2012).
41. Cherubini, F. et al. Bridging the gap between impact assessment methods and climate science. Environmental Science & Policy 64, 129–140 (2016).
42. Bright, R. M. et al. Climate change implications of shiting forest management strategy in a boreal forest ecosystem of Norway. Global Change Biology 20, 607–621 (2014).
43. van Vuuren, D. P. et al. he representative concentration pathways: an overview. Climatic Change 109, 5 (2011).
44. Joos, F. et al. Carbon dioxide and climate impulse response functions for the computation of greenhouse gas metrics: a multi-model analysis. Atmos. Chem. Phys. 13, 2793–2825 (2013).
45. Caldeira, K. & Kasting, J. F. Insensitivity of global warming potentials to carbon dioxide emission scenarios. Nature 366, 251–253 (1993).
46. Andy, R. et al. Future changes in global warming potentials under representative concentration pathways. Environmental Research Letters 6, 024020 (2011).
47. Seljeskog, M., Goile, F., Sevault, A. & Lamberg, H. Particle emission factors for wood stove iring in Norway. he BLACKOut project. Comissioned by the Norwegian Climate and Pollution Agency, http://www.miljodirektoratet.no/old/klif/nyheter/ dokumenter/25042013(PM%20emission%20factors%20wood%20stoves_Rapport_Final_64-65).pdf (2013).
48. Denier van der Gon, H. A. C. et al. Particulate emissions from residential wood combustion in Europe – revised estimates and an evaluation. Atmos. Chem. Phys. 15, 6503–6519 (2015).
49. Hillman, K. M. & Sanden, B. A. Time and scale in Life Cycle Assessment: the case of fuel choice in the transport sector. International Journal of Alternative Propulsion 2, 1–12 (2008).
50. Gibon, T. et al. A methodology for integrated, multiregional life cycle assessment scenarios under large-scale technological change. Environmental Science & Technology 49, 11218–11226 (2015).
51. Pehl, M. et al. Understanding future emissions from low-carbon power systems by integration of life cycle assessment and integrated energy modelling. Nature Energy 2, 939–945 (2017).
52. Statistics Norway. Available from: https://www.ssb.no/en/statistikkbanken [Accessed 4 October 2016].
53. Statistics Norway. Vi brenner stadig mer ved [We are burning more wood], http://www.ssb.no/natur-og-miljo/artikler-og-publikasjoner/vi-brenner-stadig-mer-ved (2011).
54. Haakonsen, G. & Kvingedal, E. Utslipp til lut fra vedfyring i Norge [Emissions to air from wood burning in Norway]. Statistics Norway, https://www.ssb.no/a/publikasjoner/pdf/rapp_200136/rapp_200136.pdf (2001).
55. Standard Norge. NS-3059. Enclosed wood heaters. Smoke emissions. Requirements. Standard Norge (1994).
56. Statistics Norway. he Norwegian Emission Inventory 2013, https://www.ssb.no/natur-og-miljo/artikler-og-publikasjoner/the-norwegian-emission-inventory-2013 (2013).
57. Petzold, A. et al. Recommendations for reporting “black carbon” measurements. Atmos. Chem. Phys. 13, 8365–8379 (2013). 58. Alves, C., Gonçalves, C., Fernandes, A. P., Tarelho, L. & Pio, C. Fireplace and woodstove ine particle emissions from combustion of
western Mediterranean wood types. Atmospheric Research 101, 692–700 (2011).
59. Karlsvik E. Current irewood iring technology, Quality Wood Project Report 6/2007, Project EIE/06/178/SI2.444403, https:// ec.europa.eu/energy/intelligent/projects/en/projects/quality-wood (2017).
60. NVE. Norwegian Water Resources and Energy Directorate (NVE). Available from: www.nve.no.
61. Bauer C. Holzenergie [Bioenergy]: Paul Scherrer Institut Villigen, Swiss Centre for Life Cycle Inventories (www.ecoinvent.ch) (2007).
62. European Environment Agency (EEA). EMEP/EEA air pollutant emission inventory guidebook 2013. Technical guidance to prepare national emission inventories (2013).
63. Ministry of Climate and Environment (KLD). Forskrit om begrensning av forurensning (forurensningsforskriten) [Pollution control regulation] (2010).
64. Bond, T. C. et al. A technology-based global inventory of black and organic carbon emissions from combustion. Journal of Geophysical Research: Atmospheres 109 (2004).
65. he Norwegian Water Resources and Energy Directorate (NVE). Energy in Norway, https://www.nve.no/Media/5147/folde2014.pdf (2017)
66. Tomter, S. M., Hylen, G. & Nilsen, J.-E. Ø. in National forest inventories. Pathways for common reporting (eds E. Tomppo, T. Geschwantner, M. Lawrence, & R.E. McRoberts) 411–424 (Springer, Heidelberg, 2010).
67. Nurminen, T., Korpunen, H. & Uusitalo, J. Time consumption analysis of the mechanized cut-to-length harvesting system. http://www. silvafennica.i/article/346 (2006).
68. Vennesland, B., Hohle, A. E. & Kjøstelsen, L. Prosjektrapport klimatre. Energiforbruk og kostnader - Skog og bioenergi [Project report climate tree. Energy use and costs - Forest and bioenergy]; Norwegian Institute of Bioeconomy Research. http://www. skogoglandskap.no/ilearchive/rapport_14_13_prosjektrapport_klimatre_energiforbruk_og_kostnader_skog_og_bioenergi.pdf (2013).
69. Belbo, H., Talbot, B. & Kjøstelsen, L. Systemanalyse av ti forsyningskjeder for skoglis basert på heltrevirke [System analysis of ten supply chains for wood chippings based on roundwood], Norwegian Institute of Bioeconomy Research, http://www.skogoglandskap. no/ilearchive/rapport_21_12_systemanalyse_av_ti_forsyningskjeder_for_skoglis_basert_pa_heltrevirke.pdf (2012).
70. Ranta, T. & Rinne, S. he proitability of transporting uncomminuted raw materials in Finland. Biomass and Bioenergy 30, 231–237 (2006).
71. Spinelli, R. & Hartsough, B. A survey of Italian chipping operations. Biomass and Bioenergy 21, 433–444 (2001).
72. Spinelli, R., Magagnotti, N., Paletto, G. & Preti, C. Determining the impact of some wood characteristics on the the performance of a mobile chipper. Silva Fennica 45, 85–95 (2011).
73. Brunberg, T. Fuel consumption in forest machines 2012. Skogforsk report no. 789-2013; Forestry Research Institute of Sweden. http://www.skogforsk.se/contentassets/b89024b19fbf42a599fbfc0c4c322341/bransleforbrukningen-hos-skogsmaskiner- 2012–arbetsrapport-789-2013.pdf (2013).
74. Tellnes, L. G. F., Flæte, P. O. & Nyrud, A. Q. Material lows in the Norwegian sawmilling industry. In: Larnøy E, Alfredsen K, editors. 7th meeting of the Nordic-Baltic network in wood material science & engineering; 2011 27–28 October 2011; Oslo, Norway: Norwegian Forest and Landscape Institute, http://www.skogoglandskap.no/ilearchive/rapport_15_11_proceedings_7th_meeting_ nordic_baltic_network_in_wood_material_science_engineering.pdf (2011).
75. Antón-Fernández, C. & Astrup, R. Empirical harvest models and their use in regional business-as-usual scenarios of timber supply and carbon stock development. Scandinavian Journal of Forest Research 27, 379–392 (2012).
76. Williams, C. A., Vanderhoof, M. K., Khomik, M. & Ghimire, B. Post-clearcut dynamics of carbon, water and energy exchanges in a midlatitude temperate, deciduous broadleaf forest environment. Global Change Biology 20, 992–1007 (2014).
77. Goulden, M. L. et al. Patterns of NPP, GPP, respiration, and NEP during boreal forest succession. Global Change Biology 17, 855–871 (2011).
78. Amiro, B. D. et al. Ecosystem carbon dioxide luxes ater disturbance in forests of North America. Journal of Geophysical Research: Biogeosciences 115, G00K02 (2010).
79. Zha, T. et al. Carbon sequestration in boreal jack pine stands following harvesting. Global Change Biology 15, 1475–1487 (2009). 80. Harmon, M. E., Bond-Lamberty, B., Tang, J. & Vargas, R. Heterotrophic respiration in disturbed forests: A review with examples
from North America. Journal of Geophysical Research: Biogeosciences 116, G00K04 (2011).
81. Tuomi, M., Rasinmäki, J., Repo, A., Vanhala, P. & Liski, J. Soil carbon model Yasso07 graphical user interface. Environmental Modelling & Sotware 26, 1358–1362 (2011).
82. Anderson, R. G. et al. Biophysical considerations in forestry for climate protection. Frontiers in Ecology and the Environment 9, 174–182 (2011).
83. O’Halloran, T. L. et al. Radiative forcing of natural forest disturbances. Global Change Biology 18, 555–565 (2012).
84. Cherubini, F., Hu, X., Vezhapparambu, S. & Stømman, A. H. High-resolution mapping and modelling of surface albedo in Norwegian boreal forests: from remotely sensed data to predictions. Geophysical Research Abstracts 19 (2017).
85. Schaaf, C. B. et al. First operational BRDF, albedo nadir relectance products from MODIS. Remote Sensing of Environment 83, 135–148 (2002).
86. Gjertsen, A. K. & Nilsen, J.-E. Ø Et skogkart basert på tolking av satelittbilder [SAT-SKOG: A forest map based on interpretation of satellite imagery.] Document number 23/12: IV, Norwegian Forest and Landscape Institute (2012).
87. Mohr, M. New Routines for Gridding of Temperature and Precipitation Observations for SeNorge.no. Note 08/2008, he Norwegian Meteorological Institute (2008).
88. Cherubini, F., Vezhapparambu, S., Bogren, W., Astrup, R. & Strømman, A. H. Spatial, seasonal, and topographical patterns of surface albedo in Norwegian forests and cropland. International Journal of Remote Sensing 38, 4565–4586 (2017).
89. Myhre, G., Highwood, E. J., Shine, K. P. & Stordal, F. New estimates of radiative forcing due to well mixed greenhouse gases. Geophysical Research Letters 25, 2715–2718 (1998).
90. Bright, R. M. & Kvalevåg, M. M. Technical Note: Evaluating a simple parameterization of radiative shortwave forcing from surface albedo change. Atmos. Chem. Phys. 13, 11169–11174 (2013).
91. NASA. Prediction of Worldwide Energy Resource (POWER). (NASA Langley Research Center, 2013).
92. Guest, G., Cherubini, F. & Strømman, A. H. he role of forest residues in the accounting for the global warming potential of bioenergy. GCB Bioenergy 5, 459–466 (2013).
Acknowledgements
his research was funded by the Research Council of Norway through the Bioenergy Innovation Centre (CenBio). We thank Geir Skjevrak and Evert Bouman for help with data compilation or analysis.
Author Contributions
A.A., F.C. and A.H.S. designed the study. A.A. and F.C. wrote up the manuscript, with inputs from G.A.S., R.A., M.B., H.B., M.S., P.K.R., Ø.S. and A.H.S., A.A., F.C., G.A.S., R.A., M.C., H.B., F.G., T.G., G.G., C.L., P.K.R., L.R., M.S., Ø.S., S.V. and A.H.S. contributed to collecting data or carrying out analyses.
Additional Information
Supplementary information accompanies this paper at https://doi.org/10.1038/s41598-018-21559-8.
Competing Interests: he authors declare no competing interests.
Publisher's note: Springer Nature remains neutral with regard to jurisdictional claims in published maps and
Open Access This article is licensed under a Creative Commons Attribution 4.0 International
License, which permits use, sharing, adaptation, distribution and reproduction in any medium or format, as long as you give appropriate credit to the original author(s) and the source, provide a link to the Cre-ative Commons license, and indicate if changes were made. he images or other third party material in this article are included in the article’s Creative Commons license, unless indicated otherwise in a credit line to the material. If material is not included in the article’s Creative Commons license and your intended use is not per-mitted by statutory regulation or exceeds the perper-mitted use, you will need to obtain permission directly from the copyright holder. To view a copy of this license, visit http://creativecommons.org/licenses/by/4.0/.


![[PDF] Cours BARDON - WORD 2007 | Télécharger PDF](data:image/gif;base64,R0lGODlhAQABAIAAAP///wAAACH5BAEAAAAALAAAAAABAAEAAAICRAEAOw==)