HAL Id: hal-01257771
https://hal.sorbonne-universite.fr/hal-01257771
Submitted on 18 Jan 2016
HAL is a multi-disciplinary open access
archive for the deposit and dissemination of
sci-entific research documents, whether they are
pub-lished or not. The documents may come from
teaching and research institutions in France or
abroad, or from public or private research centers.
L’archive ouverte pluridisciplinaire HAL, est
destinée au dépôt et à la diffusion de documents
scientifiques de niveau recherche, publiés ou non,
émanant des établissements d’enseignement et de
recherche français ou étrangers, des laboratoires
publics ou privés.
Distributed under a Creative Commons Attribution| 4.0 International License
Philippe Lopez, Sébastien Halary, Eric Bapteste
To cite this version:
Philippe Lopez, Sébastien Halary, Eric Bapteste. Highly divergent ancient gene families in
metage-nomic samples are compatible with additional divisions of life. Biology Direct, BioMed Central, 2015,
10, pp.64. �10.1186/s13062-015-0092-3�. �hal-01257771�
R E S E A R C H
Open Access
Highly divergent ancient gene families in
metagenomic samples are compatible with
additional divisions of life
Philippe Lopez
1*, Sébastien Halary
2and Eric Bapteste
1Abstract
Background: Microbial genetic diversity is often investigated via the comparison of relatively similar 16S molecules through multiple alignments between reference sequences and novel environmental samples using phylogenetic trees, direct BLAST matches, or phylotypes counts. However, are we missing novel lineages in the microbial dark universe by relying on standard phylogenetic and BLAST methods? If so, how can we probe that universe using alternative approaches? We performed a novel type of multi-marker analysis of genetic diversity exploiting the topology of inclusive sequence similarity networks.
Results: Our protocol identified 86 ancient gene families, well distributed and rarely transferred across the 3 domains of life, and retrieved their environmental homologs among 10 million predicted ORFs from human gut samples and other metagenomic projects. Numerous highly divergent environmental homologs were observed in gut samples, although the most divergent genes were over-represented in non-gut environments. In our networks, most divergent environmental genes grouped exclusively with uncultured relatives, in maximal cliques. Sequences within these groups were under strong purifying selection and presented a range of genetic variation comparable to that of a prokaryotic domain.
Conclusions: Many genes families included environmental homologs that were highly divergent from cultured homologs: in 79 gene families (including 18 ribosomal proteins), Bacteria and Archaea were less divergent than some groups of environmental sequences were to any cultured or viral homologs. Moreover, some groups of environmental homologs branched very deeply in phylogenetic trees of life, when they were not too divergent to be aligned. These results underline how limited our understanding of the most diverse elements of the microbial world remains, and encourage a deeper exploration of natural communities and their genetic resources, hinting at the possibility that still unknown yet major divisions of life have yet to be discovered.
Reviewers: This article was reviewed by Eugene Koonin, William Martin and James McInerney. Keywords: Microbiology, Metagenomics, Comparative analysis, Networks, Environmental diversity
* Correspondence:philippe.lopez@upmc.fr
1Team‘Adaptation, Integration, Reticulation, Evolution’ – UMR CNRS 7138
Evolution Paris Seine– Institut de Biologie Paris Seine – Université Pierre et Marie Curie, 7 quai St Bernard, 75005 Paris, France
Full list of author information is available at the end of the article
© 2015 Lopez et al. Open Access This article is distributed under the terms of the Creative Commons Attribution 4.0 International License (http://creativecommons.org/licenses/by/4.0/), which permits unrestricted use, distribution, and reproduction in any medium, provided you give appropriate credit to the original author(s) and the source, provide a link to the Creative Commons license, and indicate if changes were made. The Creative Commons Public Domain Dedication waiver (http://creativecommons.org/publicdomain/zero/1.0/) applies to the data made available in this article, unless otherwise stated.
Open peer review
Reviewed by Eugene Koonin, William Martin and James McInerney. For the full reviews, please go to the Reviewers’ comments section.
Background
The study of environmental sequences has repeatedly shown evidence for novel divisions of cellular lineages. In particular, the number of bacterial and archaeal line-ages in the ribosomal tree has continued growing since Woese published a first tree of life in 1987 [1, 2]. Importantly, these environmental sequences are rarely identical to sequences from cultured organisms, which are estimated to represent less than 1 % of species diver-sity [3]. Many environmental sequences resemble other environmental sequences, and have no hits in homology searches outside the sequences from their own metagen-ome [4, 5]. These observations suggest that phylogenetic diversity inferences based on cultivation studies are still limited [1, 6], and that a vast“microbiological dark mat-ter” still deserves to be critically analyzed [7, 8].
There has been constant progress on that front. In 1998, new division-level bacterial lineages were reported in a Yellowstone hot spring, the Obsidian Pool [1]. Evi-dence was obtained from small subunit rRNA genes by restriction fragment length polymorphism. Thirty per-cent of the genes were unaffiliated with recognized bacterial divisions, amounting to 12 novel candidate divisions. The majority of the environmental sequences produced in that study were only modestly related to known ribosomal sequences (showing less than 85 % identity with known sequences). Two of these novel divi-sions presented more than two representatives, giving a better sense of the significant phylogenetic depth of these lineages. Likewise, in 2005, two novel bacterial di-visions were described in an anaerobic wastewater plant[2]. Again, evidence came from the analysis of 16S rRNA genes. At that time already, a third of the known bacterial divisions had no cultured representatives and were exclusively known through their detection via ribo-somal sequences and universal primers [2]. Recently Brown and Luef reported the existence of CPR, a basal group comprising over 15 % of the bacterial domain and resisting cultivation because of their extremely small size, limited number of ribosomes, and their metabolic dependence coupled with the presence of pilus-like structures enabling compensatory interactions [6, 9]. Moreover the bacterial domain was not the only one in which repeated findings of novel divergent groups oc-curred (see also [10–15]). Phylogenetic analyses of envir-onmental sequences also hinted at the existence of previously unobserved archaea [16–18] and eukaryotic lineages [19–22].
The growing use of next-generation sequencing fur-ther enhanced the depth of the environmental sampling, amplifying this general trend of discovery of novel line-ages. As a result, uncultivated microbes detected in SSU rRNA surveys have quadrupled since 2007, reaching > 85 % of the known microbial diversity reported to date [23]. Lately, this pattern of recurrent discovery of novel microbial diversity has even suggested the existence of novel higher level groups, such as novel candidate domains of life. The key observation for this was the discovery of environmental sequences appearing highly distantly related to sequences from cultured organisms, as introduced in the pioneering work by Wu et al. [24].
All these results prompted the search for novel refer-ence genomes outside the usual cultured prokaryotic and viral phyla [6, 9, 23, 25]. In 2012, the genomes of two unusual ultrasmall free-living uncultivated Archaea from a hypersaline Australian lake were de novo assem-bled [26]. These environmental taxa presented distinct-ive metabolic features and amino-acid composition with respect to other archaea, and 60 % of their predicted proteins could not be phylogenetically assigned. Their 16S rRNA was only 68 % to 75 % similar to cultured representatives of haloarchaea. Phylogenetic analyses of multiple markers managed to position them as members of a new major class, called Nanohaloarchaea. Similarly, in 2013, two giant viruses, Pandoravirus salinus and Pandor-avirus dulcis, were discovered off the coast of central Chile and in a freshwater pond near Melbourne[25]. These enormous viruses proved highly unusual: only 7 % of their genes showed homology to known sequences (with an average of only 38 % similarity). These genomes were also completely devoid of capsid proteins. Evidence that unknown life forms populated the microbial world, i.e. microbes still unsequenced to date, including possibly some microbial dark matter (e.g. microbes that are espe-cially difficult to grow in lab cultures) was ever growing.
Interestingly, just like many other environments, the human microbiome also presented an exciting share of unknown organisms [27, 28]. Comparing predicted genes from over 1 million shotgun reads to an extended reference database, Kurokawa et al. found that the se-quences from the majority of gut microbes were highly divergent from previously known sequences[29]. Most of the organisms represented by these sequences were uncharacterized at the genus level. In 2010, Qin et al. in-vestigated the diversity of fecal samples of 124 European adults and reported that only 31–48.8 % of the reads from their studies (plus those from two former studies with comparable methodology but smaller sampling size) could be assigned to 194 public human gut bacter-ial genomes, while 7.6-21.2 % could be assigned to the bacterial genomes from Genbank [30]. Numerous com-pletely novel gene families without known functions,
amounting together to three quarters of the gene fam-ilies of the gut microbiome, were also reported [30]. One year later, Arumugam et al. analyzed metagenomes from 39 individuals and estimated that around 16.5 % of the reads were likely to belong to yet unknown genera [31]. Finally, in 2012, the use of 212 different culture condi-tions revealed novel species and genera in the gut micro-biome, including the largest bacterial genome and the largest virus reported in that environment, demonstrat-ing that metagenomic studies still underestimate micro-bial diversity within the gut [8]. Thus, wherever one looks in nature – from hot springs to human guts-, novel microbial lineages from various taxonomic levels are being discovered through environmental sequencing.
However, a general question remains to be addressed: are we missing novel lineages in the microbial dark uni-verse by relying on standard phylogenetic and BLAST methods? If so, how can we probe that universe using al-ternative sensitive approaches? Indeed, studies of micro-bial dark matter using metagenomic data raise significant methodological challenges for comparative analyses. A first difficulty comes from the size of the dataset. For instance, in 2012, Lynch et al. devised a strategy to analyze 6.5 million assembled paired-end Illumina reads of 16S rRNA from Arctic tundra soil samples [32], in which they found 3 very divergent bac-terial lineages. To handle this large amount of data, the authors relied first on sequence similarity networks. Nodes in these networks corresponded to abundant en-vironmental 16S rRNA sequences and reference se-quences from a database with 2,000,000 curated assigned sequences, connected by edges when they pre-sented > 90 % identity and matched over > = 80 % of their hit length. In such networks, candidate new line-ages are typically unconnected to reference sequences, because they are highly divergent [32]. This study had a strong methodological implication: novel comparative strategies and tools are critical for the screening of the microbial dark matter, because reconstructing a tree of every 16S rRNA sequences was no longer a tractable de-fault option (or at least became a real challenge).
Comparative strategies targeting novel lineages how-ever need to be designed with the specific goal of enhan-cing the exploratory power of microbial diversity analyses, which could also benefit microbial dark matter analyses. Thus, a second difficulty in analyzing microbial diversity comes from the very nature of novel lineages, which are by definition very divergent from known line-ages. Indeed, divergent 16S ribosomal RNA gene sequences evade detection in typical cultivation-independent surveys [9]. Similarly, the most divergent environmental sequences can hardly be included in com-parative phylogenetic analyses, because divergent envir-onmental sequences and sequences from cultured
organisms often fail to align sufficiently well when intro-duced together in multiple sequence alignments. There-fore, the usual phylogenetic approaches, even though they appear very promising for species assignation, might impose methodological constraints that are too restrictive to serve as first tools of choice for exploratory searches of highly divergent environmental sequences. For methodological reasons, it might be difficult, if not practically impossible, to use truly divergent genes from truly divergent life forms, such as very divergent groups or eventual additional domains of Life, to reconstruct phylogenetic trees that simultaneously contain both novel divergent lineages branching outside (rather than within) the three domains of Life and sequences from Archaea, Bacteria and Eukaryotes. Problematically, most intriguing environmental sequences might then tend to be discarded in the first steps of classic comparative ana-lyses of genetic diversity, making it less likely that very divergent lineages could be easily detected by these ap-proaches [9].
Consequently, to show that the microbial dark uni-verse could be probed by alternative methods, we devel-oped a novel protocol for the exploitation of huge numbers of molecular sequences in exploratory diversity surveys. We designed a multi-marker sampling strategy, relying on sequence similarity network to identify (i) well-distributed gene families in cultured prokaryotes and (ii) their distant environmental homologs, character-ized by their topological distance to known sequences in these graphs and their significant sequence divergence (>40 %) from their closest published homolog present in the NCBI database in July 2013. We applied these tools to environmental samples, with a particular focus on the human gut microbiome, because these data are amongst the most abundant and cleanest (and therefore most convenient) publicly available, and because establishing the gut microbiome composition is one of the major challenges of the 21st century.
Results
We designed an analysis to demonstrate that divergent environmental sequences can be investigated fruitfully using networks. Starting with 571,043 sequences from 54 archaeal, 70 bacterial and 7 eukaryotic complete ge-nomes, we first defined 40,584 gene families by cluster-ing sequences with > = 30 % identity over > = 80 % of their lengths as in [32]. We then selected gene families for which finding divergent environmental homologs would be of utmost interest. To do so, we sorted these gene families based on taxonomical and topological cri-teria in sequence similarity graphs to identify gene fam-ilies with at least two densely connected modules of sequences, each from a distinct domain of life. In other words, we sought to identify ancient gene families that
show a strong divergence between the two prokaryotic domains, are rarely transferred between archaea and bacteria, and are widely distributed over each domain. In terms of networks (see Methods), this objective trans-lated into selecting connected components with a con-ductance of < 0.4 for each prokaryotic domain. This conservative threshold yielded only 86 gene families (0.2 %) fulfilling these conditions. These gene families are both broadly distributed across cellular life and show no sign of inter-domain gene transfer, i.e. bacterial se-quences formed a group in the graph that was distinct from the group of archaeal sequences. When homologs were present in the 3 domains of life, our graph pre-sented the typical pattern described in [33], with eukaryotic sequences from bacterial origins connecting to bacterial sequences while eukaryotic sequences from archaeal origins connected to archaeal sequences. Bacterial and archaeal homologs within these well-distributed, rarely transferred between domains, gene families showed > 60 % identity on average. This means that our protocol was not restricted to the search for members of highly conserved (in terms of primary se-quences) families. All gene families with a strong signal in the network could be exploited. These sequence showed clear homology as well as true divergence be-tween archaeal and bacterial sequences and allowed us to depart from the conventional set of highly conserved markers, such as those found by AMPHORA [34] or PhyEco [35], and hence to offer a complementary ana-lysis of genetic diversity. Given that archaeal and bacter-ial homologs shared at least 60 % sequence identity, any environmental homologs of these gene families present-ing > 40 % divergence (i.e., <60 % identity) would be more divergent from its homologs than sequences from two distinct domains of life. Such a high divergence, for these families, deserves to be considered significant, pos-sibly hinting at very divergent organismal lineages, and/ or reflecting a major genetic plasticity for these func-tionally important, apparently ancient gene families. It is noteworthy that the gene families meeting this criterion included genes coding for ribosomal proteins (Table 1).
By contrast to direct BLAST searches [36], we used two rounds of BLAST searches against a local environ-mental database, comprising 9,865,367 predicted ORFs from about 33 million sequences from 236 metagenomic samples, to search for homologs of the cultured se-quences of these conserved families. The first round of BLAST defined a set of environmental homologs with significant hits to known cultured sequences. In the sec-ond round, these environmental homologs were used as seeds to look for their own environmental homologs. Using this protocol we retrieved 309,245 sequences. We then applied a stringent criterion to preserve homology relationships between sequences [37], imposing a
minimal alignment coverage of > = 80 % between any pair of sequences with > 30 % identity, eventually retain-ing 131,162 environmental sequences. We thus con-structed an environmentally extended version of the network of sequences from cultured organisms, expand-ing its original gene families through the addition of their environmental homologs. Remarkably, almost all the graphs (82/86) of these extended gene families showed two typical patterns of connection between cul-tured sequences and their environmental homologs. A first class of environmental sequences was directly con-nected to the cultured sequences; a second class of en-vironmental sequences was indirectly connected to the cultured sequences, being at a distance 2 (in number of edges) from these known reference genes. Indeed, class 1 environmental homologs (retrieved in the first round of BLAST search) acted as bridges to connect class 2 environmental homologs to the gene family.
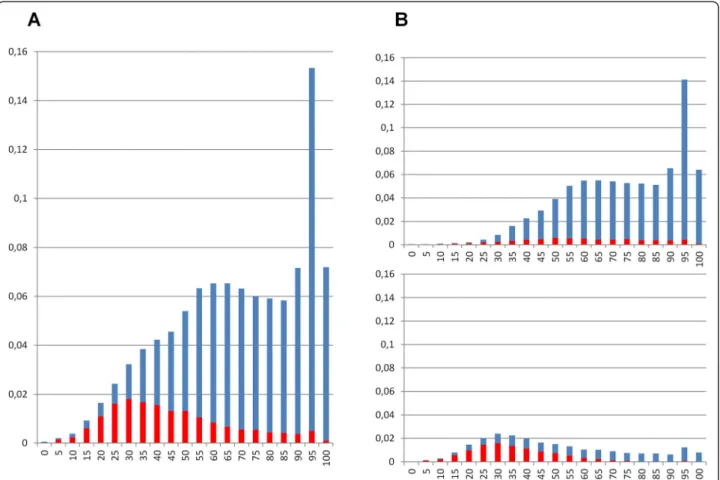
All these environmental homologs were then com-pared against the whole NCBI nr database (July 2013) to look for their closest published relatives (CPR), not only in our networks, but also among all the publicly avail-able sequences from cultured organisms and viruses, de-fining for each environmental sequence an identity to its CPR (Fig. 1a). 22.5 % of these environmental sequences had > =95 % identity to their CPRs. However, 44.3 % of the environmental sequences were more divergent, pre-senting only 60 %-95 % identity to known sequences. Finally, one third of the environmental homologs (33.2 %) showed even less similarity to CPRs than this threshold, thus being more distant from their cultured homologs than homolog pairs from different prokaryotic domains were (on average) for these gene families. This first striking result confirms that the genes in cultured organisms are not representative of 77.5 % of the genes of environmental populations. It suggests that genetic and possibly taxonomic diversity are still significantly underestimated at present. The difference between the genetic diversity of these environmental genes and that of cultured microorganisms, for these 82 important markers, raises a general problem. Inferences of micro-bial genetic resources and micromicro-bial taxonomic diversity made from organisms grown in Petri dishes cannot be assumed to hold as general complete descriptions. Our fundamental knowledge about the genetic and possibly the taxonomic composition of microbiomes remains biased by practical considerations. Even gene families with known functions, such as most of our well-distributed ones, have their own share of ‘genetic dark matter’. In particular, there is still a substantial number of highly divergent microbial genes in the gut. However, other environments harbor proportionally more of these divergent genes than the gut (Fig. 1a). Indeed, while non gut environmental sequences represent only 17 % of the
Table 1 Main annotated functions of the gene families for which environmental homologs were identified
Main annotated functions Samples with (#) env. homologs maltose ABC transporter, periplasmic maltose-binding protein HMQ(127); JM(6)
rhomboid family protein HMQ(907); AA(95); HA(33); JM(29); BB(18); WL(6) phage shock protein A, PspA HMQ(111); JM(10); BB(3); AA(3)
segregation and condensation protein B HMQ(1083); HA(120); AA(117); JM(39); BB(30); WL(11) V-type ATP synthase subunit I HMQ(326); AA(16); JM(15)
protein of unknown function DUF192 HMQ(94); AA(33); HA(23); BB(19); WL(10) nucleotide kinase HMQ(9); HA(3)
30S ribosomal protein S8e HMQ(7); AA(5)
homoserine kinase HMQ(274); AA(77); HA(43); JM(17); BB(8) DNA-directed RNA polymerase subunit L HMQ(4); HA(3)
30S ribosomal protein S24e HMQ(6)
ribosomal biogenesis GTPase HMQ(980); JM(32); HA(23); AA(5); WL(4); BB(3) DNA-directed RNA polymerase I, II, and III, 7.3 kDa polypeptide HMQ(291); AA(34); WL(5); JM(5)
protein of unknown function DUF167 HMQ(94); AA(62); WL(18); JM(3) CoA-substrate-specific enzyme activase HMQ(919); JM(64); AA(9); WL(4)
RNA-binding protein HMQ(717); JM(52); WL(12); HA(10); BB(8); AA(8) hypothetical protein HA(43); AA(29); BB(16) HMQ(9)
protein of unknown function DUF420 AA(18); BB(8); WL(3)
twin arginine-targeting protein translocase HMQ(344); HA(105); AA(105); BB(31); WL(20); JM(17); MB(8); SI(5); G(3) protein of unknown function DUF502 HA(87); AA(59) HMQ(47); BB(24); WL(15)
ribonuclease III HMQ(1370); AA(549); HA(115); JM(66); BB(51); WL(6) polyprenyltransferase HMQ(44); AA(44); HA(32); BB(8); WL(7)
Rossmann fold nucleotide-binding protein HMQ(1133); AA(203); HA(79); JM(46); BB(28); WL(18) glutamyl-tRNA reductase HMQ(299); HA(31); AA(31); BB(14); WL(7); JM(7) 50S ribosomal protein L30P AA(13) HMQ(12); HA(3)
50S ribosomal protein L34e HMQ(1); HA(1); AA(2) 50S ribosomal protein L14e AA(7)
Pre-mRNA processing ribonucleoprotein, binding region HMQ(6)
like-Sm ribonucleoprotein, core AA(23) HMQ(7); HA(4); BB(3) 30S ribosomal protein S26e HA(2)
30S ribosomal protein S3Ae HMQ(5) 30S ribosomal protein S27e AA(8) HMQ(4)
cobalamin 5'-phosphate synthase HMQ(871); JM(30); AA(17); HA(15); WL(8); BB(3) phenylalanyl-tRNA synthetase subunit alpha HMQ(1698); AA(207); HA(127); JM(66); BB(48); WL(7) cell division protein and ATP-dependent metalloprotease FtsH HMQ(1707); HA(338); AA(335); JM(109); BB(79); WL(6) 50S ribosomal protein L1P HMQ(1231); AA(215); HA(146); JM(65); BB(43); WL(16) AAA family ATPase, Cell Division Cycle CDC48 subfamily protein HMQ(10)
methionyl-tRNA synthetase HMQ(1390); AA(211); HA(103); JM(81); BB(35); WL(7); MB(5) 50S ribosomal protein L2P HMQ(815); AA(227); HA(147); JM(75); BB(63); WL(3)
50S ribosomal protein L22P HMQ(1765); AA(256); HA(150); JM(88); BB(53); WL(19); MB(3); SI(3) inositol monophosphatase HMQ(1349); HA(342); AA(307); BB(113); JM(55); WL(15)
chaperonin GroEL HMQ(678); AA(191); HA(128); BB(67); JM(48); WL(5)
50S ribosomal protein L13 HMQ(1827); AA(286); HA(142); BB(63); JM(53); WL(8); MB(4); SI(4) 50S ribosomal protein L5P HMQ(2379); AA(520); HA(373); JM(150); BB(116); WL(25); MB(9)
retrieved homologs, they account for significantly larger proportions amongst the most divergent sequences, showing less than 50 % identity to CPRs (prop test p-value of 2e-16). The median of the distribution of the distance to a CPR lies around 40 % for homologs from other environments than the gut while it lies around 72 % for homologs from gut samples. This difference is likely due to the Human Microbiome Project, which has produced relatively many highly divergent sequences
from gut samples. Strong sequencing efforts focusing on non-gut environments would help identify more hard-to-find, highly divergent environmental homologs. This con-trasted observation a posteriori justifies the choice of gut samples as a major part of our dataset, and makes it obvi-ous that massive metagenomic analyses are a relevant way to reveal more as yet unknown genetic diversity.
Importantly, the network topology provides additional insight concerning microbial genetic diversity. The
Table 1 Main annotated functions of the gene families for which environmental homologs were identified (Continued)
30S ribosomal protein S12 HMQ(956); AA(239); HA(155); JM(61); BB(57); SI(20); WL(14); MB(5); G(3) Bcr/CflA subfamily drug resistance transporter HMQ(399); JM(19); WL(3)
DNA repair and recombination protein RadA HMQ(3327); AA(372); HA(195); JM(109); BB(86); WL(21) 50S ribosomal protein L6 HMQ(1402); AA(239); HA(142); JM(73); BB(55); WL(16) methionine aminopeptidase HMQ(6396); AA(538); HA(316); JM(217); BB(184); WL(22); LM(3) ribonuclease HII HMQ(2476); AA(173); HA(130); JM(60); BB(43); WL(13) 50S ribosomal protein L23 HMQ(2229); AA(253); HA(158); JM(99); BB(46); WL(22); MB(14) molybdenum cofactor biosynthesis protein A HMQ(2024); AA(146); JM(62); HA(49); BB(40); WL(17) 50S ribosomal protein L3P HMQ(1404); AA(205); HA(103); BB(61); JM(61); WL(8); SI(3) 50S ribosomal protein L18e HMQ(10); AA(5); BB(3); HA(3)
tryptophanyl-tRNA synthetase HMQ(1877); AA(213); HA(151); JM(52); BB(45); WL(9) aspartyl-tRNA synthetase HMQ(3159); AA(348); HA(225); JM(149); BB(95); WL(13) nicotinate nucleotide adenylyltransferase HMQ(2308); AA(170); HA(138); JM(73); BB(62); WL(15)
30S ribosomal protein S17P HMQ(1771); AA(264); HA(137); JM(79); BB(50); WL(23); MB(11); SI(10) putative RNA methylase HMQ(1410); HA(35); JM(34); AA(20); BB(6); WL(6)
translation-associated GTPase HMQ(2629); AA(316); HA(247); JM(97); BB(65); WL(11)
50S ribosomal protein L29 HMQ(1969); AA(219); JM(82); HA(48); BB(24); SI(22); MB(16); WL(12) appr-1-p processing domain-containing protein HMQ(805); JM(55); AA(20); WL(5); BB(3)
30S ribosomal protein S7 HMQ(1095); AA(313); HA(165); BB(67); JM(67); SI(10); WL(6); G(3) TatD-related deoxyribonuclease HMQ(3338); AA(182); HA(128); JM(86); BB(46); WL(10) ; OM(5) mevalonate kinase HMQ(1131); JM(45); AA(16); HA(6)
O-sialoglycoprotein endopeptidase HMQ(2408); AA(213); HA(163); JM(99); BB(53); WL(5); LM(3) MiaB-like tRNA modifying enzyme HMQ(5237); AA(252); HA(197); JM(135); BB(88); WL(12) 50S ribosomal protein L15P HMQ(1798); AA(174); HA(133); JM(103); BB(56); WL(19); MB(4) 6,7-dimethyl-8-ribityllumazine synthase HMQ(1365); AA(180); HA(149); JM(50); BB(38); WL(25) 30S ribosomal protein S5P HMQ(3691); AA(416); HA(299); JM(154); BB(105); WL(23); MB(5) carbohydrate kinase, YjeF related protein HMQ(1547); JM(38); HA(27); AA(13); WL(8); BB(6)
ribose-phosphate pyrophosphokinase HMQ(1807); AA(191); HA(158); JM(70); BB(39); WL(11) replication factor C small subunit HMQ(6239); AA(712); HA(225); JM(167); BB(86); WL(19); MB(5) hydrolase HMQ(6012); JM(207); HA(45); AA(22); BB(10)
tyrosyl-tRNA synthetase HMQ(1123); AA(192); HA(128); JM(65); BB(55); WL(6) 50S ribosomal protein L18P HMQ(14)
Fmu (Sun) domain-containing protein HMQ(2680); JM(76); AA(50); HA(47); BB(20); WL(12) 30S ribosomal protein S2 HMQ(834); AA(225); HA(130); JM(48); BB(44); WL(8) leucyl-(isoleucyl-) and (valyl-)tRNA synthetase HMQ(2653); AA(112); JM(78); HA(75); BB(51); WL(7)
Environments of origins were HMQ: Human microbiome Qin2010; JM: Japanese Microbiome; AA: Antarctica Aquatic; HA: Hot Aloha; BB: Botany Bay; WL: Washington Lake; MB: Monterey Bay; SI: Sapelo Island; G: Glacier; LM: Lean Mice; OM: Obese Mice.
distribution of identity to a CPR for class 2 environmen-tal homologs, i.e. the sequences indirectly connected to cultured prokaryotes sequences, is significantly lower, compared to that of class 1 homologs, i.e. the sequences directly connected to cultured prokaryotic sequences (one-sided KS test, p-value 1e-3) (Fig. 1b). Consequently, sequences far away, i.e. separated by more than one edge, from cultured samples in this network are also generally more divergent. Contrary to traditional surveys of genetic diversity based on BLAST searches that only take into account direct matches, the network topology allows the detection of more distant relationships be-tween homologs, through indirect paths of increasing length that nonetheless represent homology.
One might worry that iterative rounds of BLAST, using the last retrieved sequences as seeds, would even-tually retrieve sequences unrelated to initial seeds, des-pite the additional criterion of 80 % mutual cover between two sequences to be considered homologs. This should not be the case if gene families under
investigation occupy relatively isolated regions of the gen-etic space, because each new BLAST round should yield more of the genetic diversity of such gene families until exhaustion is reached. Accordingly, we observed a much lower number of class 2 than class 1 sequences. Figure 1b also shows that sequences from gut samples are found both amongst class 1 and class 2 environmental homo-logs, but in significantly greater proportions amongst class 1 homologs (proptest p-value of 2e-16). By contrast, se-quences from other environmental samples are especially numerous in class 2 homologs. In particular, in this data-set, marine (Botany Bay), cold (Antarctica Aquatic) and hot (Hot Aloa) water environments proved very rich in these most divergent environmental homologs. This difference in relative network positions demonstrates the impact of the strong sequencing effort targeting the hu-man gut microbiome that revealed some (but by no means all) microbial diversity in the environment.
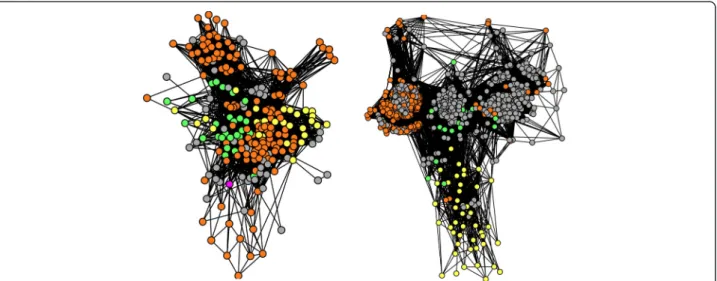
Moreover, the structure of our graphs (Figs. 2 and 3) also allowed us to distinguish groups of divergent
Fig. 1 Distribution of identity percentage to closest published relative for environmental sequences. For each of the 131,162 environmental sequence retrieved by our protocol, the closest published relative is identified as the best BLAST hit against July 2013 release of nr NCBI database. Identity percentage between the two sequences, shown in abscissa, is computed as the hit coverage relatively to the smallest sequence multiplied by the BLAST identity percentage. The proportion of environmental sequences showing a given identity percentage is given in ordinate, in blue for sequences from human gut microbiome and in red for others. a) Class1 (direct link to cultivated hosts sequences) and class2 (indirect link) are cumulated. b) Class1 and Class2 are separated on top and bottom, respectively
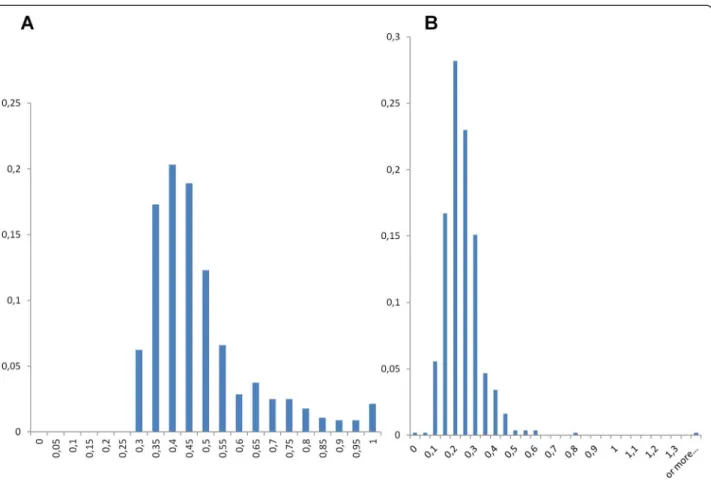
environmental homologs, whose identity to CPRs was lower than 60 %, defining 562 tight clusters (network cliques with exclusively highly divergent environmental content) in the graphs of 69 gene families under study, including ribosomal proteins. Since identical (redundant) sequences had been preliminarily filtered out, the exist-ence of these groups of divergent environmental homo-logs means that, occasionally, many related variants of a given group of divergent environmental homologs are present in nature. Importantly, these cliques should not be confused with phylotypes [38], because there was a
wide range of genetic variation between environmental sequences within these groups, as measured by average nucleotide or amino acid identity (Fig. 4a and Additional file 1: Figure S1). While a few of these groups had an average identity close to 1, indicating very similar se-quences, most cliques had a much lower average residue identity, confirming that the sequences therein were not just close variants of a single sequence produced by se-quencing errors. In fact, the genetic variation within these groups of environmental sequences was compar-able, if only slightly smaller, to that of either archaeal or
Fig. 2 Sequence similarity networks for cultivated hosts sequences and their associated environmental sequences. Each node corresponds to a sequence. Two nodes are connected when they share > = 30 % identity, for a hit covering > = 80 % of both of their lengths, with a BLAST score < 1e-5. Sequences are yellow for Archaea, green for Bacteria, orange for environmental homologs whose identity to their closest published relative is lower than 60 %, and grey for environmental homologs whose identity to their closest published relative is higher than 60 %. Left: DUF167 protein, right: cobalamine phosphate synthase
Fig. 3 Other sequence similarity networks for cultivated hosts sequences and their associated environmental sequences. The color code is the same as in Fig 2. Left: metalloendoprotease, right: ribosomal protein RPL23/25
bacterial cliques of the networks, a remarkable property compatible with the hypothesis that these environmental homologs belong to highly diversified taxonomical groups. Moreover, careful analyses with RDP [39] of the align-ments of these related variants showed no evidence of ei-ther recombination or chimerism in these divergent environmental homologs. Furthermore, dN/dS estimates for these environmental divergent homologs revealed that most of these gene forms were under purifying selection (median of the average dN/dS distribution 0.22, Fig. 4b). These last two observations confirmed that there were very few if no confounders like PCR errors, chimeras and pseudogenes involved in this genetic diversity.
Consequently, our most comprehensive graph-based representation of genetic diversity in metagenomic sam-ples reveals an impressive number of gene families with potentially coding, highly divergent, environmental ho-mologs. Once again, it is worth stressing that most of this genetic diversity cannot be represented nor can it be simultaneously analyzed with their homologs from cul-tured organisms in conventional phylogenetic analyses, because the vast majority of our cliques of distant
homologs cannot be confidently aligned with their cul-tured homologs. Indeed, only 289 out of 562 environ-mental cliques produced alignments with more than 10 unambiguously aligned positions, as assessed by GBlocks [40]. Thus, sequence similarity networks not only pro-vide a novel, sufficient, but also a broader type of evi-dence for identifying clusters of highly divergent environmental sequences with respect to sequences from cultured organisms. The exploration of microbial dark matter therefore directly benefits from this alternative representation of the relationships in molecular data, and the analysis of these paths and cliques.
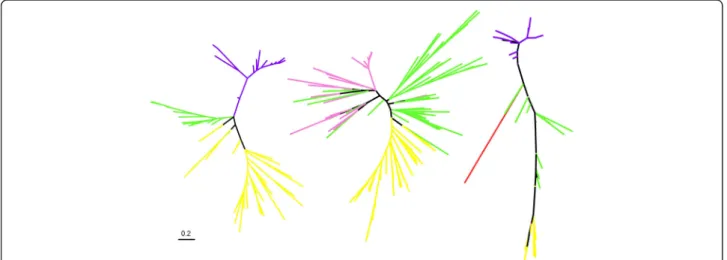
As a further indication that sequence similarity net-works nonetheless also provide evidence for diversity studies consistent with that of phylogenetic trees and networks, we estimated phylogenetic trees including the minority of groups of environmental sequences that could be aligned with sequences from cultured organ-isms from at least 2 domains of life. These expectedly short alignments were used to reconstruct 289 max-imum likelihood unrooted trees for 65 gene families. Some of these divergent environmental homologs
Fig. 4 Distribution of a) Average Amino Acid Identity and b) Average dN/dS for cliques of highly divergent environmental sequences. A total of 569 cliques (totally connected subnetworks) of highly divergent environmental sequences (whose identity to CPR is lower than 60 %) was identified. Sequences from each of these cliques were aligned, and then their average amino acid identity and dN/dS were computed, and shown in abscissa. Proportion of corresponding cliques is given in ordinate
branch within the archaeal and bacterial clans for some genes, and some also branch outside the ar-chaeal and bacterial clans [41] (Fig. 5). Such a phylo-genetic position is compatible with major deep branching divisions. Overall, this analysis further con-firms the large phylogenetic depth within groups of environmental homologs detected in the network, and their significant phylogenetic distance to sequences present in cultured lineages in our dataset. Interest-ingly, we observed such divergent lineages of environ-mental genes in human microbial gut samples. Discussion
Our inclusive multi-marker network-based approach efficiently recovered novel evidence of highly divergent microbial genes, possibly partly originating from micro-bial dark matter, even in the human gut. Of course, one must be careful when interpreting this result, because the divergence between genes does not necessarily re-flect the same phylogenetic divergence between organ-isms that carry those genes. However, although we have not been looking at 16S data, when one considers the gene families for which we report massively divergent environmental homologs under purifying selection, it must be noted that many (18) of the studied gene fam-ilies with these highly divergent forms are ribosomal proteins (also commonly used in phylogenetic recon-struction [42]) and that the broad distribution and infre-quent inter-domain transfer of these gene families suggests they all perform critical functions in cells. Moreover, the detection of groups of divergent environ-mental homologs from these families provides evidence
that these divergent gene forms are not independent genome specific variants (i.e. occasional variants coming from individual, unrelated genomes) but are shared by different related genomes. That related genomes have largely diversified copies for these important gene fam-ilies suggests that a significant fraction of the environ-mental divergent genes may come from gene families with otherwise known functions in cultured organisms. If one assumes that these variants come from known lin-eages, then our results suggest that functional annota-tion in metagenomic studies is incredibly challenging, because adaptation to different environments must lead to massive molecular changes even for such gene families. In that case, environmental divergent genes would partly re-sult from an impressive plasticity of these genes families, affecting even ribosomal proteins, consistently with [9]. Otherwise, these genes could be the extensively diverged descendants of ancient gene duplications (with a potential history of mosaicism or gene fusion). Therefore, when our finding is cautiously interpreted at the gene level, it indi-cates that even gene families that are well-distributed among widely divergent lineages have undergone substan-tial sequence evolution in the environment.
However, the gene level is not the only possible level of explanation for the massive diversity observed in the environment. The detection of groups of environmental homologs (for which we cannot determine whether they are orthologs or paralogs, since precisely we lack their genomes of origins), more divergent on average from any known cultured or viral sequence than the observed divergence between archaea and bacteria for these gene families can also be interpreted at a higher level of
Fig. 5 A phylogeny-based illustration of the actual divergence of some of the environmental homologs detected in our networks. Maximum likelihood phylogenetic trees were based on sequences of archaeal (yellow), bacterial (green), eukaryotes (red) and a subset of the alignable positions of some environmental homologs (purple for gut sequences, pink for other environments), extracted using a maximal clique search. Three trees presenting a remarkable pattern are shown here. Left: cobalamine phosphate synthase (27 alignable positions), middle: RPL29 (52 alignable positions), right: metalloendoprotease (10 alignable positions). A scale bar for branch lengths (number of substitutions per site) is given on bottom left
biological organization. In other words, another (non-ex-clusive) explanation for this genetic variation might also be to consider that some novel lineages of microbes re-main to be discovered. Then, the nature of the hosts of such highly divergent homologs in otherwise “cell-ubi-quitous” gene families becomes a particularly intriguing question. Do divergent lineages of environmental genes point to divergent, deep-branching lineages of organis-mal hosts? There are good reasons to assume the present analysis, as many studies before [9], has revealed molecular cues of novel major life divisions in the envir-onment. Of note, this seems to be the case also in the human gut. First, according to the literature, almost all the genes from these gut samples come from microbial organisms [30]. Second, since most of these genes are under purifying selection, and since they belong to rela-tively ubiquitous, ancient families, including ribosomal proteins, they are probably adaptive to some hosts. Thus, if taken at face value, these deep branching line-ages and groups of divergent environmental genes sug-gest that some major organismal divisions have still not been described and are present in the human gut.
Even though environmental divergent sequences showed no match to known viral sequences, the possibil-ity that some of these environmental divergent forms are carried by viruses rather than hosted in cells remains of course open. But invoking a viral host would either mean that viruses play the role of vehicles, mobilizing these divergent genes from unknown microbial organ-isms (hence signing the presence of novel organismal di-visions), or that there exists a bona fide evolutionary connection between sequences from unknown viruses and genes from 82 ancient gene families well-distributed amongst multiple divergent cellular organisms. This connection would then implicate an ancient relationship between cell and viral lineages in the origin of these genes, as debated in [4, 43], and thus suggest a shared ancestry between large viruses and cells [44]. In either case, the host lineage of the divergent environmental genes would be distantly related to known organismal lineages in a way that may challenge our knowledge of evolutionary microbiology.
Conclusions
Overall our protocol identifies much more divergent (environmental) gene forms than previous analyses of metagenomic data. Our approach complements and ex-pands the scope of diversity analyses based on direct BLAST searches, trees of ribosomal genes, relatively stringent networks of ribosomal genes, or 16S phylo-types, and should prompt further sequencing of complete environmental genomes by providing primers to probe diversity for cells with highly unusual genes. More precisely, existing libraries could be probed for the
hosts of these genes, using primers designed from the alignments of the highly divergent environmental genes detected in our graphs, in order to isolate and amplify their genomic material. Future analyses may also further target these hosts by cell sorting and in situ hybridization analyses on gut microbiome samples to provide microbiological evidence regarding the extent of the microbial dark matter within the environment and within our own body. Of course, the detection of ortho-logs in larger datasets using networks (currently some-thing we have not achieved) could in principles also greatly help to this endeavour. The potential discovery of novel groups would be of major importance in micro-biology and evolutionary micro-biology. Just as the discovery of Archaea spawned an entire research field [45], one can imagine that significant progresses may also result from the discovery of major lineages and remarkable variants of important gene families within the microbial dark matter. As a follow up of this proof of concept analysis, we encourage larger comparative studies, with expanded datasets, including more sequences from cultured organ-isms and from more environments.
Methods
Constitution of the datasets
The initial dataset comprised 564,448 protein sequences from 116 prokaryotic genomes (54 Archaea and 70 Bac-teria, sampled in order to cover prokaryotic diversity as in [33]), 7 eukaryotic genomes (Oryza sativa, Parame-cium tetraurelia, Saccharomyces cerevisiae, Entamoeba histolytica and the nucleomorphs of Guillardia theta, Bigelowiella natans and Hemiselmis andersenii) and various MGE (plasmids and viruses). In addition to this, we used MetaGeneAnnotator [46] to predict 9,456,237 protein sequences longer than 50 amino acids, from 31,779,190 contigs/reads, issued from 236 samples of microbial metagenomics (excluding projects of viral and plasmid metagenomics, see Additional file 1: Table S1 for a detailed list).
Selection of gene families with a strong ancient genealogical signal
We reconstructed the gene network of the initial dataset, defining significant similarity for sequences with a BLAST e-value < 1e-5 and >30 % identity, inferred as the BLAST identity multiplied by hit coverage for the short-est sequence, as in [47]. We computed the conductance [48] of each Domain in each connected component of this network, estimated by the ratio of external edges (from nodes within the Domain to nodes outside the Domain) over internal edges (between nodes within the Domain only). We found 86 connected components with a conductance lower than 0.4 for two Domains, i.e. in which sequences were clearly structured in at least 2
conserved groups corresponding to 2 Domains of Life between which there was no or little evidence of LGT in the graph. These 86 components, called nuclei hereafter, comprised 10,673 sequences. They correspond to hom-ologous sequences, but not necessarily to orthologs.
Rounds of BLAST searches to gather environmental homologs
We BLASTed the 10,673 nuclei sequences against the 9,456,237 predicted environmental ORFs (TBLASTN, e-value threshold = 1e-5, 500 hits). Then, the 232,660 retrieved environmental ORFs were used as seeds for a second round of BLASTN (to avoid possible detection problems caused by frameshifts, e-value threshold = 1e-5, 500 hits) against the predicted environmental ORFs to look for their own homologs in the environment. This protocol yielded a dataset with a total of 309,245 sequences (298,578 environmental ones) to reconstruct a sequence network with nuclei and environmental sequences.
Reconstruction of exploratory similarity networks
Environmental sequences were translated into proteins, and the previous 309,245 sequences were BLASTed all against all (BLASTP, e-value threshold = 1e-5, 5000 hits to avoid artefactual increases in the distance between en-vironmental ORFs and nuclei in similarity networks, in case a given sequence from a nuclei hits > 500 environ-mental ORFs). BLAST results were used to reconstruct an exploratory similarity network, where nodes repre-sent sequences and a “homology edge” is created between two nodes if the two sequences show a BLAST e-value < 1e-5, more than 30 % identity and a match cov-ering at least 80 % of both the compared sequences. This latter condition ensures that no two sequences are con-nected by the mere sharing of a gene fragment (e.g. a domain). This similarity network retained 131,162 envir-onmental sequences, and yielded 82 connected compo-nents: adding environmental sequences made most of the nuclei grow into independant connected component, but a in a few cases two nuclei were united into the same component.
Analyses of the exploratory similarity networks
All the environmental sequences from each of the 82 connected components were BLASTed against the July 2013 release of Genbank nr database (BLASTP, e-value threshold 1e-5) to quantify the identity percentage be-tween each of these environmental ORFs and its closest sequence in nr, called closest published relative (CPR). Thus, comparison was made against all eukaryotic and prokaryotic sequences deposited at this date. CPR were computed relatively to the shortest sequence, as BLAST identity multiplied by hit coverage for the shortest
sequence. Moreover, the topological distance of each of these environmental ORFs to a reference genome from the three Domains of life was estimated by the number of edges separating them in the graph. Class1 sequences were identified as environmental ORFs directly con-nected to a nucleus sequence. Class2 sequences were identified as environmental ORFs directly connected to a class1 sequence, but not to a nucleus sequence.
Visualization of sequence spaces and landscapes
All similarity networks were displayed with Gephi v0.8.1 software (https://gephi.org), using the ‘Yifan-Hu multi-level’ layout. This particular layout ensures a maximal readability of the connected components, by placing node from densely connected parts of the network close together.
Extraction and analysis of highly divergent closely related environmental sequences
Maximal cliques (totally connected subnetworks) of envir-onmental sequences whose identity to a CPR was lower than 60 % were identified in the previous 82 components using MACE [49], yielding 562 subsets of closely related environmental sequences. Each of these subsets was aligned with MUSCLE v3.8 [50], then tested for potential recombination with RDP3 [39]. Corresponding nucleotide alignments were also analyzed with yn00 software from the PAML v4.7 package [51, 52]. For each clique, average dN/dS ratio was computed as the average of pairwise omega parameters. MUSCLE alignments were used to compute average residue identity, as the mean of pairwise identity percentages for each clique. All scripts used to measure conductances and network distances, and to ex-tract largest maximal cliques in our networks are available from PL upon request.
Phylogenetic analyses of closely related environmental sequences
For phylogenetic purposes, environmental clique amino acid sequences were aligned with their nucleus counter-parts using MUSCLE, and ambiguously aligned regions were discarded with GBlocks v0.91b [40]. Only 289 streamlined alignments retained more than 10 residues, confirming that a large number of cliques contained extremely distant homologs of nucleus sequences. Unrooted maximum likelihood trees were then recon-structed from these 289 alignments using PhyML v3.0 [53] with default parameters.
Reviewers’ comments
Reviewer’s report 1 (Eugene Koonin, National Center for Biotechnology Information, USA)
Summary: Lopez and colleagues report an extensive analysis of metagenomic sequences that demonstrates
the presence of highly diverged versions of (nearly) universal genes including 18 coding for ribosomal proteins. The results are deemed compatible with the existence of "new divisions of life". I think this cau-tious conclusion is justified. Although some of the sequences are more distant from bacteria and archaea than the latter are from each other, a conservative standpoint is that these sequences are more likely to represent fast evolving bacteria or archaea than new domains of cellular life. Again, the authors are quite cautious in their interpretations and never overstate their case. All in all, this is an interesting and import-ant article.
Author’s response: we thank the reviewer for his appreciation of our work.
Recommandations: I have no major recommenda-tions. Minor recommendation: it seems desirable to cite and briefly discuss the following recent publications that are directly relevant to the theme of this article: Luef B, Frischkorn KR, Wrighton KC, Holman HY, Birarda G, Thomas BC, Singh A, Williams KH, Siegerist CE, Tringe SG, Downing KH, Comolli LR, Banfield JF. Diverse un-cultivated ultra-small bacterial cells in groundwater. Nat Commun. 2015 Feb 27;6:6372 Brown CT, Hug LA, Thomas BC, Sharon I, Castelle CJ, Singh A, Wilkins MJ, Wrighton KC, Williams KH, Banfield JF. Unusual biol-ogy across a group comprising more than 15 % of domain Bacteria. Nature. 2015 Jul 9;523(7559):208–11
Author’s response: we agree with the reviewer and have now cited and discussed these two important arti-cles in the introduction and conclusion.
Minor Issues : The text of the article requires some additional editing, preferably, by a native English speaker.
Author’s response: the manuscript has been edited by a native English speaker.
Reviewer’s report 2 (William Martin, Heinrich-Heine-Universität, Germany)
Summary : The authors present novel (network) methods to address diversity in envirnomental se-quences. The paper is very interesting and technically an important step in the right direction to explore more of what we do not know about environmental microbial diversity. It can be published as is in my view, some language editing by a native speaker would help, I listed some but by no means all style and usage prob-lems below.
Author’s response: we thank the reviewer for his comments and for pointing out the interest of the method.
Recommandations: p. 1.
l. 30 life levels? reword, not clear l 43, tres of life— > phylogenetic trees
papers should be line numbered continuously in the future, please, makes commenting easier.
life division— > divisions of life
have been constant progresses — has been constant progress
obsidian Pool , capitalization
polymorphism. 30 % of the genes — > polymorphism. Thirty percent of the genes (never start a sentence with a numeral)
Likewise, in 2005, Chouari et al. : reference number? In 2012, Narasingarao et al. : reference number? it seems that one could in principle come up with some novel microbial lineages, at various levels of the biological classification — > novel microbial lineages are being discovered through environmental sequencing.
microbial dark universe : was dark matter already introduced?
these data are amongst the most numerous — > these data are amongst the most abundant
seeked to identify— sought to identify
families fulfilled these— families fulfilling these protocole—protocol
important amount of microbial divergent genes — substantial number of divergent microbial genes
proved its efficiency to unravel — was efficient in uncovering
such gene families !— why !
In either case, the host lineage of the divergent envir-onmental genes would be
439 distantly related to known organismal lineages in a way that may challenge our
knowledge in evolutionary 440 microbiology. As a follow up of this proof of concept
441 analysis, it would next be interesting to perform larger comparative studies, with
442 expanded datasets, including more sequences from cultured organisms and from more
443 environments, this new dataset might identify other ancient, divergent, rarely
444 transferred between domains gene families. Sorry, is that essential and what is it supposed to mean?
theories on the origins of eukaryotes [41]– Woese did not revolutionize theories for eukaryote origin, he (co-)dis-covered archae(bacteri)a and introduced the concept of microbial phylogeny.
Author’s response: typos have been corrected and the manuscript has been edited in accordance with the re-viewer’s points.
Reviewer’s report 3 (James McInerney, University of Manchester, U.K.)
Summary : This is an interesting paper that demon-strates quite clearly that environmental sequence space is not well known and that future work should aim to
explore this. I have no real problems with the manu-script, just some minor comments.
Author’s response: We thank the reviewer for his interest in our work.
Recommandations:
Major Comments: None. Minot comments On Fig. 5, can you put a scale bar on the figures?
Author’s response: A scale bar has been added to the figure.
Minor Issues: Minor points: 1. The language needs a little work, with some of the sentences having awkward phrasing. 2. The paper is quite long. The introduction and the discussion in particular were quite long and might benefit from being reduced in length. 3. When phylogenies were made from those sequences that could be aligned, how likely is it that long-branch attraction occurred and therefore pulled the sequences out of the bacterial or archaebacterial groups?
Author’s response: 1) A native English speaker has edited the manuscript. 2) Introduction and discussion have been shortened so that the article is easier to read. 3) Long-branch attraction could indeed be responsible for the particular location of environmental sequences in the trees from Fig. 5. However, sequences have been trimmed by Gblocks prior to reconstruction, yielding a very small number of positions that could be reliably aligned, which should reduce (but not rule out) the like-lihood of long-branch attraction. We take this opportun-ity to recommend again the use of networks instead of trees for exploring high sequence divergence.
Additional files
Additional file 1: Table S1. Environmental dataset. A total of 236 environmental microbial samples was used in this study. For each sample, environmental origin, number of predicted Open Reading Frames (total and longer than 50 amino acids) and data source are given. Figure S1 Distribution of Average Nucleotide Identity of highly divergent environmental sequences. A total of 569 cliques (totally connected subnetworks) of highly divergent environmental sequences (whose identity to CPR is lower than 60 %) was identified. Sequences from each of these cliques were aligned, then their average nucleotide identity were computed, and shown in abscissa. Proportion of corresponding cliques is given in ordinate. (PDF 89 kb)
Competing interests
We declare no competing interests. Authors' contributions
PL and EB designed the study, performed the analysis, and wrote the manuscript. SH reconstructed the networks. All authors read and approved the final manuscript.
Acknowledgements
This work was supported by the European Research Council FP7 [2007–2013 Grant Agreement n°615274] to E.B, and S.H. was supported by a Genome Canada/Genome Quebec research grant (Genorem) awarded to M. St-Arnaud and M. Hijri. We thank R.M. Burian, D. Bhattacharya and J.W. Leigh for critical reading.
Author details
1
Team‘Adaptation, Integration, Reticulation, Evolution’ – UMR CNRS 7138 Evolution Paris Seine– Institut de Biologie Paris Seine – Université Pierre et Marie Curie, 7 quai St Bernard, 75005 Paris, France.2Département de Sciences Biologiques, Institut de recherche en biologie végétale, Université de Montréal, Montréal, QC H1X 2B2, Canada.
Received: 30 July 2015 Accepted: 13 October 2015
References
1. Hugenholtz P, Pitulle C, Hershberger KL, Pace NR. Novel division level bacterial diversity in a Yellowstone hot spring. J Bacteriol. 1998;180(2):366–76. 2. Chouari R, Le Paslier D, Dauga C, Daegelen P, Weissenbach J, Sghir A. Novel
major bacterial candidate division within a municipal anaerobic sludge digester. Appl Environ Microbiol. 2005;71(4):2145–53. doi:10.1128/ AEM.71.4.2145-2153.2005.
3. Rappe MS, Giovannoni SJ. The uncultured microbial majority. Annu Rev Microbiol. 2003;57:369–94. doi:10.1146/annurev.micro.57.030502.090759. 4. Boyer M, Madoui MA, Gimenez G, La Scola B, Raoult D. Phylogenetic and
phyletic studies of informational genes in genomes highlight existence of a 4 domain of life including giant viruses. PLoS One. 2010;5(12), e15530. doi:10.1371/journal.pone.0015530.
5. Dinsdale EA, Edwards RA, Hall D, Angly F, Breitbart M, Brulc JM, et al. Functional metagenomic profiling of nine biomes. Nature. 2008;452(7187):629–32. doi:10.1038/nature06810.
6. Luef B, Frischkorn KR, Wrighton KC, Holman HY, Birarda G, Thomas BC, et al. Diverse uncultivated ultra-small bacterial cells in groundwater. Nat Commun. 2015;6:6372. doi:10.1038/ncomms7372.
7. Marcy Y, Ouverney C, Bik EM, Losekann T, Ivanova N, Martin HG, et al. Dissecting biological "dark matter" with single-cell genetic analysis of rare and uncultivated TM7 microbes from the human mouth. Proc Natl Acad Sci U S A. 2007;104(29):11889–94. doi:10.1073/pnas.0704662104.
8. Lagier JC, Armougom F, Million M, Hugon P, Pagnier I, Robert C, et al. Microbial culturomics: paradigm shift in the human gut microbiome study. Clin Microbiol Infect. 2012;18(12):1185–93. doi:10.1111/1469-0691.12023. 9. Brown CT, Hug LA, Thomas BC, Sharon I, Castelle CJ, Singh A, et al. Unusual
biology across a group comprising more than 15 % of domain Bacteria. Nature. 2015;523(7559):208–11. doi:10.1038/nature14486.
10. Beja O, Suzuki MT, Heidelberg JF, Nelson WC, Preston CM, Hamada T, et al. Unsuspected diversity among marine aerobic anoxygenic phototrophs. Nature. 2002;415(6872):630–3. doi:10.1038/415630a.
11. Giovannoni SJ, Britschgi TB, Moyer CL, Field KG. Genetic diversity in Sargasso Sea bacterioplankton. Nature. 1990;345(6270):60–3. doi:10.1038/345060a0.
12. Moreira D, Rodriguez-Valera F, Lopez-Garcia P. Metagenomic analysis of mesopelagic Antarctic plankton reveals a novel deltaproteobacterial group. Microbiology. 2006;152(Pt 2):505–17. doi: 10.1099/mic.0.28254-0. 13. Murray AE, Grzymski JJ. Diversity and genomics of Antarctic marine
micro-organisms. Philos Trans R Soc Lond B Biol Sci. 2007;362(1488):2259–71. doi:10.1098/rstb.2006.1944.
14. Chouari R, Le Paslier D, Daegelen P, Ginestet P, Weissenbach J, Sghir A. Molecular evidence for novel planctomycete diversity in a municipal wastewater treatment plant. Appl Environ Microbiol. 2003;69(12):7354–63. 15. Derakshani M, Lukow T, Liesack W. Novel bacterial lineages at the
(sub)division level as detected by signature nucleotide-targeted recovery of 16S rRNA genes from bulk soil and rice roots of flooded rice microcosms. Appl Environ Microbiol. 2001;67(2):623–31. doi:10.1128/ AEM.67.2.623-631.2001.
16. Barns SM, Delwiche CF, Palmer JD, Pace NR. Perspectives on archaeal diversity, thermophily and monophyly from environmental rRNA sequences. Proc Natl Acad Sci U S A. 1996;93(17):9188–93.
17. Fuhrman JA, McCallum K, Davis AA. Novel major archaebacterial group from marine plankton. Nature. 1992;356(6365):148–9. doi:10.1038/356148a0. 18. Lopez-Garcia P, Moreira D, Lopez-Lopez A, Rodriguez-Valera F. A novel
haloarchaeal-related lineage is widely distributed in deep oceanic regions. Environ Microbiol. 2001;3(1):72–8.
19. Dawson SC, Pace NR. Novel kingdom-level eukaryotic diversity in anoxic environments. Proc Natl Acad Sci U S A. 2002;99(12):8324–9. doi:10.1073/ pnas.062169599.
20. Le Calvez T, Burgaud G, Mahe S, Barbier G, Vandenkoornhuyse P. Fungal diversity in deep-sea hydrothermal ecosystems. Appl Environ Microbiol. 2009;75(20):6415–21. doi:10.1128/AEM.00653-09.
21. Slapeta J, Moreira D, Lopez-Garcia P. The extent of protist diversity: insights from molecular ecology of freshwater eukaryotes. Proc Biol Sci.
2005;272(1576):2073–81. doi:10.1098/rspb.2005.3195.
22. Lecroq B, Lejzerowicz F, Bachar D, Christen R, Esling P, Baerlocher L, et al. Ultra-deep sequencing of foraminiferal microbarcodes unveils hidden richness of early monothalamous lineages in deep-sea sediments. Proc Natl Acad Sci U S A. 2011;108(32):13177–82. doi:10.1073/pnas.1018426108. 23. Rinke C, Schwientek P, Sczyrba A, Ivanova NN, Anderson IJ, Cheng JF, et al.
Insights into the phylogeny and coding potential of microbial dark matter. Nature. 2013;499(7459):431–7. doi:10.1038/nature12352.
24. Wu D, Wu M, Halpern A, Rusch DB, Yooseph S, Frazier M, et al. Stalking the fourth domain in metagenomic data: searching for, discovering, and interpreting novel, deep branches in marker gene phylogenetic trees. PLoS One. 2011;6(3):e18011. doi:10.1371/journal.pone.0018011.
25. Philippe N, Legendre M, Doutre G, Coute Y, Poirot O, Lescot M, et al. Pandoraviruses: amoeba viruses with genomes up to 2.5 Mb reaching that of parasitic eukaryotes. Science. 2013;341(6143):281–6. doi:10.1126/ science.1239181.
26. Narasingarao P, Podell S, Ugalde JA, Brochier-Armanet C, Emerson JB, Brocks JJ, et al. De novo metagenomic assembly reveals abundant novel major lineage of Archaea in hypersaline microbial communities. ISME J. 2012;6(1):81–93. doi:10.1038/ismej.2011.78.
27. Sunagawa S, Mende DR, Zeller G, Izquierdo-Carrasco F, Berger SA, Kultima JR, et al. Metagenomic species profiling using universal phylogenetic marker genes. Nat Methods. 2013;10(12):1196–9. doi:10.1038/nmeth.2693. 28. Nielsen HB, Almeida M, Juncker AS, Rasmussen S, Li J, Sunagawa S, et al.
Identification and assembly of genomes and genetic elements in complex metagenomic samples without using reference genomes. Nat Biotechnol. 2014;32(8):822–8. doi:10.1038/nbt.2939.
29. Kurokawa K, Itoh T, Kuwahara T, Oshima K, Toh H, Toyoda A, et al. Comparative metagenomics revealed commonly enriched gene sets in human gut microbiomes. DNA Res. 2007;14(4):169–81. doi:10.1093/dnares/ dsm018.
30. Qin J, Li R, Raes J, Arumugam M, Burgdorf KS, Manichanh C, et al. A human gut microbial gene catalogue established by metagenomic sequencing. Nature. 2010;464(7285):59–65. doi:10.1038/nature08821.
31. Arumugam M, Raes J, Pelletier E, Le Paslier D, Yamada T, Mende DR, et al. Enterotypes of the human gut microbiome. Nature. 2011;473(7346):174–80. doi:10.1038/nature09944.
32. Lynch MD, Bartram AK, Neufeld JD. Targeted recovery of novel phylogenetic diversity from next-generation sequence data. ISME J. 2012;6(11):2067–77. doi:10.1038/ismej.2012.50.
33. Alvarez-Ponce D, Lopez P, Bapteste E, McInerney JO. Gene similarity networks provide tools for understanding eukaryote origins and evolution. Proc Natl Acad Sci U S A. 2013;110(17):E1594–603. doi:10.1073/
pnas.1211371110.
34. Wu M, Eisen JA. A simple, fast, and accurate method of phylogenomic inference. Genome Biol. 2008;9(10):R151. doi:10.1186/gb-2008-9-10-r151. 35. Wu D, Jospin G, Eisen JA. Systematic identification of gene families for use
as "markers" for phylogenetic and phylogeny-driven ecological studies of bacteria and archaea and their major subgroups. PLoS One.
2013;8(10):e77033. doi:10.1371/journal.pone.0077033.
36. Meyer F, Paarmann D, D'Souza M, Olson R, Glass EM, Kubal M, et al. The metagenomics RAST server - a public resource for the automatic phylogenetic and functional analysis of metagenomes. BMC Bioinformatics. 2008;9:386. doi:10.1186/1471-2105-9-386.
37. Haggerty LS, Jachiet PA, Hanage WP, Fitzpatrick DA, Lopez P, O'Connell MJ, et al. A pluralistic account of homology: adapting the models to the data. Mol Biol Evol. 2014;31(3):501–16. doi:10.1093/molbev/mst228.
38. Caporaso JG, Kuczynski J, Stombaugh J, Bittinger K, Bushman FD, Costello EK, et al. QIIME allows analysis of high-throughput community sequencing data. Nat Methods. 2010;7(5):335–6. doi:10.1038/nmeth.f.303.
39. Martin DP, Lemey P, Lott M, Moulton V, Posada D, Lefeuvre P. RDP3: a flexible and fast computer program for analyzing recombination. Bioinformatics. 2010;26(19):2462–3. doi:10.1093/bioinformatics/btq467. 40. Castresana J. Selection of conserved blocks from multiple alignments for
their use in phylogenetic analysis. Mol Biol Evol. 2000;17(4):540–52.
41. Lapointe FJ, Lopez P, Boucher Y, Koenig J, Bapteste E. Clanistics: a multi-level perspective for harvesting unrooted gene trees. Trends Microbiol. 2010;18(8):341–7. doi:10.1016/j.tim.2010.03.009.
42. Ciccarelli FD, Doerks T, von Mering C, Creevey CJ, Snel B, Bork P. Toward automatic reconstruction of a highly resolved tree of life. Science. 2006;311(5765):1283–7. doi:10.1126/science.1123061.
43. Williams TA, Embley TM, Heinz E. Informational gene phylogenies do not support a fourth domain of life for nucleocytoplasmic large DNA viruses. PLoS One. 2011;6(6):e21080. doi:10.1371/journal.pone.0021080. 44. Nasir A, Kim KM, Caetano-Anolles G. Giant viruses coexisted with the
cellular ancestors and represent a distinct supergroup along with superkingdoms Archaea, Bacteria and Eukarya. BMC Evol Biol. 2012;12:156. doi:10.1186/1471-2148-12-156.
45. Woese CR, Fox GE. Phylogenetic structure of the prokaryotic domain: the primary kingdoms. Proc Natl Acad Sci U S A. 1977;74(11):5088–90. 46. Noguchi H, Taniguchi T, Itoh T. MetaGeneAnnotator: detecting
species-specific patterns of ribosomal binding site for precise gene prediction in anonymous prokaryotic and phage genomes. DNA Res. 2008;15(6):387–96. doi:10.1093/dnares/dsn027.
47. Beauregard-Racine J, Bicep C, Schliep K, Lopez P, Lapointe FJ, Bapteste E. Of woods and webs: possible alternatives to the tree of life for studying genomic fluidity in E. coli. Biol Direct. 2011;6:39; discussion doi:10.1186/ 1745-6150-6-39.
48. Leskovec J, Lang KJ, Dasgupta A, Mahoney MW. Statistical properties of community structure in large social and information networks. 17th international conference on World Wide Web.; Beijing, China2008. p. 695–704. 49. Makino K, Uno T. New Algorithms for Enumerating All Maximal Cliques. In:
Hagerup T, Katajainen J, editors. Algorithm Theory - SWAT 2004. Humlebaek, Denmark: Springer; 2004. p. 260-72.
50. Edgar RC. MUSCLE: multiple sequence alignment with high accuracy and high throughput. Nucleic Acids Res. 2004;32(5):1792–7. doi:10.1093/nar/ gkh340.
51. Yang Z. PAML 4: phylogenetic analysis by maximum likelihood. Mol Biol Evol. 2007;24(8):1586–91. doi:10.1093/molbev/msm088.
52. Yang Z, Nielsen R. Estimating synonymous and nonsynonymous substitution rates under realistic evolutionary models. Mol Biol Evol. 2000;17(1):32–43.
53. Guindon S, Dufayard JF, Lefort V, Anisimova M, Hordijk W, Gascuel O. New algorithms and methods to estimate maximum-likelihood phylogenies: assessing the performance of PhyML 3.0. Syst Biol. 2010;59(3):307–21. doi:10.1093/sysbio/syq010.
Submit your next manuscript to BioMed Central and take full advantage of:
• Convenient online submission
• Thorough peer review
• No space constraints or color figure charges
• Immediate publication on acceptance
• Inclusion in PubMed, CAS, Scopus and Google Scholar
• Research which is freely available for redistribution
Submit your manuscript at www.biomedcentral.com/submit