HAL Id: cea-02063619
https://hal-cea.archives-ouvertes.fr/cea-02063619
Submitted on 11 Mar 2019
HAL is a multi-disciplinary open access
archive for the deposit and dissemination of
sci-entific research documents, whether they are
pub-lished or not. The documents may come from
teaching and research institutions in France or
abroad, or from public or private research centers.
L’archive ouverte pluridisciplinaire HAL, est
destinée au dépôt et à la diffusion de documents
scientifiques de niveau recherche, publiés ou non,
émanant des établissements d’enseignement et de
recherche français ou étrangers, des laboratoires
publics ou privés.
Qualification of the MEXIICO loop dedicated to nuclear
power transients: An experimental and modelling
approach
Thierry Cadiou, Eric Hanus, Pierre-Philippe Malgouyres, Michel Freyss
To cite this version:
Thierry Cadiou, Eric Hanus, Pierre-Philippe Malgouyres, Michel Freyss. Qualification of the
MEXI-ICO loop dedicated to nuclear power transients: An experimental and modelling approach.
Nu-clear Engineering and Design, Elsevier, 2018, 330, pp.72-86. �10.1016/j.nucengdes.2018.01.009�.
�cea-02063619�
Contents lists available atScienceDirect
Nuclear Engineering and Design
journal homepage:www.elsevier.com/locate/nucengdesQuali
fication of the MEXIICO loop dedicated to nuclear power transients: An
experimental and modelling approach
Thierry Cadiou
⁎, Eric Hanus, Pierre-Philippe Malgouyres, Michel Freyss
CEA Cadarache, 13108 Saint-Paul-Lez-Durance, France
A R T I C L E I N F O
Keywords: MEXIICO furnace CFD Compressiblefluid Gas depressurization Fission gas releaseA B S T R A C T
The MEXIICO project carried out by the CEA and supported by EDF and AREVA has the objective to characterize the behaviour of irradiated fuel pellet issued from nuclear water reactor during power transients. The MEXIICO experimental loop has been recently implemented in the LECA-STAR facility of the CEA Cadarache. It will allow studying the fuel fragmentation of nuclear fuels submitted to various temperature and pressure histories (up to1600 °C and 1600 bar) using the monitoring of released85Kr activity during the experiment.
Since thefission gas release is measured thanks to a gamma detector located in the rear cell, while the nuclear fuel sample is located inside the MEXIICO furnace in the hot cell, it is necessary to take into account the re-sidence time of the gas in the loop to accurately correlatefission gas release to the local temperature and pressure conditions of the sample, which are also time dependent.
In this paper, we will compare a thermal hydraulic approach mixing both an analytical method and a nu-merical CFD simulation to experimental test results. This modelling of the MEXIICO loop will support the in-terpretation of future tests, and will allow, more precisely, to determine the fuel fragmentation thresholds for various stress conditions.
1. Introduction
The MEXIICO experimental loop, recently implemented in the LECA-STAR facility in the CEA Cadarache has been designed to study the fuel behaviour during power transients by a nuclear irradiated fuel sample submitted to temperature and pressure transients (MEXIICO, 2016). It will thus allow performing analytical separate effect tests, which will be of great value in order to better understand the fuel be-haviour under different kind of nuclear reactor transients (Kashibe and Une, 2000); (Pontillon et al., 2005).
Indeed, depending on the choice of the temperature and pressure histories (up to 1600 °C and 1600 bar), It will provide useful data re-garding the impact of hydrostatic stress conditions on the fuel frag-mentation for different kind of fuels, UO2or MOX fuel at intermediate
or high burn-up rates, i.e. for different kind of fuel microstructure with or without High Burn-Up structures (NRC LOCA, 2012).
The slow depressurization tests carried out in the MEXIICO loop enable to characterize the fuel fragmentation state by the measure of thefission gas released by a pellet sample during the experiment (Une et al., 2001). In the MEXIICO facility, the emission offission gas is made possible by progressively decreasing pressure in the furnace that con-tains the fuel pellet.
Since fission gas release is measured thanks to gamma detector placed in the rear zone of the hot cell, requiring thus a long piping between fuel sample and fission gas detection, it is of primary im-portance to accurately evaluate the residence time of thefission gas inside the piping.
The objective of this paper is to present the dual approach mixing experimental evaluation and theoretical calculation of this residence time. In thefirst section, we will describe the MEXIICO experimental loop, focusing on the different parts of the facility. In the second sec-tion, we will describe the experimental setup used to characterize the gas residence time. In the third section, we will present an analytical and a numerical simulation based on Computational Fluid Dynamics (CFD) with the STAR-CCM + software to evaluate the residence time. In the last section, the comparison between experimental results and modelling will be dealt with.
2. The MEXIICO experimental loop 2.1. General view of the loop
The MEXIICO furnace, as viewed inFig. 1, is the essential compo-nent of the loop in which the fuel pellet is present in order to be heated
https://doi.org/10.1016/j.nucengdes.2018.01.009
Received 4 July 2017; Received in revised form 12 December 2017; Accepted 2 January 2018
⁎Corresponding author.
E-mail address:thierry.cadiou@cea.fr(T. Cadiou).
0029-5493/ © 2018 Elsevier B.V. All rights reserved.
Nomenclature
CFD Computational Fluid Dynamics
MEXIICO Experimental tool for insertion of important Stresses RANS Reynolds-Averaged Navier-Stokes
VDW Van Der Waals gas
Abbreviation
T Argon temperature, K
TA Upward argon temperature, K
TB Downward argon temperature, K
∗
T Critical temperature, K
Text Room temperature, K
Tinit Initial temperature, K
T z( ) Temperature at position z on the z axis, K
P Argon pressure, Pa
PA Upward argon pressure, Pa
PB Downward Argon pressure, Pa
∗
P Pressure at the nozzle, Pa
Pext Atmospheric pressure, Pa
P
Δ Loss of pressure, Pa
ρA Upward Argon density, kg/m3
ρB Downward Argon density, kg/m3
ρ Argon density, kg/m3
ρ1 Argon density in high pressure and high temperature re-gion, kg/m3
ρ2 Argon density in high pressure and room temperature re-gion, kg/m3
ρext Argon density in low pressure and room temperature re-gion, kg/m3
cP Heat capacity at constant pressure, J/kg-K
v Argon velocity, m/s
v1 Argon velocity in high pressure and high temperature
re-gion, m/s
v2 Argon velocity in high pressure and room temperature
region, m/s
vext Argon velocity in low pressure and room temperature
re-gion, m/s
∗
v Argon velocity at the nozzle, m/s
c Sonic velocity ( =c γ r T· · ), m/s
D Massflowrate, kg/s
∗
D Massflowrate at the nozzle, kg/s
Q Volumeflowrate, m3/s
∗
S Critical section, m2
S1 Argon section in high pressure and high temperature
re-gion, m2
S2 Argon section in high pressure and room temperature
re-gion, m2
Sext Argon section in low pressure and room temperature
re-gion, m2
R Constant of perfect gas, J/K-mol
M Argon molar mass (39.948.10−3), kg/mol
a Van der Waals constant (for argon a = 0,135), J.M3.mol−2
b Van der Waals constant (for argon b = 0,0000322),
m3.mol−1
Tc Critical temperature for Van der Waals gas, K
Pc Critical pressure for Van der Waals gas, Pa
m Gas mass, kg
n Number of moles, mol
V Volume of the MEXIICO furnace, m3
h Heat transfer coefficient between Argon loop and air, W/
m2-K
and pressurized to specified experimental conditions.
The experimental loop, seeFig. 2, is designed for measuring the gas release kinetics out of the fuel pellet versus temperature and pressure during a pre-determined scenario of slow depressurization. For that purpose, the MEXIICO loop is composed of a high and a low pressure sectionfilled by argon which plays the role of the carrier gas. The high pressure section represented in red is separated from the low pressure one in blue by a throttle valve with a variable opening. By this way, the argon flowrate, which transports fission gas, is controlled in order to expand it to atmospheric pressure (Experiments to Study the Gaseous, 1997).
2.2. The throttle valve
2.2.1. Presentation of the component
The throttle valve has the function to drop the argon pressure from the furnace pressure to the atmospheric pressure while dynamically controlling the outlet argonflowrate thanks to a variable opening, in order to analyze thefission gas dragged along by argon (seeFig. 3). 2.2.2. The operation principle
The throttle valve consists in a convergent pipe followed by a di-vergent one (seeFig. 4) (Candel and Dunod, 2001).
With a compressible gas, theflowrate at the nozzle, called critical flowrate, is sonic, regardless of the downward pressure. The initially subsonic flow (upward of the nozzle) becomes supersonic after the nozzle. For a Mach number M, modifications in temperature, pressure and density for a perfect gas on both sides of the nozzle are given by (A: upward, B: downward): = + − T T γ M 1 1 2 · A B 2 (1) = ⎛ ⎝ + − ⎞ ⎠ − P P γ M 1 1 2 · A B γ γ 2 1 (2) = ⎛ ⎝ + − ⎞ ⎠ − ρ ρ γ M 1 1 2 · A B γ 2 1 1 (3) with:γ=c =1667 c p
v gamma (ratio of the argon heat capacity at constant pressure and constant volume) (−)M=v
c: Mach number (−)v: Flow
velocity (m/s)c: Sound velocity (m/s)TAand TB: Upward and downward
temperature (K)PAandPB: Upward and downward pressure (Pa)ρAand
ρB: Upward and downward density (kg/m3)
The section at the nozzle is deduced from the imposed outlet flowrate. As the flow is sonic, i.e. M = 1(noted∗), we get:
= + = ∗ T T γ 1 2 1,33 A (4) = ⎛ ⎝ + ⎞ ⎠ = ∗ − P P γ 1 2 2,05 A γ γ 1 (5) = ⎛ ⎝ + ⎞ ⎠ = ∗ − ρ ρ γ 1 2 1,66 A γ11 (6)
2.2.2.1. Determination of the section. The criticalflow at the nozzle is written:
=
∗ ∗ ∗ ∗
D ρ S v· · (7)
with:D∗: Criticalflow (kg/s)ρ∗: Critical density (kg/m3
)S∗: Section at
the nozzle (m2)
For a perfect gas, the density is equal to:
Fig. 2. Description of furnace and downward MEXIICO loop.
=
∗ ∗ ∗
ρ P
r T· (8)
The speed of the sound is:
= =
∗ ∗ ∗
v c γ r T· · (9)
with:R: Gas constant (J/kg/mol)M = 39,948 · 10−3: Argon molar mass (kg/mol) =r R
M: Reduced constant of argon (J/kg-K)
The critical flowrate is expressed as a function of the upward pressure, sonic speed and critical section:
= = = = ∗ ∗ ∗ ∗ ∗ ∗ ∗ ∗ + − + ∗ ∗
( )
D ρ S v P r T S γ r T P r T S γ r S P c · · · · · · · · · · · · · Γ· · A γ γ γ γ A A A 2 1 1 2 1 (10) with = = + + −( )
γ Γ · 0,9375 γ γ γ 2 1 1 2·( 1)Knowing the massflowrate imposed at the loop outlet, the flow area at the throttle valve is:
= = ∗ ∗ ∗ ∗ ∗ S D ρ v D c P · · Γ· A A (11)
2.3. The gasflow in the high and low pressure pipes
Thefission gas is emitted from the fuel pellet in the high pressure region consisting of an internal diameter pipe of 2.4 mm over a length of 5,385 m, before being expanded through the throttle valve. The gas then continues in the low pressure region (diameters successively of 5, 6, 4 and 6 mm) up to the outlet.
The characteristics (length and diameter) of the different pipes of the MEXIICO loop are presentedFig. 5. The residence time corresponds to the time necessary forfission gas to cross the whole loop before being detected 36,84 m downstream.
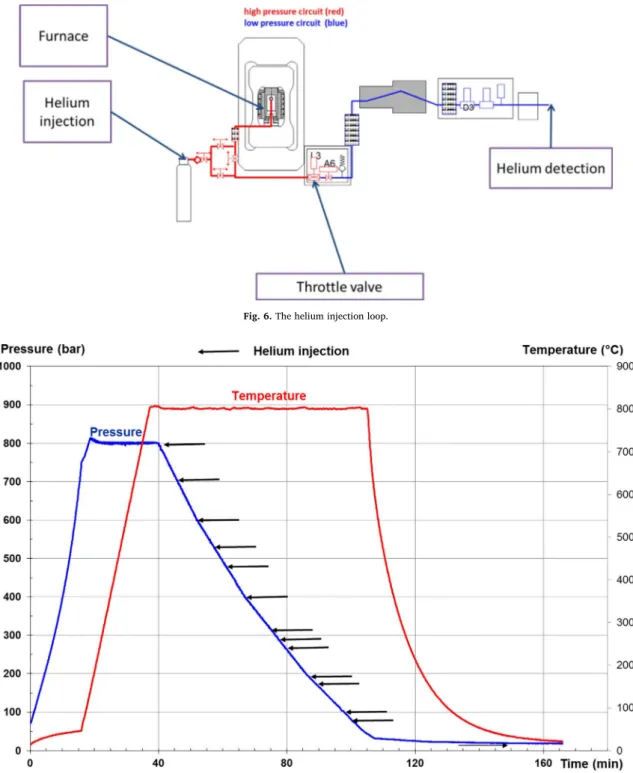
3. Experimental determination of thefission gas residence time In order to characterize the gasflow in the MEXIICO loop, pre-liminary tests have been carried without fuel pellet in which helium is
injected instead offission gas for different pressures. Helium is carried by argon and detected at the outlet after having crossed the whole loop. OnFig. 6, the high pressure region with the helium injection system is represented in red, the low pressure region including the helium detection in blue.
3.1. Experimental results
These tests consist in carrying out a series of depressurization steps at high temperature and pressure (maximum 1600 °C, maximum 1600 bar). The outletflow is controlled by the regulated throttle valve. For each of these steps, a one-time injection of helium is made.
The initial conditions for these three tests are respectively 800 bar and 800 °C for thefirst one, 1600 bar and 1400 °C for the second one and 1600 bar and 1600 °C for the latter one. Temperatures are kept constant for all these three tests and the outlet flow is adjusted to around 5 l/min for thefirst two tests and variable for the latter one. In the end, 42 injections were carried out during these three tests, of which 35 proved exploitable, the 7 other were rejected due to in-sufficient output flowrate (< 1 l/min). For illustration, the cycle at 800 bar and 800 °C is given inFig. 7. Helium injections are indicated by arrows.
3.2. Uncertainty on the residence time
In order to better characterize the residence time, it is essential to evaluate its sensitivity to the experimental conditions, in particular to the argonflowrate. This is done in the sensitivity studies at the end of this paper by considering the consequences on the residence time of the maximumflowrate. Furthermore, the time spent by argon in the dif-ferent components of the loop will be also evaluated.
3.2.1. Instantaneousflowrate of argon
The volumeflowrate measured at the output is not strictly constant in spite of the regulation imposed by the throttle valve. For example, the instantaneous actualflowrate obtained for an injection of the ex-pansion cycle at 1600 bar and 1600 °C is reproduced inFig. 8, for an average objectiveflowrate of 4,2 l/min. The sensitivity to these flow-rate variations will be addressed later by studying the effect on the assessment of the residence time by taking the maximum and minimum flowrate values.
The non-uniformflowrate is due to the technical limitations on the
Fig. 4. Principle of the throttle valve.
response time of the throttle valve to adjust the imposed outlet flow-rate.
3.2.2. Impact of components on the helium residence time
The pressure drop for the different components of the loop is ex-perimentally characterized (seeFig. 9).
From experimental measurement, the pressure losses are expressed by:
- Between point 1 and 2 (throttle valve):ΔP∼Pupward
- Between point 2 and 3 (filter):ΔP=0,0091·Q1,1606∼950·v
- Between point 3 and 4 (filter):ΔP=0,0022·Q1,0967∼200·v
- Between point 4 and 5 (flowmeter):ΔP=0,0168·Q0,9298∼1100·v
with:
P
Δ : Pressure loss (bar)
Q: Volumeflowrate (l/min)
v: Helium velocity (m/s)
With aflowrate of 1 l/min (8 l/min), the velocity would be 1,3 m/s (respectively 10,6 m/s) in a pipe with a diameter of 2 mm, which gives a pressure drop of about 0,02 bar (0,15 bar respectively) (Fig. 10).
For a component 10 cm long, the residence time of helium to cross it would be at most 0,1 s, which is negligible compared to the total re-sidence time spent in the loop. It is therefore justified not taking into account the different components in the evaluation of residence time.
Fig. 6. The helium injection loop.
4. Modelling aspects
The throttle valve is the component of the MEXIICO loop in which the gasflow is greatly modified. For that purpose, a detailed thermal-hydraulic analysis of the flow on both sides of the throttle valve is proposed.
4.1. The CFD approach
A numerical simulation based on a CFD approach with the STAR-CCM + software (www.cd-adapco.com) is selected, since it allows any fluid flow in a complex geometry to be described.
A CFD calculation is divided into three parts:
•
Geometrical modelling of the fluid physical domain (boundary conditions, physical properties of argon), domain mesh.•
Solving Navier-Stokes equations using the CFD solver.•
Post-processing and analysis of results of temperature, pressure and velocity.The description is based on a 2D axi-symmetric modelling. The RANS approach is solved by the Navier-Stokes equations. Turbulence is modelled by the usual k-ε model that consists in representing the effects of turbulence and eddy diffusivity by a turbulent viscosity. This eddy viscosity is calculated according to the turbulent energy k per mass unit, and energy dissipationε per mass unit. Each of these two terms is the solution of a transport equation. Wall laws“All y+wall treatment”
for approximating boundary layers. The numerical unsteady scheme with implicit solver is used.
4.1.1. Domain of study
In the CFD approach, thefluid domain is modeled each side of the throttle valve by a 2 dimensional axisymmetric representation
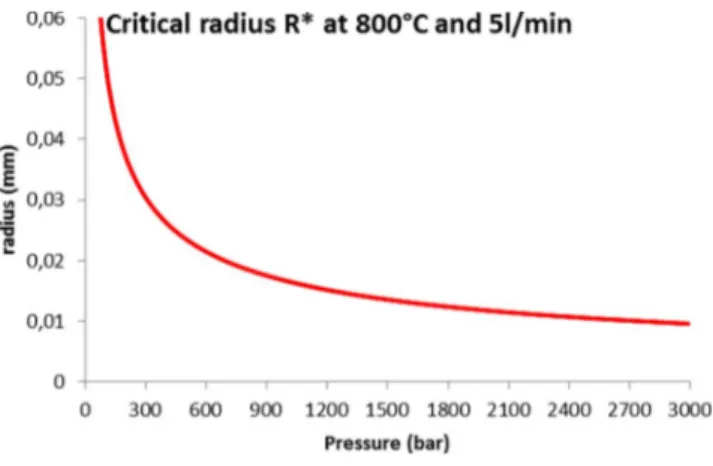
The size of the section restriction results from the imposed outlet flowrate. Depending on the upstream pressure, the radius of the throttle valve section to obtain a volumeflowrate of 5 l/min, givenFig. 11, is determined from the sonicflow at the nozzle (Eq.(11)).
Argon pressure and temperature are imposed in the high pressure region. As output, atmospheric pressure and atmospheric temperature are set up.
4.1.2. The throttle valve meshing
Thefluid domain is meshed with a total of 8800 cells upward of the valve and 39,000 cells downwards Fig. 12). In the vicinity of the throttle valve, the number of cells is of 1000.
The base size features the average size of the mesh. A value of 15 mm has been chosen for modelling. In order to capture at best the flow near the throttle valve, the mesh has been refined very strongly in this area with a base size of 0,02 mm, as shown inFig. 13.
A mesh convergence was conducted by using 4 different meshes with base size of the cells ranging from 10 to 20 mm with a volumetric control at the throttle valve comprised between 0,01 and 0,03 mm. No significant change was observed on the pressure evolution. The
Fig. 8. Evolution of the instantaneousflowrate versus time at the outlet of the circuit.
Fig. 9. The MEXIICO loop.
Fig. 10. zoom on the domain of study at the cross of the throttle valve.
uniformity of theflow except near the throttle valve was also evidenced independently of the mesh size (Fig. 14).
4.2. The CFD study of one of the MEXIICO injections
The CFD study is proposed previously to the analytical approach in order to validate the hypothesis made on the characteristics of theflow. 4.2.1. Characteristics of the test
The argonflow simulation at the crossing of the throttle valve has been conducted for the injection characterized by an upward pressure of 85 bar and a temperature of 800 °C (Table 1).
4.2.2. The CFD results at the cross of the throttle valve
The initial pressure of 85 bar sharply decreases to the atmospheric pressure at the crossing of the throttle valve (seeFig. 15).
The temperature distribution obtained by crossing the throttle valve is reproduced hereafter. The depressurization causes a local lowering of temperature to−173 °C, close to the liquefaction temperature of argon (−186 °C) and even of its solidification temperature (−189 °C) at at-mospheric pressure (http://encyclopedia.airliquide.com)Fig. 16).
Similarly, the argon velocity significantly evolves downward of the throttle valve (seeFig. 17).
The disturbed area by the throttle valve is confined to a small re-gion, as shown by theflow streamlines inFig. 18. The residence time of the valve is of the order of 0,6 s.
The analysis of the velocity profile upward of the throttle valve shows two distinctflow regions (seeFig. 19):
•
a uniform velocity zone (0,006 m/s) in the high pressure region, except in the vicinity of the valve,•
an area of high acceleration of argonflow 10 cm before the valve. Similarly, the downward zone shows two different flow regimes (Fig. 20):•
a supersonic zone in the region extended to 2 cm around the valve,•
an area in which the velocity of argon is uniform, of the order of6 m/s.
The evaluation of the outletflowrate makes it possible firstly to ensure the convergence of computing calculations and secondly to en-sure thatflowrate imposed to 5 l/min by dimensioning the section of the throttle valve is guaranteedFig. 21). The oscillations on thisfigure
Fig. 12. Meshing of thefluid domain.
Fig. 13. Zoom on the throttle valve region.
Fig. 14. Pressure drop at the transit of the throttle valve.
Table 1
Characteristics of the analysed injection.
Pressure (bar) Temperature (°C) Averageflowrate (l/min) Residence time (s) 85 800 5,05 34
correspond to the number of iterations necessary before convergence. Using the 2D axi-symmetric modelling, the azimuthal representa-tion of the calculated domain is arbitraryfixed to 1 rad, so that the real flowrate must be divided by 2π. The final value of 2 · 10−5
kg/s ob-tained after 500 iterations on this 2D modelling corresponds therefore to the imposed volumeflowrate of 5 l/min.
The objective of the CFD approach was mainly to show that two stabilizedflows exist each size of the throttle valve, except in its vici-nity. On this manner, the analytic method, presented just below, is justified.
4.3. The analytical approach 4.3.1. Introduction
The CFD approach showed that the argonflow is unaffected away from the valve region. Specifically, the perturbed area is limited to 10 cm on both sides of the valve. In addition, there is in this zone, a sudden drop in temperature that could reach the actual liquefaction temperature of argon.
Theflow study can thus be dissociated into two parts, on either side of the throttle valve characterized by a uniform pressure and
temperature. An analytical approach study is therefore proposed in this section to evaluate the residence time.
Argon pressure and temperature conditions each side of the throttle valve arefirstly considered. This approach is then applied to the three experimental tests. A sensitivity study on the outputflowrate and the choice of equation of state for argon concludes this part.
4.3.2. Evolution of argon temperature, pressure and velocity
Apart from pressure, argon temperature evolves in the MEXIICO loop, due to the exchange with the environment. On a length dz, energy conservation leads to:
+ − = − −
D c· ·( (p T z dz) T z( )) h·2· · ·π r dz T z·( ( ) Text) (12) with:
D: Massflowrate (kg/s)
cp: Heat capacity of argon (J/kg-K)
T z( ): Temperature on the z axis (K)
h: Heat transfer coefficient (W/m2-K)
r: Pipe radius (m)
Text: Room temperature (K)
Fig. 15. Zoom on the pressure near the throttle valve.
The argon temperature is finally solution of the following differ-ential equation: + = D c dT z dz h π r T z h π r T · ·p ( ) ·2· · · ( ) ·2· · · ext (13) Either: = + − − = T z T T T e L D c h π r ( ) ( )· with · ·2· ·
ext init ext z
L p
(14)
Assuming a heat transfer coefficient (10 W/m2-K) (Taine and
Dunod, 2011), for the respectiveflowrates of 1.3 l/min, 5 l/min and 7.5 l/min, the initial temperature of the argon of 800 °C rapidly de-creases (Fig. 22) to the room temperature after less than 2 m of circu-lation. This result would deserve to be confirmed by an experimental approach. Indeed, the value used here for the heat transfer coefficient is a standard value, which just gives an order of magnitude of heat ex-change.Evolution of argon temperature and pressure is finally
Fig. 17. Zoom on the velocity for the transit of the throttle valve.
Fig. 18. Streamline at the throttle valve.
summarized on the belowFig. 23.
Based on the knowledge of pressure and temperature, the analytical approach can now be implemented for determination of residence time in three identified zones (seeFig. 24):
•
the high pressure and high temperature zone (P1,T1),•
the high pressure and room temperature zone (P1,Text),•
the atmospheric pressure and room temperature zone (Pext,Text).In addition, the assumptions made for the evaluation of the re-sidence time are as follows:
•
The various elements (flow meters, filters and detector) do not affect the total residence time of argon.•
The residence time for crossing the throttle valve is also negligible.•
The heated gas initially drops to room temperature after 1.5 m in theloop.
The conservation of massflow is:
= = =
D ρ v S1· ·1 1 ρ v S2· ·2 2 ρext·vext·Sext (12)
Hence: = v D ρ S· 1 1 1 (13) = v D ρ S· 2 2 2 (14) = v D ρ ·S ext ext ext (15)
It simply remains to evaluate the argon density in these three areas. As the argon density is written:
= = ρ m V n M V · (16) Using the Van der Waals equation of state for argon (seeAppendix A) (www.bcs.whfreeman.com/pchem9e), the volume occupied for a given pressure and temperature provides its density as follows:
=
ρ n M f P T
·
( , ) (17)
Once the argon density is known for the three regions, argon velo-city is deduced from theflowrate imposed on the output. Knowing the length of the three zones (respectively 1,5 m, 3,885 m and 31,455 m), the residence time of the helium isfinally obtained.
5. Comparison between simulations and experimental tests This method for velocity determination, applied to the three tests, conducted to the results presentedFigs. 25–27. The agreement with the experimental results obtained is acceptable, with a maximum difference lower than 20% for test 1 (except 25% for thefirst injection) and test 2 and 8% for test 3.
5.1. The residence time in the MEXIICO loop
Once the argonflow has been characterized by the analytical ap-proach, additional results are derived on the respective residence time in the high and low pressure regions.
For the three tests discussed, the results are summarized inFig. 28. As expected, most of the residence time is spent in the high pressure region (about 90% of total time).
The analysis of argon cooling led to choose 1,5 m as the length required for cooling the gas. However, this choice has little impact on the total residence time of helium. Indeed, as shown inFig. 29, ap-proximately 90% of time is spent with argon already cooled. Accord-ingly, in the event that the argon would already be cooled at the time of injecting helium, the error in the residence time is less than 10% of the total residence time in the high pressure part. To remove any ambiguity about the argon temperature, one might perform an instrumented test in an equivalent loop to the MEXIICO one that would provide the evolution of argon temperature versus time. These tests would be car-ried out outside the MEXIICO device, which would improve the accu-racy of slow depressurization modelling.
5.2. Sensitivity studies
5.2.1. The equation of state of argon
In order to check the impact of the equation of state on results, the equation of state of ideal gas has been substituted to the Van der Waals gas law. As shown inFig. 30, this substitution degrades the results by a factor more than two for the slower depressurization tests.The
Fig. 21. Massflowrate downstream of the valve.
Fig. 23. Evolution of the argon temperature and pressure versus the z axis.
Fig. 24. Decomposition of the argonflow field into three flow regions.
Fig. 25. Analytical results for test 1.
difference on the residence time using the ideal or VDW equation of state is mainly present for thefirst injections at higher pressure and temperature. This is explained by the difference in argon density at high pressure and room temperatureFig. 31).
5.2.2. The uncertainty on theflowrate
Due to the low flowrate required and the experimental control system of the throttle valve, the volumeflowrate at the outlet cannot be exactly maintained at afixed value. As shown onFig. 32, the impact of experimental uncertainty on the residence time is however rather lim-ited.Indeed, the difference with measurement between the calculated residence time using the averageflowrate or the maximum flowrate reaches 18% instead of 8% for the second injection but is otherwise lower than 10%.
5.2.3. Margin to argon liquefaction near the nozzle valve
Blockage of theflow at the throttle valve was noticed for some tests. In light of the CFD approach, this experimental observation shows that argon could be locally liquefied at −186 °C and even solidified at −189 °C.
In order to avoid any risk of liquefaction of argon at the throttle valve after depressurization, a maximum pressure versus temperature must be imposed in the MEXIICO furnace. If one considers the de-pressurization as adiabatic, the maximum upstream pressure to respect is given versus temperature inTable 2.
Thanks to this evaluation, the experiment conditions to comply for the non-liquefaction of argon could be proposed for the future tests.
Fig. 27. Analytical results for test 3.
Fig. 29. Time spent the high pressure region.
Fig. 30. Impact of the equation of state on the residence time.
6. Conclusion
The thermal-hydraulic modelling of the MEXIICO loop in slow
depressurization condition contributes to date the main events occurred in the fuel sample during an experiment and thus to better understand behaviour of one the fuel pellet submitted to high pressure and tem-perature in the furnace in order to simulate hydrostatic stress condi-tions.
The proposed approach aiming at estimating the residence time between thefission gas emission and its detection in the rear cell by gamma detector is based on a two-step approach:
•
characterize theflow on either side of the throttle valve.•
highlight the uniformity of velocity, apart from at the crossing of the throttle valve for which a refined CFD study was implemented. Taking into account the results provided by the CFD approach, it is finally concluded that the analytical model is sufficient to assess the residence time with an acceptable precision. The contributions of the study are that:•
argon temperature drops very quickly in the loop (in less than 1,5 m in the high pressure circuit),•
the residence time is mainly spent in the high-pressure region (∼90% of total time),•
liquefaction and even solidification of argon while crossing the throttle valve could occur and can be avoided by respecting criteria on upstream pressure and temperature.The test campaigns with various fuel pellets of different burn-up and different experimental conditions will be pursued in the future.
Appendix-characteristics
The main characteristics of argon are recalled below [18]
Critical point Critical temperature −122,46 °C = 150,69 K
Critical pressure 48,63 bar
Critical density 535,6 kg/m3
Triple Point Temperature at the triple point −189,34 °C = 83,66 K
Triple point pressure 0,687 bar
Liquefaction temperature at 1 bar −185,85 °C = 87,30 K
Solidification temperature at 1 bar −189,4 °C = 83,75 K
Argon behaviour is similar to that of a Van der Waals gas:
+ − = P a n V V n b n R T ( · )·( · ) · · 2 2
for which the a and b constants are: a = 0,135 J.m3.mol−2
b = 0,0000322 m3.mol−1
From the a and b values, temperature and critical pressure are calculated:
= = T a b R K 8· 27· · 150,69 c = = P a b bar 27· 48,98 c 2
The plot of the isotherms (seeFig. 33) shows that for high temperatures, argon behaves as an ideal gas. By cons, at low temperature (liquid-vapor saturation curve) it can no longer be considered as an ideal gas.
Fig. 32. Residence time: sensitivity to uncertainty in theflowrate. Table 2
Maximum pressure to respect in order to avoid argon liquefaction. T (°C) P (bar) 27 22 800 530 1400 1608 1600 2132
Characterisation of the behaviour of fuel pellet during the pressure and temperature ramps Study offission gas release by the fuel pellet
Analytical and CFD study offission gas entrained by the Argon flow
References
Hanus, E., Malgouyres, P.P., Clément, S., Alloncle, R., Pontillon, M., Bernard, S., Gleizes, B., Masson, R., Pontillon, Y., Noirot, J., 2016. MEXIICO: a new equipment to study the pressure impact on the irradiated fuel behavior. Top fuel Boise Idaho, USA.
Kashibe, S., Une, K., 2000. Fission gas release from externally restrained uranium dioxide fuel. JNST 37 (6), 530–535.
Pontillon, Y., Malgouyres, P.P., Ducros, G., Nicaise, G., Dubourg, R., Kissane, M., Baichi, M., 2005. Lessons learnt from VERCORS tests Study of the active role played by UO2–ZrO2–FP interactions on irradiated fuel collapse temperature. J. Nucl. Mater. 344, 265–273.
Askeljung, P., Flygare, J., Minghetti, D., 2012. NRC LOCA Testing Program at Studsvik, Recent Results on High Burnup Fuel. Proc. 2012 Top Fuel Conf., Manchester, United
Kingdom.
K. Une, S. Kashibe, K. Hayashi Actinides, Fission gas release in high burn-up UO2 fuels with developed rim in structure, 2001, Hayama, Japan, Nov 4-9 2001.
Experiments to Study the Gaseous - Discharge and Filling of Vessels - Int. J.Engng. Vol. 13, No. 2, p. 123-134, 1997. J. Craig Dutton and R.E. Coverdill - Department of Mechanical and Industrial Engineering, University of Illinois at Urbana-Champaign, Urbana, IL 61801, USA.
S. Candel, Dunod, Cours de Mécanique desfluides, 2001. STAR-CCM+ User Guide,http://www.cd-adapco.com. Gas Encyclopédia Air Liquidehttp://encyclopedia.airliquide.com. J. Taine, Dunod, Afirst course in heat transfer, 2011.
ATKINS physical chemistry Ninth Edition W.H Reeman Book Companion sitehttp:// www.bcs.whfreeman.com/pchem9e.


![[PDF] Utilisation de PowerPoint ressource de formation complet | Cours informatique](data:image/gif;base64,R0lGODlhAQABAIAAAP///wAAACH5BAEAAAAALAAAAAABAAEAAAICRAEAOw==)