HAL Id: inserm-02443532
https://www.hal.inserm.fr/inserm-02443532
Submitted on 17 Jan 2020
HAL is a multi-disciplinary open access
archive for the deposit and dissemination of
sci-entific research documents, whether they are
pub-lished or not. The documents may come from
teaching and research institutions in France or
abroad, or from public or private research centers.
L’archive ouverte pluridisciplinaire HAL, est
destinée au dépôt et à la diffusion de documents
scientifiques de niveau recherche, publiés ou non,
émanant des établissements d’enseignement et de
recherche français ou étrangers, des laboratoires
publics ou privés.
cognitive dysfunctions in mouse
D. Ung, G Iacono, H Méziane, E. Blanchard, M-A Papon, M Selten, J-R van
Rhijn, R Montjean, J Rucci, Stéphane Martin, et al.
To cite this version:
D. Ung, G Iacono, H Méziane, E. Blanchard, M-A Papon, et al.. Ptchd1 deficiency induces excitatory
synaptic and cognitive dysfunctions in mouse. Molecular Psychiatry, Nature Publishing Group, 2018,
23 (5), pp.1356-1367. �10.1038/mp.2017.39�. �inserm-02443532�
ORIGINAL ARTICLE
Ptchd1 deficiency induces excitatory synaptic and cognitive
dysfunctions in mouse
DC Ung1,2,21, G Iacono3,21, H Méziane4,21, E Blanchard1,5,6, M-A Papon1,2, M Selten7, J-R van Rhijn7, R Montjean8,9,10,11, J Rucci8,9,10,11, S Martin12, A Fleet13, M-C Birling4, S Marouillat1,2, R Roepman14,15, M Selloum4, A Lux4, R-A Thépault1,2, P Hamel13, K Mittal16, JB Vincent16, O Dorseuil8,9,10,11, HG Stunnenberg3, P Billuart8,9,10,11, N Nadif Kasri7,14, Y Hérault4,17,18,19,20,22and F Laumonnier1,2,6,22
Synapse development and neuronal activity represent fundamental processes for the establishment of cognitive function. Structural organization as well as signalling pathways from receptor stimulation to gene expression regulation are mediated by synaptic activity and misregulated in neurodevelopmental disorders such as autism spectrum disorder (ASD) and intellectual disability (ID). Deleterious mutations in the PTCHD1 (Patched domain containing 1) gene have been described in male patients with X-linked ID and/or ASD. The structure of PTCHD1 protein is similar to the Patched (PTCH1) receptor; however, the cellular mechanisms and pathways associated with PTCHD1 in the developing brain are poorly determined. Here we show that PTCHD1 displays a C-terminal PDZ-binding motif that binds to the postsynaptic proteins PSD95 and SAP102. We also report that PTCHD1 is unable to rescue the canonical sonic hedgehog (SHH) pathway in cells depleted of PTCH1, suggesting that both proteins are involved in distinct cellular signalling pathways. Wefind that Ptchd1 deficiency in male mice (Ptchd1− /y) induces global changes in synaptic gene expression, affects the expression of the immediate-early expression genes Egr1 and Npas4 andfinally impairs excitatory synaptic structure and neuronal excitatory activity in the hippocampus, leading to cognitive dysfunction, motor disabilities and hyperactivity. Thus our results support that PTCHD1 deficiency induces a neurodevelopmental disorder causing excitatory synaptic dysfunction.
Molecular Psychiatry (2018)23, 1356–1367; doi:10.1038/mp.2017.39; published online 18 April 2017
INTRODUCTION
Intellectual disability (ID) and autism spectrum disorder (ASD) are frequently associated neurodevelopmental disorders, which affect at least 1% of the general population, and consequently represent a major public health issue. From the past decades and the recent development of next-generation sequencing, it has been well established that4500 genetic factors are associated with ID and/ or ASD.1–5Systems biology approaches have pointed toward the involvement of synapse structure and function, chromatin remodelling and regulation of protein synthesis in ASD and ID.4–8 However, identifying the underlying pathophysiological mechanisms remains a considerable challenge for many genes mutated in these neurodevelopmental disorders.
Loss-of-function mutations (deletions, truncating mutations) in the PTCHD1 (Patched domain containing 1) gene, located in the X chromosome (Xp22.11), are found in male individuals presenting with non-syndromic X-linked ID and/or ASD.9–12 A recent
phenotype–genotype correlation study on 23 patients with PTCHD1 mutations established that they displayed mild-to-moderate global developmental delay, variable degrees of ID and 440% of them also show ASD or ASD-like behaviours.10 Recent estimates suggested that hemizygous PTCHD1 loss of function might account for around 1% of patients with neurodevelopmental disorders.13
In mammals, PTCHD1 belongs to a gene family including PTCHD2 (also known as DISP3),14 testis-specific PTCHD315 and PTCHD4 (also known as PTCH53).16Little is known regarding the specific function of the respective encoded proteins; however, they display secondary structures similar to the Patched (PTCH1) receptor, including 12 predicted transmembrane domains and a sterol-sensing domain.9In vitro studies have therefore suggested a possible role of the PTCHD proteins in the regulation of sonic hedgehog (SHH) signalling pathway, as well as their likely localization at cell plasma membrane.9,16 SHH is a pleiotropic
1
University François-Rabelais, UMR Imaging and Brain, Tours, France;2
Institut National de la Santé et de la Recherche Médicale, U930, Tours, France;3
Department of Molecular Biology, Radboud Institute for Molecular Life Sciences, Radboud University, Nijmegen, The Netherlands;4
CELPHEDIA PHENOMIN, Institut Clinique de la Souris (ICS), CNRS, INSERM, University of Strasbourg, Illkirch-Graffenstaden, France;5
Institut National de la Santé et de la Recherche Médicale, U966, Tours, France;6
Centre Hospitalier Régional Universitaire, Tours, France;7
Department of Cognitive Neuroscience, Department of Human Genetics, Radboudumc, Donders Institute for Brain, Cognition and Behaviour, Nijmegen, The Netherlands;8
Institut Cochin, 24 rue du Fg St Jacques, Paris, France;9
Institut National de la Santé et de la Recherche Médicale, U1016 Paris, France;10
Centre National de la Recherche Scientifique, UMR8104, Paris, France;11
University Paris Descartes, Institut Cochin, Paris, France;12
Université Côte d’Azur, INSERM, CNRS, IPMC, France;13
Department of Laboratory Medicine and Pathobiology, Faculty of Medicine, University of Toronto, Toronto, ON, Canada;14Department of Human Genetics, Radboud University Medical Center, Nijmegen, The Netherlands;15
Radboud Institute for Molecular Life Sciences, Radboud University Medical Center, Nijmegen, The Netherlands;16
Molecular Neuropsychiatry & Development (MiND) Lab, Campbell Family Mental Health Research Institute, Centre for Addiction and Mental Health, Toronto, ON, Canada;17Institut de Génétique et de Biologie Moléculaire et Cellulaire Illkirch, Illkirch-Graffenstaden, France;18
University of Strasbourg, Illkirch, France;19Centre National de la Recherche Scientifique, UMR7104, Illkirch, France
and20
Institut National de la Santé et de la Recherche Médicale, U964, Illkirch, France. Correspondence: Dr Y Hérault, IGBMC-CNRS UMR7104–INSERM U964, 1 rue Laurent Friès, BP 10142, Illkirch Cedex 67404, France or Dr F Laumonnier, Faculty of Medicine, INSERM UMR930, 10 Bd Tonnellé, Tours Cedex 37032, France.
E-mail: [email protected] or [email protected]
21
Thefirst three authors are considered as first co-authors.
22
The last two authors are considered as last co-authors.
Received 6 October 2016; revised 18 January 2017; accepted 25 January 2017; published online 18 April 2017
factor acting in the developing brain, including on axonal growth and elongation.17It has also been retrieved in synaptic terminals and was shown to be involved in the regulation of dendritic spine formation via a non-canonical pathway that directly regulates the actin cytoskeleton.18,19Finally, astrocyte diversification in the adult brain has been recently shown to directly depend on a neuronal SHH signalling,20suggesting a major contribution of this pathway in developed and mature brains besides early neurodevelop-mental processes.
The physiological role of PTCHD1 in the brain is poorly described to date. Gene expression data from the Human developmental transcriptome Brainspan project (www.brainspan. org) indicate low expression levels of PTCHD1 in the developing brain with the highest expression in postnatal cerebellum, similarly to PTCH1 gene. Whole-genome transcriptional analyses in the postnatal developing primate brain have recently shown that PTCHD1 is highly expressed in neonatal cortex and striatum (regions enriched in excitatory neurons) and decreases during childhood.21 In mouse, a very recent study has indicated that Ptchd1 was enriched, during the first 2 weeks of life, in the thalamic reticular nucleus, which is a structure containing Parvalbumin-positive GABAergic neurons, and thereafter was expressed more widely (cortex, cerebellum, hippocampus).13 Its
deletion was also shown to affect thalamic reticular nucleus activity leading to attention deficit and hyperactivity.13
Here we report that PTCHD1 is synaptically localized and interacts with the postsynaptic membrane-associated proteins PSD95 and SAP102 through a functional PDZ-domain-binding motif, providing a direct link with the excitatory synaptic network. The analysis of our Ptchd1− /ymouse model reveals structural and functional alterations of excitatory synapses in the hippocampus, as well as deregulation of the expression levels of numerous synaptic genes and immediate-early expression genes. Besides the previously described thalamic dysfunction associated with Ptchd1 knockout, we discovered that Ptchd1 deletion impairs hippocampal activity. Our results thus support that PTCHD1 deficiency induces a neurodevelopmental disorder, with disease pathogenesis resulting from a deregulation of a neuronal pathway directly associated with postsynaptic signalling complexes, and from disruption of the excitatory synaptic organization in the developing brain.
MATERIALS AND METHODS
Molecular approach of Ptchd1 function
The expression profile of Ptchd1 was assessed using the TissueScan quantitative PCR-ready cDNA Arrays (Origene, Rockville, MD, USA; Supplementary Methods). The Ptchd1 full-length sequence from IMAGE cDNA clone 40095445 (Source BioSience, Nottingham, UK) was used for greenfluorescent protein (GFP) fusion, deletion constructs and pulldown strategy using the Pierce GST Protein Interaction Pull-down Kit (Fisher scientific, Illkirch, France) to detect, respectively, PTCHD1 subcellular localization and protein interactions (Supplementary Methods). Gli transactivation activity was followed by Luciferase assay as described in Supplementary Information.
Mouse line, ethical statement and in vivo functional studies
The Ptchd1− /y null allele was generated on the C57BL/6N genetic background (Supplementary Figure S1 and Methods).22The local ethics committee, Com’Eth (no. 17), approved all mouse experimental proce-dures, under the accreditation number 2012-139 and 2014-024. Functional studies were performed between 3 and 4 months of age with two cohorts of mutant mice and controls. Cohort 1 (11 Ptchd1− /yand 12 wild-type (WT) littermates) was used to study the behaviour of animals, and cohort 2 (8 Ptchd1− /yand 8 WT males and 8 Ptchd1−/−and 8 WT females) was used for more comprehensive analysis. Behaviour tests were run in the following order between the age of 13 and 17 weeks: circadian activity, elevated plus maze, novel object recognition, modified SmithKline Beecham, Harwell, Imperial College, Royal London Hospital, Phenotype Assessment, grip test, Rotarod test, Social recognition test, Y-maze spontaneous alternation,
auditory startle reflex reactivity and prepulse inhibition, Pavlovian fear conditioning, hot plate test and shock threshold test, which are described in Supplementary Information. Cohort 2 went through the IMPC pipeline for broad-based analysis (http://www.mousephenotype.org/impress).23
Molecular characterization was carried by hippocampal expression analysis by RNA sequencing in mutant and control littermates (P30) and analysed as detailed in Supplementary Information.
Primary neuronal cultures
All mouse experiments were performed according to protocols approved by the University Francois-Rabelais of Tours and INSERM. Brain tissues were dissected from embryonic day 17.5 C57BL/6N WT or Ptchd1− /y mouse embryos. The primary neuronal cultures were prepared as previously described.24Protocols for the morphological analysis of WT and Ptchd1 mutant neuronal cultures was performed as previously described.25
Brain ultra-structural analyses
Mice (a total of 3 WT and 3 Ptchd1− /ymales, age 13–15 weeks) were anaesthetized and were perfused transcardially with saline followed by fixative solution containing 4% paraformaldehyde and 2.5% glutaralde-hyde in 0.1Mphosphate buffer (phosphate-buffered saline, pH 7.4). Brains were dissected to obtain hippocampus, cortex and cerebellum and then postfixed with a fixative solution containing 4% paraformaldehyde and 1% glutaraldehyde in 0.1M phosphate buffer (pH 7.2) for 48 h. Tissues
were washed in phosphate-buffered saline, postfixed by incubation for 1 h with 2% osmium tetroxide and dehydrated in a graded series of ethanol solutions. Samples were embedded in Epon resin, which was allowed to polymerize for 48 h at 60 °C. Ultrathin sections were cut, stained with 2.5% uranyl acetate and 1% lead citrate and deposited on electron microscope grids for examination under a JEOL 1011 (Tokyo, Japan) transmission electron microscope. Excitatory asymmetric synapses were selected according to their typical structural organization, including the presynaptic terminal characterized by the presence of numerous synaptic vesicles, the synaptic cleft and a fuzzy electron-dense thickening of the postsynaptic membrane defining the postsynaptic density (PSD). Statistical analysis was performed using the GraphPad Prism 6.0 software (La Jolla, CA, USA).
Electrophysiological recordings of mEPSCs
Mice (3 WT and 3 Ptchd1− /ymales, age P22–P23) were anaesthetized with isoflurane before decapitation. Coronal slices (350 μm) were cut using a HM650V vibration microtome (Fisher Scientific) in ice-cold artificial cerebrospinal fluid (ACSF) containing (in mM): 87 NaCl; 11 Glucose; 75 Sucrose; 2.5 KCl; 1.25 NaH2PO4; 0.5 CaCl2; 7 MgCl2; 26 NaHCO3,
continuously oxygenated with 95% O2/5% CO2and incubated for 1 h at
32 °C. Slices were transferred to the recording setup 15 min prior to recording and incubated at 32 °C while being continuously oxygenated with 95% O2/5% CO2 in recording ACSF containing (unless otherwise
stated in mM): 124 NaCl, 1.25 NaH2PO4, 3 KCl, 26 NaHCO3, 10 Glucose, 2
CaCl2, and 1 MgCl2. Patch pipettes (3–5 MΩ) were made from borosilicate
glass capillaries andfilled with intracellular solution containing (in mM): 115
CsMeSO3; 20 CsCl; 10 HEPES; 2.5 MgCl2; 4 Na2ATP; 0.4 NaGTP; 10
Na-Phosphocreatine; and 0.6 EGTA. Traces were recorded using a Multiclamp 700B amplifier (Molecular Devices, Sunnyvale, CA, USA), sampled at 10 kHz and filtered at 2 kHz. Cells were excluded from analysis if the series resistance exceeded 25 MΩ. Miniature excitatory postsynaptic currents (mEPSCs) were recorded at − 70 mV in the prescence of Tetrodotoxin (1μM) and Picrotoxin (100μM). Paired pulse ratios (PPR) were recorded in the presence of Picrotoxin (100μM) in ACSF containing 4 mMCaCl2and
4 mMMgCl2, at a holding potential of− 70 mV, following stimulation of the
Schaffer collaterals and calculated as peak2/peak1 after correcting for any residual current at the second pulse. Miniature recordings were analysed using the Mini Analysis Program (Synaptosoft, Fort Lee, NJ, USA). PPRs were analysed using Clampfit 10.2 (Molecular Devices, Sunnyvale, CA, USA). All drugs were purchased from Tocris (Minneapolis, MN, USA).
RESULTS
Ptchd1 gene expression converges with brain development and synaptogenesis stages
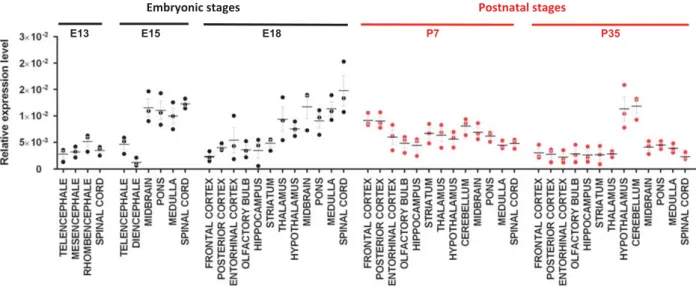
Using real-time PCR, we found variable Ptchd1 expression in brain areas, increasing from embryonic E13 stage to reach the highest
levels at E18–P7 in most brain regions and decreasing in adult stages except in cerebellar and hypothalamic regions similarly to what is reported in primates21(Figure 1). Surprisingly, we did not detect any specific thalamic expression of Ptchd1 in our P7 samples, which might be explained by the use of two different technical approaches for gene expression quantification (quanti-tative reverse transcriptase–PCR versus RNA in situ hybridization13) as well as sample preparation (regional total mRNA extracts versus brain slices13). Our results underscore a dynamic expression profile of Ptchd1 in the developing mouse brain, converging with dendritogenesis and early synaptogenesis stages.
PTCHD1 is localized in dendritic spines and can interact with postsynaptic scaffolds PSD95 and SAP102
Previous subcellular localization analyses reported that PTCHD1-GFP (with PTCHD1-GFP placed at the C-terminus of PTCHD1) expression in cell lines is mostly detected at the plasma membrane.9Yet such analyses in neuronal cells are poorly described. We therefore transiently expressed PTCHD1 constructs in primary hippocampal neuronal cultures (11–14 days in vitro) with the GFP being placed either at the N-terminus (GFP-PTCHD1) or at the C terminus (PTCHD1-GFP). We showed that PTCHD1-GFP fluorescence was distributed throughout dendrites as a membrane-associated
Figure 1. Ptchd1 gene expression profile in the mouse developing brain. Ptchd1 mRNA expression level was assessed by quantitative reverse transcriptase–PCR on cDNA arrays (Origene) from 48 mouse cDNA extracted from telencephalon, frontal cortex, posterior cortex, entorhinal cortex, olfactory bulb, hippocampus, striatum, mesencephalon, midbrain, rhombencephalon, pons, medulla, cerebellum, diencephalon, thalamus, hypothalamus and spinal cord. Five developmental stages were investigated: E13, E15, E18, postnatal day 7 (P7), and adult week 5 (P35). Expression of Ptchd1 mRNA is shown relative to the Gapdh reference gene. Data are presented as mean± s.e.m., with median. Black or red dot plots represent embryonic or postnatal stages, respectively. n= 3 independent experiments.
Figure 2. PTCHD1 (Patched domain containing 1) is a synaptic receptor interacting with PSD95 and SAP102 but does not modulate the canonical sonic hedgehog signalling pathway. (a) Subcellular neuronal localization of PTCHD1-GFP (greenfluorescent protein) in primary cultured hippocampal neurons. Representative images from confocal microscopy showing mature primary neurons expressing PTCHD1-GFP protein displaying punctate fluorescence throughout dendrites and dendritic spines. Hippocampal neurons were transfected at 12 days in vitrowith PTCHD1-GFP (wild type (WT)), PTCHD1-GFP lacking the last 39 amino acids (PTCHD1delCter-GFP) or the last 15 amino acids (PTCHD1del874_888-GFP) and visualized 48 h later. Co-transfection with pDsRed was performed with PTCHD1delCter-GFP to visualize the entire cell. PTCHD1-GFP, n= 15 neurons from 4 transfections; PTCHD1delCter-GFP, n = 11 neurons from 3 transfections; PTCHD1del874_888-GFP, n= 6 neurons from 2 transfections. Scale bars: 50 μm and 10 μm for PTCHD1-GFP and PTCHD1del874_888-GFP, 20 μm for PTCHD1delCter-GFP. (b) PTCHD1-GFP co-localizes with PSD95 in dendritic spines. Co-localization assay was performed using three primary neuronal cultures transfected with PTCHD1wtGFP (green) at 11 days in vitro (DIV11) andfixed at DIV14 and then immunostained with a mouse monoclonal PSD-95 antibody and a secondary Donkey anti-Mouse antibody (Alexa Fluor 594, red). Co-localization signal in spines (yellow) is indicated by white arrowheads. Data were collected from 10 transfected neurons with 31 dendrite sections in total (n= 3 independent transfections). Scale bar: 10μm. (c) Identification of a PDZ-binding motif in the C-terminal tail of PTCHD1 allowing interaction with PSD95 and SAP102 proteins. Predicted structure of PTCHD1 and sequence alignment of the 10 C-terminal amino acids of human proteins PTCHD1, PTCHD2, PTCHD3, PTCHD4, PTCH1 and PTCH2. The PDZ-binding motif is shown in red. PTCHD1 and PTCHD4 C-terminal sequences are identical between human and mouse. GST-pulldown assays using the C-teminal tail (39 amino acids) with or without the predicted PDZ-binding site as bait, and the synaptoneurosomal lysates from adult WT mouse cortex lysates as the prey, evidenced for the presence of a specific interaction between the predicted PDZ-binding motif and PSD95 and SAP102. The presence of a faint band in eluates from GST and from GST-Cter-delITTV using SAP102 antibody was considered as the non-specific background. A total of three independent experiments were performed. (d) PTCHD1 does not repress Gli reporter activity in Ptch1−/− mouse embryonicfibroblasts (MEFs). Luciferase activity was assessed in Ptch1−/− MEFs co-transfected with PTCHD1-GFP or PTCH1, and an 8 × Gli Luciferase Reporter Plasmid. A constitutively active renilla luciferase plasmid was also co-transfected to normalize for transfection efficiency. Luciferase values were measured using the Dual Luciferase Reporter Assay System (Promega) and normalized to an empty GFP control vector. Data were evaluated using a one-way analysis of variance test followed by a pairwise comparison of means using a Student’s t-test (with Bonferroni correction for multiple comparisons). Data are displayed as a box and whisker plot with a central line for the median, a box comprised of thefirst–third quartiles and whiskers showing the minimum and maximum values. n= 3 independent experiments, with the displayed value for each being the average of duplicate plates of cells. *Po0.05.
labelling with a clear synaptic localization that was confirmed by PSD95 co-labelling experiments (Figures 2a and b). By contrast, we found that the GFP-PTCHD1 fluorescence was distributed uni-formly, including in the nucleus (data not shown), suggesting that
GFP positioning would interfere with the membrane localization of PTCHD1. We also tested a PTCHD1 construct with the GFP inserted within the second extracellular loop but we were unable to obtain any fluorescence labelling, either in neurons or in
HEK293 cell lines, possibly caused by conformational constraints of the extracellular loop onto GFP structure (data not shown).
We then identified a potential PDZ-domain-binding motif (‘ITTV’) localized at the C-terminal end of PTCHD1 (Figure 2c). PDZ domain interactions normally require a free C-terminal end and function in the dynamic trafficking of synaptic proteins.26,27
Consequently, fusing the GFP to the C-term of PTCHD1 would hide the PDZ interaction motif. The aberrant subcellular fluorescent signals of the other constructs, despite displaying a free PDZ motif, prompted us to use PTCHD1-GFP as the only experimental approach to further investigate its subcellular localization.
Interestingly, we observed that PTCHD1-GFP lacking its C-terminal intracellular tail (PTCHD1delCter-GFP) failed to target to synapses, indicating that the corresponding last 39 amino acids would be required for dendritic and synaptic targeting (Figure 2a). Furthermore, the deletion of the C-terminal 15 amino acids did not affect dendrite and synapse trafficking of PTCHD1-GFP (Figure 2a), which suggests that an essential targeting element resides within a 24 amino-acid cytoplasmic segment (amino-acid residues 850–873) that is enriched in charged amino acids (6 Lysine and 6 glutamic acid).
The predicted PDZ interaction site identified in PTCHD1 is also present in synaptic EXOC4 protein where it binds the postsynaptic scaffolds PSD95 and SAP102 proteins,28 which are essential for excitatory synapse formation and function.26,27To assess whether PTCHD1 C-terminus bears similar interaction properties, we carried out GST-pulldown interaction studies using the C-terminal tail of PTCHD1 as bait. As shown in Figure 2c, PSD95 and SAP102 proteins specifically interact with PTCHD1, and these interactions require the C-terminal PDZ-binding motif as its deletion abolished their bindings. Notably, this motif is absent in all other Patched domain-related proteins (including PTCH1) except for PTCHD4 (Figure 2c), reflecting a possible evolutionary divergence in function.
Whereas PDZ domain interactions normally require a free C-terminal end, ourfindings using the PTCHD1-GFP fusion protein indicate that its synaptic targeting is not driven by the PDZ-binding motif. These results thus suggest that postsynaptic targeting of PTCHD1 is not specifically mediated by the scaffolding action of PSD95 or SAP102. Similar findings were previously described for the excitatory postsynaptic NLGN1-GFP and NR1-GFP proteins, also known to interact with PSD95.29,30
Altogether these data indicate that PTCHD1 is partly localized at synapses. The C-terminal intracellular tail is essential for the dendritic sorting of PTCHD1, whereas its binding to the key molecules of synapse assembly PSD95 and SAP102 would not be strictly required for its synaptic targeting.
PTCHD1 does not activate canonical SHH pathway in Ptch1−/− mouse embryonicfibroblasts
A major question remains regarding the direct contribution of PTCHD1 to the SHH signalling pathway. We performed Gli-luciferase reporter assays that are standardly used to measure canonical SHH signalling in mouse embryonicfibroblasts isolated from Ptch1− / −embryos. Intrinsic levels of SHH signalling in these cells are extremely high, due to the absence of PTCH1, which normally acts to keep the pathway in a repressed state.31 As Figure 2d shows, reconstitution of PTCH1-deficient mouse embryonic fibroblasts with PTCH1 greatly represses canonical pathway activity as measured by Luciferase transcription from the Gli1 promoter. In stark contrast, expression of PTCHD1 in these same cells failed to repress the Gli1-Luciferase reporter construct, indicating that PTCHD1 does not compensate for the absence of PTCH1 and has no ability to repress canonical SHH signalling. These findings therefore suggest that, despite its similarity with the PTCH1 receptor, PTCHD1 is unable to regulate the SHH-signalling pathway indicating that it would not be a SHH receptor.
Disruption of Ptchd1 in mouse impairs cognitive function and motor abilities and induces hyperactivity
To provide further insights into the neurodevelopmental role of PTCHD1, we generated a mouse model invalidated for the Ptchd1 gene caused by the excision of the second exon (Supplementary Methods; Supplementary Figure S1a). We confirmed that the full-length Ptchd1 transcript was absent in Ptchd1− /y mice using quantitative reverse transcriptase–PCR and total RNA sequencing, and we observed a remaining and weak expression of an alternative transcript skipping exon 2 (Supplementary Figure S1b). Ptchd1− /ymales and Ptchd1− / −females were characterized on several aspects of central nervous system functions. Mutant males displayed a significant increase in food consumption (Po0.05; Supplementary Figure S2a), with a slight tendency of increased body weight (P = 0.10), and decreased grip strength (P = 0.01) compared with WT littermates (Supplementary Table S1). Increased body weight and altered motor abilities were supported in additional cohorts of Ptchd1− /ymales (P40.05) (Supplementary Table S2). Decreased muscle strength in Ptchd1− /ymales is in line with previously reported data,13replicating hypotonia observed in patients.10In addition, Ptchd1− /ymales displayed altered rotarod performance supporting impaired motor coordination observed in patients.10 Ptchd1− /y males showed a significant increase in
locomotor activity (Figure 3a) and rears (not shown) throughout the whole testing period in the circadian activity test (Po0.05). Ptchd1− /y males also exhibited a significant increase in local
Figure 3. Ptchd1− /ymales are hyperactive, show reduced anxiety and exhibit altered cognitive abilities in different learning paradigms. (a)
Locomotor activity in the circadian activity over 35 h of testing presented per hour period and as a total during each phase of the cycle (n= 12 wild-type (WT) and 11 Ptchd1− /y mice; results are expressed as mean± s.e.m. for evolution graph or as a scattergram with the median; *Po0.05, **Po0.01, ***Po0.001 from WT, unpaired Student’s t-test); (b) locomotor activity and rears in the open field (n = 12 WT and 11 Ptchd1− /ymice; results are expressed as a scattergrams with the median; *Po0.05, **Po0.01, from WT, unpaired Student’s t-test); (c) the number of visits in the social recognition test (n= 12 WT and 11 Ptchd1− /ymice; results are expressed as a scattergram with the median; ***Po0.001 from WT, unpaired Student’s t-test); (d, e) anxiety-related behaviour as measured by the percentage of time in the centre of the openfield arena (d), and by the percentage of entries and time in the open arms in the elevated plus maze (e) (n = 12 WT and 11 Ptchd1− /y mice; results are expressed as scattergrams with the median; *Po0.05, from WT, unpaired Student’s t-test); (f) working memory performance (n= 12 WT and 11 Ptchd1− /ymice; results are expressed as a scattergram with the median; *Po0.05 from WT, unpaired Student’s t-test); (g) duration of object exploration during acquisition (n= 12 WT and 11 Ptchd1− /ymice; results are expressed as a scattergram with the median; unpaired Student’s t-test), and object recognition performance during retention (n = 12 WT and 11 Ptchd1− /ymice; results are expressed as a scattergram with the median; §Po0.05 significantly different from Hasard (50%), one group t-test); (h) duration of immobility during habituation to the conditioning cage and during context in the fear conditioning and contextual and cued freezing performance (n= 8 WT and 8 Ptchd1− /ymice; results are expressed as mean± s.e.m.; repeated analysis of variance (ANOVA) followed by unpaired Student’s t-test for each time point; ANOVA for baseline habituation: gene F(1,14)= 8.01, P = 0.013, time F(1,14) = 2.61, P = 0.129, interaction F(1,14) = 0.852, P= 0.372; ANOVA for contextual fear: gene F(1,14) = 10.01, P = 0.0069, time F(1,14) = 0.897, P = 0.419, interaction F(1,14) = 0.467, P = 0.632; ANOVA for cued fear: gene F(1,14)= 3.67, P = 0.076, time F(1,14) = 7.994, P = 0.0134, interaction F(1,14) = 0.149, P = 0.705).
activity in the rear part of the cages during the dark phase of the circadian cycle (Po0.05) (Supplementary Figure S2c), which might be interpreted as stereotypic behaviour. Increased activity in Ptchd1− /ymales was also observed in other situations, as revealed
by an increase in travelled distance and higher number of rears in the open field (Po0.05; Figure 3b) and higher number of congener or object box entries in the social recognition test (Po0.001; Figure 3c). Increased activity in Ptchd1− /ymales in the
open field was replicated using a new sets of mice and was also found in Ptchd1−/− females (Po0.001; Supplementary Figure S2b).
Our findings confirm those previously reported13 and,
impor-tantly, extend the robustness of hyperactivity phenotype in other situations, including circadian measurement of activity, or in social
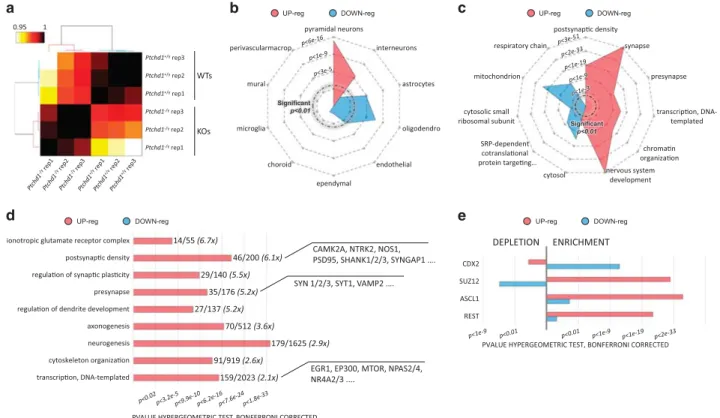
Figure 4. Analysis of the hippocampal transcriptome of Ptchd1− /yreveals global increased expression of synaptic genes. (a) Clear segregation
of wild-type (WT) and Ptchd1− /y transcriptomes. Clustering of Pearson correlations (Ward’s linkage), an unbiased method to quantify the degree of similarity between data set, shows clear segregation between genotype and high concordance of biological replicas. (b) Upregulated genes impact the neuronal populations in the hippocampus. Radar plot representing the enrichments (hypergeometric test, Bonferroni corrected) of cell-type-specific markers35
(see Supplementary Methods) in the lists of upregulated and downregulated genes. Outer rings correspond to higher enrichments (P-values represented in Z-score scale). Red and blue shape occupy largely separated areas, that is, cell types. (c) Ptchd1 inactivation is associated with the upregulation of synaptic genes. Radar plot summarizing the major gene ontology (GO) enrichments for upregulated and downregulated genes. Outer rings correspond to stronger enrichments. Bonferroni-corrected P-values are represented in Z-score scale. Upregulated genes are strongly enriched in synaptic proteins while downregulated genes seem to be implicated, among other pathways, in the mitochondrial respiratory chain and the SRP-dependent co-translational protein targeting to membrane. (d) Detailed overview on the synaptic and neurodevelopmental genes upregulated in Ptchd1− /yhippocampi. Histogram showing the Bonferroni-corrected P-values for the selected GO enrichments. The numbers indicate the amount of genes annotated with each term in the upregulated gene set and genomewide, respectively. Almost 25% of the PSD genes are upregulated in Ptchd1− /y hippocampi. (e) Enrichments for experimental binding sites from Cistrome chromatin immunoprecipitation-seq database. Upregulated genes are enriched in the binding sites of Suz12, Acsl1 and Rest, whereas downregulated genes are not. Complete data in Supplementary Table S9.
Figure 5. Impairments of synaptic morphology and activity in Ptchd1− /ymice. (a) Altered morphology of primary embryonic hippocampal
cultures from Ptchd1− /y embryos. Quantification of dendritic lengths, branching numbers and complexity from green fluorescent protein (GFP)-labelled hippocampal neurons at 18 days in vitro between wild-type (WT) and Ptchd1− /ylittermate embryos. Scale bar: 10μm. Data are presented as mean± s.e.m., n = 21 WT and 20 Ptchd1− /yneurons. *Po0.05 and **Po0.01, Mann–Whitney (length of branches: P = 0.005; and number of branches: P= 0.0452) and two-way analysis of variance with Sidak's multiple comparisons (branching complexity: level 1, P40.999; level 2, P40.999; level 3, P = 0.9668; level 4, P = 0.4663; level 5, P = 0.0119; level 6, P = 0.0004) tests. (b) Reduced synaptic density in hippocampus from Ptchd1− /ymice. Representative electron micrographs (EM) of synaptic contacts from hippocampal sections. Scale bar: 200 nm. Quantification of postsynaptic densities (PSDs) performed on a defined plane of 65 μm2. A total of 3 WT and 3 Ptchd1− /y brains (31 sections for each genotype representing 8–13 sections per animal). Graphical data are presented as scatter plots representing sections analysed for each animal± s.e.m., **Po0.01 (exact P = 0.0085, calculated using the mean values per animal); unpaired two-tailed Student’s t-test. (c) Altered morphology of the excitatory synapses in Ptchd1− /ymice. Higher magnification of EM is shown (white bars, dotted bars and white arrows indicate synaptic cleft width, PSD length and PSD width, respectively). All analysed excitatory synaptic junctions were defined by an asymmetric structural organization, including well-defined presynaptic (for example, vesicles) and postsynaptic (PSD) structures. Scale bars: 200 nm and 50 nm. (d) Comparison of the cumulative frequency for PSD length and width and for synaptic cleft width in WT and in Ptchd1− /y hippocampi. A total of 3 WT brains (86 synapses splitted in 19, 30 and 37 structures in the respective brains) and 3 Ptchd1− /ybrains (79 synapses splitted in 17, 26 and 35 in the respective brains) were analysed. Graphical data are presented as mean cumulative frequency curves obtained for each genotype± s.e.m.. Kolmogorov–Smirnov test; PSD length, P = 0.4154; PSD width, P = 0.0310; synaptic cleft width, P = 0.0008. (e–i) Reduced miniature excitatory postsynaptic current (mEPSC) frequency and increased release probability in Ptchd1− /y mice. Example traces (e) and quantification of mEPSC amplitude (f) and frequency (g). Example traces (h) and quantification (i) of paired pulse ratio. Sample size (n) is indicated in the bars as cells per animals. Data are presented as mean± s.e.m., **Po0.01. Student’s t-test. KO, knockout.
test conditions. In addition, we found that Ptchd1− /ymales had an increased number of rears in the actimetric cages and in the open field (Figure 3a and Supplementary Figure S2b), a parameter
reflecting stereotypic behaviour,32in line with clinical observations
and common features of attention deficit and hyperactivity disorder (ADHD) or ASD syndrome.10
When analysed for emotional behaviour in the elevated plus maze, the percentage of entries and time (Po0.05) spent in the open arms by Ptchd1− /y males were increased when compared with WT (Figure 3e). Ptchd1− /y males also displayed higher number of entries (Po0.01) (not shown) and spent more time in the centre of the open field than WT (Po0.05) (Figure 3d), supporting reduced anxiety in mutants. Such effect was confirmed using another cohort on Ptchd1− /ymales (Po0.001) but was not observed in Ptchd1−/−females (Supplementary Figure S2b). To the best of our knowledge, our study show for the first time that Ptchd1 deletion reduced anxiety in Ptchd1− /y male mice. Social behaviour was not affected in (Supplementary Figure S3a), in line with previously published data.13
No consequences of Ptchd1 deletion on acoustic startle and prepulse inhibition of startle reflex were detected (Supplementary Figure S3b), suggesting that the overall ability to filter out the unnecessary information is preserved in the mutant mice.
The effects of Ptchd1 gene inactivation were also evaluated on different aspects of learning and memory processes. When animals were allowed to discriminate between a novel object and a familiar one 3 h after an acquisition trial, only WT, but not Ptchd1− /ymice, displayed object recognition performance above the chance (Figure 3g), suggesting altered recognition memory following Ptchd1 inactivation in males. Ptchd1− /y males also showed altered working memory in the Y-maze test, as revealed by significantly reduced percentage of spontaneous alternations (P40.05; Figure 3f). These data are in line with attentional and cognitive features in developmental diseases, including ADHD and ASD syndromes.33,34 In the fear conditioning test, the baseline levels of immobility during habituation to the conditioning cages was lower in Ptchd1 mutants as compared with WT (Po0.01), supporting the hyperactivity observed in the other behavioural tests (Figure 3h). When animals were tested 24 h after condition-ing either in the same context or in a new one, Ptchd1− /ymales showed significantly decreased contextual freezing performance (Po0.01) and tended to have decreased cued freezing perfor-mance (P = 0.07; Figure 3h). Ptchd1−/− females also showed decreased contextual and cued fear conditioning (Po0.01; Supplementary Figure S3c). All these data suggest that Ptchd1 inactivation in males (and also in females) impact learning and memory processes as recently reported13and greatly extend the cognitive deficits to Ptchd1−/− females and to other cognitive domains such as learning and memory with object recognition and associative memory.
Dysregulation of the hippocampal synaptic transcriptome in the Ptchd1− /ymouse brain
The hippocampus is a hub involved in various learning and memory processes that are affected in the mutant Ptchd1 mouse line. Thus we characterized the impact of Ptchd1 deficiency on the hippocampal transcriptome at postnatal day 30. We confirmed that Ptchd1 mRNA (NM_001093750) level was strongly decreased in Ptchd1− /y brain (Z score: − 8.87, expression fold change Ptchd1− /y vs Ptchd1+/y: − 2.43) with a remaining expression of exon 3, revealing the presence of an alternative transcript skipping exon 2 (Supplementary Figure S1). Strikingly, the comparative analysis of RNA-seq data indicated that a very large number of genes are aberrantly expressed in the Ptchd1− /y hippocampus when compared with WT males. A total of 979 genes were upregulated and 820 genes were downregulated in Ptchd1− /y (Po0.01, DEseq2, mature transcripts; Supplementary Table S3). Clustering of Pearson correlations clearly segregated genetic conditions while associating biological replicates (Figure 4a).
We next performed a bioinformatics analysis based on published single-cell data35 for determining which cell types
should be affected in Ptchd1− /yhippocampus. Statistical analysis of markers of cell types (see Supplementary Methods) revealed
that upregulated genes are significantly enriched in markers of neuronal cells (pyramidal neurons 59 genes/Po1.8e-14, inter-neurons 23 genes/Po9.3e-6) while downregulated genes are significantly enriched in markers of glial and endothelial cells (astrocytes 28 genes/Po3.7e-5, oligodendrocytes 40 genes/ Po1.8e-7, endothelial 26 genes/Po7.7e-3) (Figure 4b; Supplem-entary Tables S4–S8). This bioinformatic evidence links Ptchd1− /y
upregulated genes to neuronal populations. Also gene ontology supports this link, as gene ontology enrichment analysis revealed that upregulated genes are highly enriched in presynaptic and postsynaptic proteins (Figure 4c). In particular, the most striking observation was the aberrant upregulation of the expression of a very large portion of PSD-associated genes (almost 25% of the total, Figure 4d), such as Dlg4 (encoding PSD95) or Shank1, 2 and 3. A large portion of presynaptic genes was also upregulated (20% of the total), including Syt1, Bsn and Vamp2. Upregulated genes also appeared linked to brain development including axonogen-esis and dendritogenaxonogen-esis (Figure 4d) and, when altered, should perturb the synaptic function. Upregulated genes also include highly significant amounts of transcription factors and chromatin remodelling factors (including the immediate-early genes Egr1 and Npas4 that have an increased expression level by about 50% in Ptchd1− /ymice, Supplementary Table S3) and appeared to be markedly implicated in the development of the central nervous system (Figures 4c and d).
Analysis of in silico-binding sites (MotifMap36) and cistrome (www.cistrome.org) experimental data (chromatin immunoprecipi-tation-seq) for transcription factors reveals that largely dissociated networks of transcription factors seem to regulate Ptchd1− /y upregulated and downregulated genes (Supplementary Table S9). For example, a release of the repression induced by Polycomb group proteins such as REST (which suppresses the transcription of many neuronal genes) and SUZ12 could be implicated in the aberrant upregulation of several genes in Ptchd1− /y mice (Figure 4e).
Impaired excitatory synaptic structure and activity in Ptchd1− /yhippocampus
The comparative in vitro analysis of neuronal morphology for both WT and Ptchd1− /y mature primary hippocampal cells (18 days in vitro) revealed significant differences in the dendritic length and in the number of branches, with Ptchd1− /y neuronal cultures displaying a decreased dendritic arborization compared with WT cultures, suggesting that the absence of Ptchd1 might affect neuritic/dendritic development (Figure 5a).
We then performed in situ ultra-structural analyses of hippo-campal sections from young adult (13–15 week old) Ptchd1− /y males using transmission electron microscopy (Figures 5b–d). We first observed a decrease in the number of excitatory synapses in the Ptchd1− /ybrain, leading to a diminution of around 33% of the synapses (mean WT = 21.9 ± 0.835 s.e.m.; mean Ptchd1− /y: 15.6 ± 1.004 s.e.m. in an arbitrary defined field section of 65 μm2
; 31 sections/3 mice for each genotype, unpaired Student’s t-test, P = 0.0083; Figure 5b).
The loss of Ptchd1 also resulted in ultra-structural deficits in excitatory synapses when analysing the cumulative frequency distribution, including a reduction of both PSD thickness (WT, 54.72 ± 2.7 nm s.e.m.; Ptchd1− /y, 37.42 ± 1.23 nm s.e.m., Kolmogorov–Smirnov test, Po0.0001) and synaptic cleft width (WT: 18.19 ± 0.37 nm s.e.m.; Ptchd1− /y, 15.50 ± 0.57 nm s.e.m., Kolmogorov–Smirnov test, Po0.01), when compared with WT hippocampal synapses (Figure 5d). The most striking difference between WT and Ptchd1− /ysynapses was the strong accumulation of neurotransmitter vesicles in Ptchd1− /y synaptic boutons (Figure 5c). Our combined results therefore indicated that Ptchd1 deficiency significantly affects the structural maturation and organization of excitatory neuronal synapses.
To examine the physiological consequences of these ultra-structural changes, we recorded mEPSCs from CA1 pyramidal neurons from P21 WT and Ptchd1− /y mice (Figures 5e–g). We found no changes in mEPSC amplitude (Figures 5e and f), but a significant decrease in mEPSC frequency in Ptchd1− /y compared with WT mice (Figures 5e and g). We next assessed the release probability of Schaffer collateral axons, the main excitatory input onto CA1 pyramidal cells, by PPR. We found that the PPR is significantly decreased in Ptchd1− /ycompared with WT brain, thus revealing an increased release probability at these synapses (Figures 5h and i). Together, these data indicate that pyramidal cells receive a reduced number of excitatory synapses in Ptchd1− /y mice but that these synapses present a higher release probability. DISCUSSION
Although pathogenic mutations in PTCHD1 gene have been described in a significant number of individuals and families with ASD and X-linked ID to date, the physiological function and contribution of the respective gene and protein during central nervous system development are poorly documented.
Here we provide several lines of evidence indicating that PTCHD1 is a novel synaptic player that is able to interact with postsynaptic membrane-associated scaffolding proteins, such as PSD95 and SAP102. Furthermore, PTCHD1 impacts on the expression level of synaptic genes, as Ptchd1 deficiency in mouse is associated with a global impact on the hippocampal memory function associated with dysregulation of synaptic transcriptome. Besides recent publishedfindings that highlighted a major role of PTCHD1 in the reticular thalamic nucleus in developing mouse brain,13 we also observed that the neurodevelopmental PTCHD1 gene expression profile and pattern partly differed between primates (human and macaques) and mouse. Several studies suggested that these differences would reflect many primate-specific features of cortical development.21,37,38
Our subcellular localization study was performed using PTCHD1-GFP with the GFP inserted at the C-terminal end of PTCHD1. Although we observed that PTCHD1-GFP was enriched in synaptic structures and displayed a plasma membrane labelling, we must consider that the PDZ-binding motif might be not functional, because of the position of the GFP, in transfected neurons as PDZ domain interactions normally require a free C-terminal end. To circumvent this limitation, we tested other PTCHD1 constructs with GFP included at the N-terminus or inserted in the second extracellular loop, but we were unsuccess-ful to obtain any membrane/synaptic localization or any fluorescence in transfected cells. Finally, despite several attempts of PTCHD1 antibody production (using a strategy of various peptides combinations), we were also unable to obtain excellent specific PTCHD1 antibody to assess endogenous PTCHD1 neuronal localization by immunofluorescence analysis. Consequently, our conclusions regarding the subcellular localization of PTCHD1-GFP have to be taken with this caveat in mind. Further work would provide evidence to validate the endogenous interaction between PTCHD1 and PSD95/SAP102 proteins through the PDZ-binding motif that might contribute to PTCHD1 dynamics, trafficking and stability in synapses. The generation of highly specific antibodies against PTCHD1 will help into the detailed characterization of its neuronal subcellular localization.
We discovered that Ptchd1 gene expression appears essential to the functional organization of excitatory synapses in the mouse hippocampus. We observed that both Egr1 and Npas4 genes were upregulated in the Ptchd1− /yhippocampus. Unlike Egr1, Npas4 is expressed exclusively in neurons where it is able to modulate GABAergic, glutamatergic or both types of synapses.39,40 Further-more, it has been demonstrated that Npas4 overexpression in hippocampal neuronal cultures increased the number of inhibitory synapses, suggesting that higher Npas4 level result in more
inhibition and less excitation, leading to reduced excitability of hippocampal neurons.39 These findings suggest that Ptchd1 deficiency not only cause defects targeting thalamic GABAergic neurons13 but also induce alterations in synaptic homeostasis (that is, excitatory/inhibitory (E/I) balance) through Npas4 increased expression level. Npas4 would be a major actor that maintains the E/I balance of neural circuits by recruiting inhibitory synapses onto excitatory neurons and excitatory synapses onto inhibitory neurons in response to increased activity.41
We also found that PTCHD1 includes a functional PDZ-binding site allowing direct interactions with core scaffolding proteins of the excitatory PSD proteome, such as PSD95 and SAP102. Similar receptor–scaffold associations also involve N-methyl-D-aspartate
(NMDA) receptors, Neuroligins 1, 3 and 4, which are the major components for excitatory synapse formation and function. Interestingly, PTCHD4 protein harbours a predicted consensus PDZ-binding site (Figure 1b). This interaction domain is absent in PTCH1 receptor, which suggests that PTCHD1 is probably involved in a specific signalling pathway distinct from the canonical SHH cascade, as initially hypothesized.42
Kim et al.42observed that Ptchd1 mRNA expression level was found strongly upregulated in mouse primary cortical neuronal cultures exposed during 6 h to an elevated level of potassium chloride (KCl, 55 mM) causing a membrane depolarization and
neuronal activation. Similar results were obtained for Grin1, encoding the NMDA receptor subunit 1, and suggest that Ptchd1 expression could be modulated by neuronal activity.
Whether PTCHD1 is a receptor for SHH remains a question that will require future work. Interestingly, SHH signalling is functional in developing neurons where it regulates spinogenesis and axonal growth.43,44A very recent study evidenced that SHH can inhibit glutamate transporter activities in neurons and is able to modulate neuronal activity in hippocampal cultures and slices.45 However, our results suggest that PTCHD1 might not bind SHH given its incapacity to rescue PTCH1 deficiency to activate the canonical SHH pathway (that is, Gli-dependent) and because it does not include the SHH ligand-binding site that is present in PTCH1 (LTKQRLVDADG, amino acids 888–898 in human PTCH1, NP_032983).46
Comprehensive clinical analysis of patients with PTCHD1 mutation described several symptoms ranging from attention deficit, hyperactivity, sleep abnormality, hypotonia and learning disability.10In line with clinical data, ourfindings show that Ptchd1 deficiency caused hyperactivity, decreased muscle strength, altered motor coordination and cognitive dysfunction, confirming phenotypes previously described in Ptchd1-deficient mice13and extending the list of common features in patients with PTCHD1 mutations.10
The behaviouralfindings in our mouse model are not a simple replication of previously described phenotypes in Ptchd1− /y males,13but thorough characterization of alterations consecutive to Ptchd1 deletion in mice. First, our findings extend the robustness of hyperactivity phenotype not only in the openfield (as described by Wells et al.13) but also in other situations,
including circadian measurement of activity, or in social test conditions. Hyperactivity was also observed in Ptchd1−/− female mice. In addition, we found that Ptchd1− /y mutants exhibited a significant increase in local activity in the rear part of the cages during the dark phase of the circadian cycle, an interpreted stereotypic behaviour. Mutants also had increased number of rears in different situations, considered as a repetitive motor behaviour and classically used to reflect stereotypic behaviour in addition to other parameters.32Increased stereotypic behaviour is a common feature of ASD and ADHD, in line with clinical observations.
Furthermore, we found hypotonic-like behaviour and motor coordination deficits (rotarod, startle response) extending pub-lished data and replicating features described in patients with
PTCHD1 deficiency.10,13 Circadian activity measurements also
revealed increased activity during the light phase suggesting altered sleep, similarly to the clinical observations.10When looking at cognitive abilities, our data reveal specific alteration in working memory, in line with attentional and cognitive features in neurodevelopmental disorders, including ADHD and ASD. Indeed, executive dysfunction (including working memory) is considered a promising endophenotype in neurodevelopmental disorders, such as ASD and ADHD (for a review, see Craig et al.47). However, contrasting results were reported: working memory deficits were more pronounced either in ASD or in ADHD depending on the studies; even deficits were not observed in some studies reporting ASD or ADHD clinical investigations.47Our results are consistent
with potential deficits described either in ASD or ADHD.
Finally, our study did not focus only on males but describes interesting phenotypes both in males and females, while others are specific to males such as reduced anxiety. Considering the X-linked inheritance model of PTCHD1 mutations, most cases are males. Among 23 cases described so far,10 only one is a female who was described to have speech delay and a formal diagnosis of ASD, while males had more extended features. Our data are in line with these clinical observations, with Ptchd1−/−female mice without obvious neurological abnormalities.
In summary, the analysis of our Ptchd1− /ymouse model revealed structural and functional impairments at excitatory synapses as well as behavioural and cognitive alterations. Our observations indicated that Ptchd1 deficiency causes defects in the structural organization of synapses during brain development. We replicated cognitive deficits (fear conditioning deficits) previously reported13 and also found working memory deficits, which is supposed to be an attentional-dependent ability, altered in ADHD/ASD conditions.33,34Finally our data evidenced for the first time that Ptchd1 deletion in female mice also caused ADHD-like hyperactive behaviour and learning and memory deficits.
It will be of major interest to better understand in future studies the specific contribution of PTCHD1 gene and protein at the synapse, in spine formation and synaptic maintenance and/or communication.
CONFLICT OF INTEREST
The authors declare no conflict of interest.
ACKNOWLEDGMENTS
This work was funded by grants from European Union (FP7 Gencodys, grant 241995) to FL, YH and PB; grants from the ‘Association pour le Développement de la Neurogénétique’ to FL; the Jérôme Lejeune foundation, the ‘Agence Nationale de la Recherche’ (ANR-15-CE16-0015-01) and French Government for the ‘Investments for the Future’ LabEx ‘SIGNALIFE’ (ANR-11-LABX-0028-01) to SM; the IDEX02 and labex INRT (ANR-10-IDEX-0002-02; ANR-10-LABX-0030-INRT) and the National Infrastructure for Biology and health PHENOMIN (ANR-10-INBS-07) to YH; and a doctoral fellowship from the‘Région Centre Val de Loire’ to DCU. Electron and Confocal Microscopy data were obtained with the technical assistance of J Rousseau and J Burlaud-Gaillard at the IBiSA Electron Microscopy Facility of University François-Rabelais of Tours.
REFERENCES
1 Vissers LE, Gilissen C, Veltman JA. Genetic studies in intellectual disability and related disorders. Nat Rev Genet 2016;17: 9–18.
2 Chen JA, Peñagarikano O, Belgard TG, Swarup V, Geschwind DH. The emerging picture of autism spectrum disorder: genetics and pathology. Annu Rev Pathol 2015;10: 111–144.
3 Bourgeron T. From the genetic architecture to synaptic plasticity in autism spectrum disorder. Nat Rev Neurosci 2015;16: 551–563.
4 Sahin M, Sur M. Genes, circuits, and precision therapies for autism and related neurodevelopmental disorders. Science 2015;350: 6263.
5 van Bokhoven H. Genetic and epigenetic networks in intellectual disabilities. Annu Rev Genet 2011;45: 81–104.
6 Parikshak NN, Gandal MJ, Geschwind DH. Systems biology and gene networks in neurodevelopmental and neurodegenerative disorders. Nat Rev Genet 2015;16: 441–458.
7 Volk L, Chiu SL, Sharma K, Huganir RL. Glutamate synapses in human cognitive disorders. Annu Rev Neurosci 2015;38: 127–149.
8 Kochinke K, Zweier C, Nijhof B, Fenckova M, Cizek P, Honti F et al. Systematic phenomics analysis deconvolutes genes mutated in intellectual disability into biologically coherent modules. Am J Hum Genet 2016;98: 149–164.
9 Noor A, Whibley A, Marshall CR, Gianakopoulos PJ, Piton A, Carson AR et al. Disruption at the PTCHD1 Locus on Xp22.11 in Autism spectrum disorder and intellectual disability. Sci Transl Med 2010;2: 49ra68.
10 Chaudhry A, Noor A, Degagne B, Baker K, Bok LA, Brady AF et al. Phenotypic spectrum associated with PTCHD1 deletions and truncating mutations includes intellectual disability and autism spectrum disorder. Clin Genet 2015;88: 224–233. 11 Filges I, Röthlisberger B, Blattner A, Boesch N, Demougin P, Wenzel F et al. Deletion in Xp22.11: PTCHD1 is a candidate gene for X-linked intellectual dis-ability with or without autism. Clin Genet 2011;79: 79–85.
12 Torrico B, Fernàndez-Castillo N, Hervás A, Milà M, Salgado M, Rueda I et al. Contribution of common and rare variants of the PTCHD1 gene to autism spec-trum disorders and intellectual disability. Eur J Hum Genet 2015;23: 1694–1701. 13 Wells MF, Wimmer RD, Schmitt LI, Feng G, Halassa MM. Thalamic reticular impairment underlies attention deficit in Ptchd1Y/− mice. Nature 2016; 532:
58–63.
14 Zíková M, Konířová J, Ditrychová K, Corlett A, Kolář M, Bartůněk P. DISP3 promotes proliferation and delays differentiation of neural progenitor cells. FEBS Lett 2014; 588: 4071–4077.
15 Fan J, Akabane H, Zheng X, Zhou X, Zhang L, Liu Q et al. Male germ cell-specific expression of a novel Patched-domain containing gene Ptchd3. Biochem Biophys Res Commun 2007;363: 757–761.
16 Chung JH, Larsen AR, Chen E, Bunz F. A PTCH1 homolog transcriptionally activated by p53 suppresses Hedgehog signaling. J Biol Chem 2014; 289: 33020–33031.
17 Yao PJ, Petralia RS, Ott C, Wang YX, Lippincott-Schwartz J, Mattson MP. Dendrosomatic Sonic Hedgehog Signaling in hippocampal neurons regulates axon elongation. J Neurosci 2015;35: 16126–16141.
18 Petralia RS, Wang YX, Mattson MP, Yao PJ. Sonic hedgehog distribution within mature hippocampal neurons. Commun Integr Biol 2011;4: 775–777.
19 Yam PT, Langlois SD, Morin S, Charron F. sonic hedgehog guides axons through a noncanonical, Src-family-kinase-dependent signaling pathway. Neuron 2009;62: 349–362.
20 Farmer WT, Abrahamsson T, Chierzi S, Lui C, Zaelzer C, Jones EV et al. Neurons diversify astrocytes in the adult brain through sonic hedgehog signaling. Science 2016;351: 849–854.
21 Bakken TE, Miller JA, Luo R, Bernard A, Bennett JL, Lee CK et al. Spatiotemporal dynamics of the postnatal developing primate brain transcriptome. Hum Mol Genet 2015;24: 4327–4339.
22 Birling MC, Dierich A, Jacquot S, Hérault Y, Pavlovic G. Highly-efficient, fluorescent, locus directed cre and FlpO deleter mice on a pure C57BL/6N genetic background. Genesis 2012;50: 482–489.
23 Karp NA, Meehan TF, Morgan H, Mason JC, Blake A, Kurbatova N et al. Applying the ARRIVE guidelines to an in vivo database. PLoS Biol 2015;13: e1002151. 24 Iqbal Z, Willemsen MH, Papon MA, Musante L, Benevento M, Hu H et al.
Homozygous SLC6A17 mutations cause autosomal-recessive intellectual disability with progressive tremor, speech impairment, and behavioral problems. Am J Hum Genet 2015;96: 386–396.
25 Hu H, Haas SA, Chelly J, Van Esch H, Raynaud M, de Brouwer AP et al. X-exome sequencing of 405 unresolved families identifies seven novel intellectual disability genes. Mol Psychiatry 2016;21: 133–148.
26 Emes RD, Grant SG. Evolution of synapse complexity and diversity. Annu Rev Neurosci 2012;35: 111–131.
27 Koleske AJ. Molecular mechanisms of dendrite stability. Nat Rev Neurosci 2013;14: 536–550.
28 Sans N, Prybylowski K, Petralia RS, Chang K, Wang YX, Racca C et al. NMDA receptor trafficking through an interaction between PDZ proteins and the exocyst complex. Nat Cell Biol 2003;5: 520–530.
29 Dresbach T, Neeb A, Meyer G, Gundelfinger ED, Brose N. Synaptic targeting of neuroligin is independent of neurexin and SAP90/PSD95 binding. Mol Cell Neurosci 2004;27: 227–235.
30 Bresler T, Shapira M, Boeckers T, Dresbach T, Futter M, Garner CC et al. Postsynaptic density assembly is fundamentally different from presynaptic active zone assembly. J Neurosci 2004;24: 1507–1520.
31 Holtz AM, Peterson KA, Nishi Y, Morin S, Song JY, Charron F et al. Essential role for ligand-dependent feedback antagonism of vertebrate hedgehog signaling by PTCH1, PTCH2 and HHIP1 during neural patterning. Development 2013; 140: 3423–3434.
32 Canales JJ, Graybiel AM. A measure of striatal function predicts motor stereotypy. Nat Neurosci 2000;3: 377–383.
33 Biscaldi M, Bednorz N, Weissbrodt K, Saville CW, Feige B, Bender S et al. Cognitive endophenotypes of attention deficit/hyperactivity disorder and intra-subject variability in patients with autism spectrum disorder. Biol Psychol 2016;118: 25–34.
34 Schwarz E, Tost H, Meyer-Lindenberg A. Working memory genetics in schizophrenia and related disorders: an RDoC perspective. Am J Med Genet B Neuropsychiatr Genet 2016;171B: 121–131.
35 Zeisel A, Muñoz-Manchado AB, Codeluppi S, Lönnerberg P, La Manno G, Juréus A et al. Brain structure. Cell types in the mouse cortex and hippocampus revealed by single-cell RNA-seq. Science 2015;347: 1138–1142.
36 Xie X, Rigor P, Baldi P. MotifMap: a human genome-wide map of candidate regulatory motif sites. Bioinformatics 2009;25: 167–174.
37 Zeng H, Shen EH, Hohmann JG, Oh SW, Bernard A, Royall JJ et al. Large-scale cellular-resolution gene profiling in human neocortex reveals species-specific molecular signatures. Cell 2012;149: 483–496.
38 Miller JA, Ding SL, Sunkin SM, Smith KA, Ng L, Szafer A et al. Transcriptional landscape of the prenatal human brain. Nature 2014;508: 199–206.
39 Sun X, Lin Y. Npas4: linking neuronal activity to memory. Trends Neurosci 2016;39: 264–275.
40 Lin Y, Bloodgood BL, Hauser JL, Lapan AD, Koon AC, Kim TK et al. Activity-dependent regulation of inhibitory synapse development by Npas4. Nature 2008; 455: 1198–1204.
41 Spiegel I, Mardinly AR, Gabel HW, Bazinet JE, Couch HC, Tzeng CP et al. Npas4 regulates excitatory-inhibitory balance within neural circuits through cell-type-specific gene programs. Cell 2014; 157: 1216–1229.
42 Kim TK, Hemberg M, Gray JM, Costa AM, Bear DM, Wu J et al. Widespread tran-scription at neuronal activity-regulated enhancers. Nature 2010;465: 182–187. 43 Mitchell N, Petralia RS, Currier DG, Wang YX, Kim A, Mattson MP et al. Sonic
hedgehog regulates presynaptic terminal size, ultrastructure and function in hippocampal neurons. J Cell Sci 2012;125: 4207–4213.
44 Petralia RS, Schwartz CM, Wang YX, Mattson MP, Yao PJ. Subcellular localization of Patched and Smoothened, the receptors for Sonic hedgehog signaling, in the hippocampal neuron. J Comp Neurol 2011;519: 3684–3699.
45 Feng S, Ma S, Jia C, Su Y, Yang S, Zhou K et al. Sonic hedgehog is a regulator of extracellular glutamate levels and epilepsy. EMBO Rep 2016;17: 682–694. 46 Bosanac I, Maun HR, Scales SJ, Wen X, Lingel A, Bazan JF et al. The structure of
SHH in complex with HHIP reveals a recognition role for the Shh pseudo active site in signaling. Nat Struct Mol Biol 2009;16: 691–698.
47 Craig F, Margari F, Legrottaglie AR, Palumbi R, de Giambattista C, Margari L. A review of executive function deficits in autism spectrum disorder and attention-deficit/hyperactivity disorder. Neuropsychiatr Dis Treat 2016; 12: 1191–1202.
This work is licensed under a Creative Commons Attribution-NonCommercial-ShareAlike 4.0 International License. The images or other third party material in this article are included in the article’s Creative Commons license, unless indicated otherwise in the credit line; if the material is not included under the Creative Commons license, users will need to obtain permission from the license holder to reproduce the material. To view a copy of this license, visit http:// creativecommons.org/licenses/by-nc-sa/4.0/
© The Author(s) 2018
Supplementary Information accompanies the paper on the Molecular Psychiatry website (http://www.nature.com/mp)