HAL Id: hal-01189776
https://hal.archives-ouvertes.fr/hal-01189776
Submitted on 1 Sep 2015
HAL is a multi-disciplinary open access
archive for the deposit and dissemination of
sci-entific research documents, whether they are
pub-lished or not. The documents may come from
teaching and research institutions in France or
abroad, or from public or private research centers.
L’archive ouverte pluridisciplinaire HAL, est
destinée au dépôt et à la diffusion de documents
scientifiques de niveau recherche, publiés ou non,
émanant des établissements d’enseignement et de
recherche français ou étrangers, des laboratoires
publics ou privés.
of arvicanthis niloticus (Murinae) and sub-saharan open
habitats pleistocene history
Gauthier Dobigny, Caroline Tatard, Philippe Gauthier, Khalilou Ba,
Jean-Marc Duplantier, Laurent Granjon, Gael Kergoat
To cite this version:
Gauthier Dobigny, Caroline Tatard, Philippe Gauthier, Khalilou Ba, Jean-Marc Duplantier, et al..
Mitochondrial and nuclear genes-based phylogeography of arvicanthis niloticus (Murinae) and
sub-saharan open habitats pleistocene history. PLoS ONE, Public Library of Science, 2013, 8 (11),
�10.1371/journal.pone.0077815�. �hal-01189776�
Phylogeography of
Arvicanthis niloticus
(Murinae) and
Sub-Saharan Open Habitats Pleistocene History
Gauthier Dobigny1,2, Caroline Tatard3, Philippe Gauthier1, Khalilou Ba4, Jean-Marc Duplantier1, Laurent Granjon1,4, Gael J. Kergoat3*
1 IRD, CBGP (IRD, Inra, CIRAD, Montpellier SupAgro), Campus de Baillarguet, Montferrier-sur-Lez, France, 2 Centre Re´gional Agrhymet, Rive Droite, Niamey, Niger, 3 Inra, CBGP (IRD, Inra, CIRAD, Montpellier SupAgro), Campus de Baillarguet, Montferrier-sur-Lez, France,4 IRD, CBGP (IRD, Inra, CIRAD, Montpellier SupAgro), Dakar, Senegal
Abstract
A phylogeographic study was conducted on the Nile grass rat, Arvicanthis niloticus, a rodent species that is tightly associated with open grasslands from the Sudano-Sahelian regions. Using one mitochondrial (cytochrome b) and one nuclear (intron 7 of Beta Fibrinogen) gene, robust patterns were retrieved that clearly show that (i) the species originated in East Africa concomitantly with expanding grasslands some 2 Ma, and (ii) four parapatric and genetically well-defined lineages differentiated essentially from East to West following Pleistocene bioclimatic cycles. This strongly points towards allopatric genetic divergence within savannah refuges during humid episodes, then dispersal during arid ones; secondary contact zones would have then stabilized around geographic barriers, namely, Niger River and Lake Chad basins. Our results pertinently add to those obtained for several other African rodent as well as non-rodent species that inhabit forests, humid zones, savannahs and deserts, all studies that now allow one to depict a more comprehensive picture of the Pleistocene history of the continent south of the Sahara. In particular, although their precise location remains to be determined, at least three Pleistocene refuges are identified within the West and Central African savannah biome.
Citation: Dobigny G, Tatard C, Gauthier P, Khalilou Ba, Duplantier J-M, et al. (2013) Mitochondrial and Nuclear Genes-Based Phylogeography of Arvicanthis niloticus (Murinae) and Sub-Saharan Open Habitats Pleistocene History. PLoS ONE 8(11): e77815. doi:10.1371/journal.pone.0077815
Editor: Roscoe Stanyon, University of Florence, Italy
Received April 13, 2013; Accepted September 5, 2013; Published November 1, 2013
Copyright: ß 2013 Dobigny et al. This is an open-access article distributed under the terms of the Creative Commons Attribution License, which permits unrestricted use, distribution, and reproduction in any medium, provided the original author and source are credited.
Funding: The authors have no support or funding to report.
Competing Interests: The authors have declared that no competing interests exist. * E-mail: kergoat@supagro.inra.fr
Introduction
Current climatic changes and their consequences on the evolution of biodiversity are a hotly debated topic with sometimes highly divergent predictive scenarios [1–6]. In most groups, long-term surveys are still lacking to provide robust predictions under various potential scenarios. In such a context, though at a very different scale, the reconstruction of past eco-climatic modifica-tions may provide helpful pieces of information. In particular, when interpreted through available paleo-environmental frame-works, phylogeographic studies of habitat-specialist species can join the cortege of data that is necessary to draw the complete picture [7,8]. Even more instructive is the comparison of phylogeographic patterns obtained in several species sharing the same biogeographic regions [9–11].
In Africa, a majority of phylogeographic investigations have been conducted on large mammals (see references below; review in [10]). Yet, the latter are now usually confined to protected areas where recent demographic and genetic effects may mask signatures of more ancient evolutionary events. In contrast, rodents appear as excellent alternative phylogeographic markers owing to their usually strong affinities to particular ecological niches and wide geographic distribution, their short generation time, their weak dispersal abilities as well as their small size that may render them highly sensible to geographic barriers such as mountains or large rivers, thus limiting admixture between
allopatrically differentiated lineages. Altogether, these character-istics are expected to greatly facilitate detection of phylogeographic patterns. Moreover, most of rodent species being abundant and non-protected (when not pest organisms), they are relatively easy to sample, thus facilitating the gathering of datasets that are appropriate for phylogeographic/population studies. This may explain why all African species investigated so far led to strong phylogeographic signals, as well as remarkable congruence between sometimes highly divergent taxa. Indeed, data are now available for rodent species inhabiting arid zones (Jaculus jaculus: [12]), steppes, shrub and tree savannahs (Lemniscomys striatus: [13]; Praomys daltoni: [14]; Mastomys erythroleucus: [15,16]; Mastomys natalensis: [17]), rocky habitats (Acomys chudeaui: [18]), humid areas (Mastomys huberti: [19]), forest-savannah mosaics [Mus (Nannomys) minutoides: [20] and forests (Praomys rostratus and P. tullbergi: [21]; P. misonnei: [22,23]).
As part of this process, we here focused on the Nile grass rat, Arvicanthis niloticus (Muridae, Murinae). This species ranges all along the Southern limit of the Sahara desert, throughout the Sahelian and Sudanian regions, from the Atlantic to the Indian Oceans [24,25]. As such, A. niloticus biogeographic evolution is expected to provide interesting insights on the effects of past eco-climatic changes on sub-Saharan steppes and savannahs. The genus Arvicanthis contains seven currently recognized species [24], all found south of the Sahara desert, from the Atlantic coast in Senegal to Ethiopia, and down south to Zambia, with the
exceptions of populations along the Nile Valley in Egypt, south west of the Arabian Peninsula, and a mention from the Hoggar mountains, south east Algeria [24,25]. Many of them represent sibling species whose boundaries and phylogenetic relationships have essentially been resolved thanks to cytogenetic and molecular studies [26–33]. Nevertheless, systematic investigations are still required, particularly for several East African taxa (see [32], and below) as well as other ambiguous taxonomic units (e.g. ANI-2 and ANI-4; see [34]).
The Nile grass rat Arvicanthis niloticus is a well-defined species characterized by a 2N = 62/number of autosomal arms (NFa) = 62–64 karyotype ([26,28–30]). This species exhibits the widest distribution within the genus [24]. It is rather generalist and inhabits steppes, savannahs as well as humid zones and human-modified biotopes (e.g. villages, gardens, rice fields, sometimes within cities) of the Sahelian and Sudanian bioclimatic zones where it is considered a major agricultural pest [25]. Arvicanthis niloticus has also been shown to carry a number of pathogens, such as Leishmania major [35], Borrelia spp. [36], Leptospira spp. [37], Rickettsia spp. [38], Schistosoma spp. [39] or Toxoplasma gondii [40]. Yet, our understanding of evolutionary patterns in the Nile grass rat still relies on very scarce data, and no wide scale survey has been performed on this species to date. Previous cytogenetic studies have suggested the possible existence of two lineages, a West African one (ANI-1a, sensu [30]) and another Central and East African one (ANI-1b) whose karyotypes would differ by a pericentric inversion on pair 30 (NFa = 62 and 64, respectively; [30]). Recently, Abdel Rahman et al. [33] proposed some preliminary hypotheses about A. niloticus phylogeography and demogenetics using only mitochondrial DNA (mtDNA) sequence data. Unfortunately, their study was based on only 26 specimens, 23 of which were sampled in Sudan, making their results likely biased and uninformative at a wider scale.
In order to fill this gap, we performed a comprehensive phylogeographic survey of A. niloticus based on a sample that covers all the species range. In contrast with previous phylogeo-graphic studies dealing with West and Central African rodents (see above), we used both a mitochondrial (cytochrome b) and a non-translated part of a nuclear (Beta Fibrinogen intron 7) coding genes to infer the evolutionary history of our species of interest. We also implemented more thorough time calibration analyses, by using independent set of constraints based either on fossil data or on secondary calibrations. Finally, our results are discussed in regards to those previously obtained for other rodent as well as non-rodent species in this part of Africa.
Materials and Methods Sampling Effort
In total, 105 individuals of A. niloticus and two A. ansorgei individuals were trapped during various field surveys conducted in seven countries (Burkina-Faso, Cameroon, Chad, Mali, Niger, Mauritania and Senegal; Table 1). Organs or hind feet digits were conserved in ethanol until use in the laboratory. In addition, fibroblast cell pellets from one A. niloticus specimen from Egypt and two A. cf. niloticus individuals from Kenya were kindly provided by V. Volobouev (Muse´um National d’Histoire Naturelle, Paris, France). Four ethanol-preserved samples of A. niloticus from Sudan (courtesy of E. Abdel Rahman, Natural Science Museum, Durban, South Africa) and one A. ansorgei from Burkina-Faso (courtesy of M. Deniau) were also available. All these specimens (115 in total) were sequenced for the mitochrondrial cytochrome b gene (cytb), while some representatives were selected among them for the intron 7 of the nuclear gene Beta Fibrinogen (Fib7) sequencing (see
details below). In addition, 54 cytb sequences were downloaded from GenBank, among which 34 A. niloticus representatives (one from Egypt, one from Senegal, two from Niger, seven from Cameroon and 23 from Sudan), nine representatives of other Arvicanthis species as well as 11 representatives of other genera (Aethomys, Desmomys, Golunda, Mylomys, Otomys, Pelomys, and Rhabdomys). For the fib7 dataset we also used a sequence from a specimen of Mastomys erythroleucus that was trapped in Mali. Finally, one Lemniscomys cytb sequence was kindly provided by V. Nicolas (Museum National d’Histoire Naturelle, Paris, France). The rationale here (see also the Phylogenetic and dating analyses section for details) was: (i) to have a dense sampling of Arvicanthis species in order to properly enforce the corresponding fossil constraint; (ii) include species used in previous studies within Arvicanthini and Murinae [41,42] in order to perform secondary calibrations. Associated voucher specimens are deposited in the collections of the Centre de Biologie pour la Gestion des Populations (CBGP, France), Muse´um National d’Histoire Naturelle (MNHN, France) and Durban Natural Science Museum (DM); they can be recovered using numbers provided in Table 1.
Ethics Statement
Each trapping campaign was validated by national and local authorities. At the French level, all sampling procedures were conducted by biologists from the IRD holding a certificate to carry out experiments on live animals (‘certificat d’autorisation a` expe´rimenter sur animaux vivants’; agreement number C34-106, valid until December, 16th 2016). The CBGP joint research unit is also holding an agreement to conduct experiments on live animals (‘e´tablissement agre´e´ pour expe´rimenter sur animaux vivants’; agreement number C34-169-1, valid until July, 25th 2017). Within each country where sampling was performed, research was systemat-ically made possible thanks to extant conventions between the IRD and local governments (see the regional sections as well as IRD Ethical Guidelines on the IRD website: www.ird.fr). Additional authorizations were not required because Arvicanthis species are considered as pest species (especially A. niloticus) and have no protected status (see IUCN and CITES lists). At the local level, traps were systematically set only after the agreement of the village head and the field owner was explicitly obtained. Moreover, in cultivated fields, traps were always posed on the edge of the exploited area, so that no damage could be cause to crops. Nile rats were caught alive in wire-mesh and Sherman traps. All animals were euthanized by cervical dislocation. Animals were treated in a humane manner, and in accordance with guidelines of the American Society of Mammalogists [43]. No ethic country-specific agreement could be obtained since countries where sampling occurred and the IRD have no ethics committee that oversees animal experimentation.
DNA Extraction and Sequencing
Total genomic DNA was extracted using the Puregene DNA Purification Kit (Gentra Systems). The complete cytb mitochon-drial gene was then amplified using primers H15915 and L14123 following procedures detailed in Lecompte et al., [44]. The resulting PCR products were purified and then sequenced in both directions on a MegaBACE 1000 (Amersham Biosciences). Sequences were carefully checked by eye, and aligned using the ClustalW Multiple Alignment option implemented in BioEdit v.7.0.4.1 [45]. In total, our cytb dataset includes 169 sequences encompassing 146 A. niloticus, two A. cf. niloticus, 11 other Arvicanthis spp. and 10 representatives of other rodent genera (Table 1). The complete non translated intron 7 of the Fibrinogen nuclear gene was amplified using primers BFIBR1 and BFIBR2, following
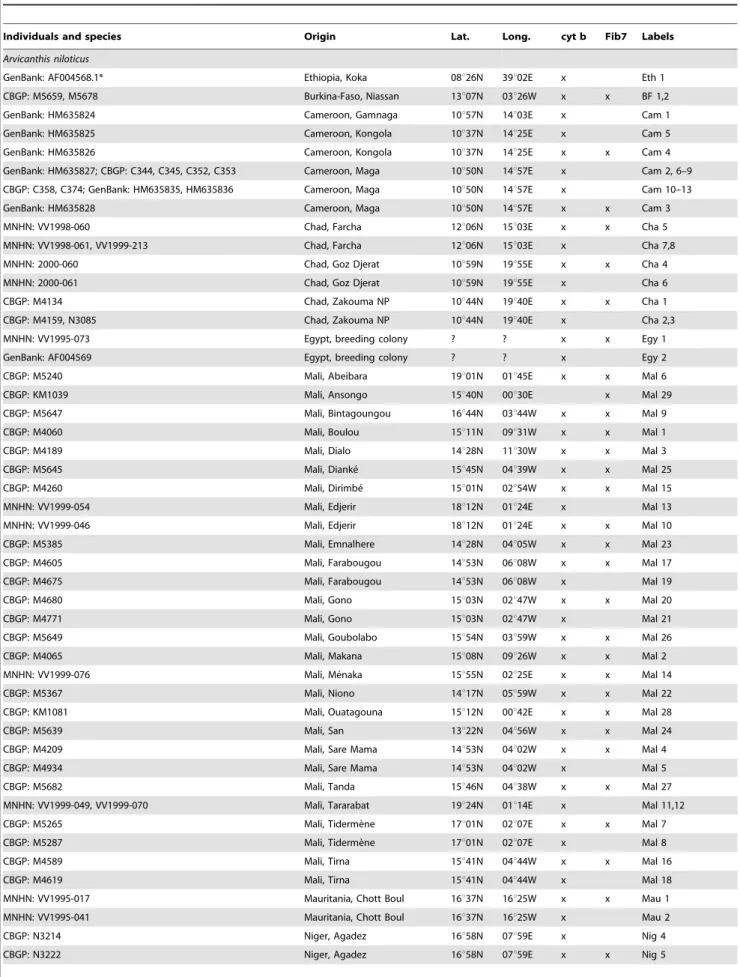
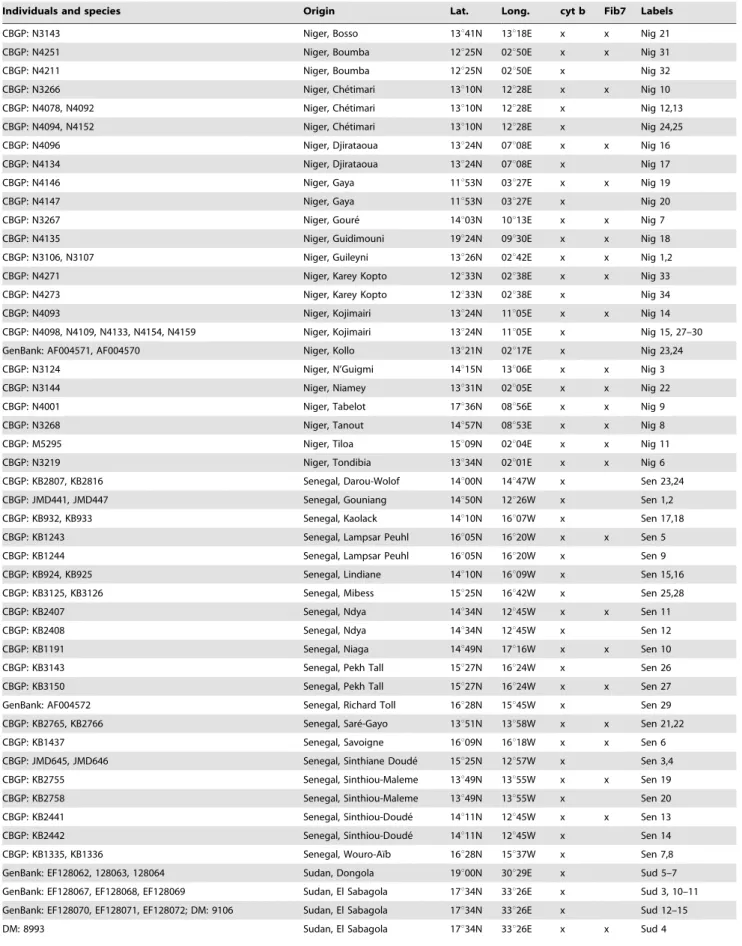
Table 1. Samples used in this study, with the individual reference numbers of the different collections where they are registered.
Individuals and species Origin Lat. Long. cyt b Fib7 Labels
Arvicanthis niloticus
GenBank: AF004568.1* Ethiopia, Koka 08u26N 39u02E x Eth 1 CBGP: M5659, M5678 Burkina-Faso, Niassan 13u07N 03u26W x x BF 1,2 GenBank: HM635824 Cameroon, Gamnaga 10u57N 14u03E x Cam 1 GenBank: HM635825 Cameroon, Kongola 10u37N 14u25E x Cam 5 GenBank: HM635826 Cameroon, Kongola 10u37N 14u25E x x Cam 4 GenBank: HM635827; CBGP: C344, C345, C352, C353 Cameroon, Maga 10u50N 14u57E x Cam 2, 6–9 CBGP: C358, C374; GenBank: HM635835, HM635836 Cameroon, Maga 10u50N 14u57E x Cam 10–13 GenBank: HM635828 Cameroon, Maga 10u50N 14u57E x x Cam 3 MNHN: VV1998-060 Chad, Farcha 12u06N 15u03E x x Cha 5 MNHN: VV1998-061, VV1999-213 Chad, Farcha 12u06N 15u03E x Cha 7,8 MNHN: 2000-060 Chad, Goz Djerat 10u59N 19u55E x x Cha 4 MNHN: 2000-061 Chad, Goz Djerat 10u59N 19u55E x Cha 6 CBGP: M4134 Chad, Zakouma NP 10u44N 19u40E x x Cha 1 CBGP: M4159, N3085 Chad, Zakouma NP 10u44N 19u40E x Cha 2,3 MNHN: VV1995-073 Egypt, breeding colony ? ? x x Egy 1 GenBank: AF004569 Egypt, breeding colony ? ? x Egy 2
CBGP: M5240 Mali, Abeibara 19u01N 01u45E x x Mal 6
CBGP: KM1039 Mali, Ansongo 15u40N 00u30E x Mal 29
CBGP: M5647 Mali, Bintagoungou 16u44N 03u44W x x Mal 9
CBGP: M4060 Mali, Boulou 15u11N 09u31W x x Mal 1
CBGP: M4189 Mali, Dialo 14u28N 11u30W x x Mal 3
CBGP: M5645 Mali, Dianke´ 15u45N 04u39W x x Mal 25
CBGP: M4260 Mali, Dirimbe´ 15u01N 02u54W x x Mal 15
MNHN: VV1999-054 Mali, Edjerir 18u12N 01u24E x Mal 13 MNHN: VV1999-046 Mali, Edjerir 18u12N 01u24E x x Mal 10 CBGP: M5385 Mali, Emnalhere 14u28N 04u05W x x Mal 23 CBGP: M4605 Mali, Farabougou 14u53N 06u08W x x Mal 17
CBGP: M4675 Mali, Farabougou 14u53N 06u08W x Mal 19
CBGP: M4680 Mali, Gono 15u03N 02u47W x x Mal 20
CBGP: M4771 Mali, Gono 15u03N 02u47W x Mal 21
CBGP: M5649 Mali, Goubolabo 15u54N 03u59W x x Mal 26
CBGP: M4065 Mali, Makana 15u08N 09u26W x x Mal 2
MNHN: VV1999-076 Mali, Me´naka 15u55N 02u25E x x Mal 14
CBGP: M5367 Mali, Niono 14u17N 05u59W x x Mal 22
CBGP: KM1081 Mali, Ouatagouna 15u12N 00u42E x x Mal 28
CBGP: M5639 Mali, San 13u22N 04u56W x x Mal 24
CBGP: M4209 Mali, Sare Mama 14u53N 04u02W x x Mal 4
CBGP: M4934 Mali, Sare Mama 14u53N 04u02W x Mal 5
CBGP: M5682 Mali, Tanda 15u46N 04u38W x x Mal 27
MNHN: VV1999-049, VV1999-070 Mali, Tararabat 19u24N 01u14E x Mal 11,12 CBGP: M5265 Mali, Tiderme`ne 17u01N 02u07E x x Mal 7
CBGP: M5287 Mali, Tiderme`ne 17u01N 02u07E x Mal 8
CBGP: M4589 Mali, Tirna 15u41N 04u44W x x Mal 16
CBGP: M4619 Mali, Tirna 15u41N 04u44W x Mal 18
MNHN: VV1995-017 Mauritania, Chott Boul 16u37N 16u25W x x Mau 1 MNHN: VV1995-041 Mauritania, Chott Boul 16u37N 16u25W x Mau 2
CBGP: N3214 Niger, Agadez 16u58N 07u59E x Nig 4
Table 1. Cont.
Individuals and species Origin Lat. Long. cyt b Fib7 Labels
CBGP: N3143 Niger, Bosso 13u41N 13u18E x x Nig 21
CBGP: N4251 Niger, Boumba 12u25N 02u50E x x Nig 31
CBGP: N4211 Niger, Boumba 12u25N 02u50E x Nig 32
CBGP: N3266 Niger, Che´timari 13u10N 12u28E x x Nig 10 CBGP: N4078, N4092 Niger, Che´timari 13u10N 12u28E x Nig 12,13 CBGP: N4094, N4152 Niger, Che´timari 13u10N 12u28E x Nig 24,25 CBGP: N4096 Niger, Djirataoua 13u24N 07u08E x x Nig 16 CBGP: N4134 Niger, Djirataoua 13u24N 07u08E x Nig 17
CBGP: N4146 Niger, Gaya 11u53N 03u27E x x Nig 19
CBGP: N4147 Niger, Gaya 11u53N 03u27E x Nig 20
CBGP: N3267 Niger, Goure´ 14u03N 10u13E x x Nig 7
CBGP: N4135 Niger, Guidimouni 19u24N 09u30E x x Nig 18 CBGP: N3106, N3107 Niger, Guileyni 13u26N 02u42E x x Nig 1,2 CBGP: N4271 Niger, Karey Kopto 12u33N 02u38E x x Nig 33 CBGP: N4273 Niger, Karey Kopto 12u33N 02u38E x Nig 34 CBGP: N4093 Niger, Kojimairi 13u24N 11u05E x x Nig 14 CBGP: N4098, N4109, N4133, N4154, N4159 Niger, Kojimairi 13u24N 11u05E x Nig 15, 27–30 GenBank: AF004571, AF004570 Niger, Kollo 13u21N 02u17E x Nig 23,24
CBGP: N3124 Niger, N’Guigmi 14u15N 13u06E x x Nig 3
CBGP: N3144 Niger, Niamey 13u31N 02u05E x x Nig 22
CBGP: N4001 Niger, Tabelot 17u36N 08u56E x x Nig 9
CBGP: N3268 Niger, Tanout 14u57N 08u53E x x Nig 8
CBGP: M5295 Niger, Tiloa 15u09N 02u04E x x Nig 11
CBGP: N3219 Niger, Tondibia 13u34N 02u01E x x Nig 6
CBGP: KB2807, KB2816 Senegal, Darou-Wolof 14u00N 14u47W x Sen 23,24 CBGP: JMD441, JMD447 Senegal, Gouniang 14u50N 12u26W x Sen 1,2 CBGP: KB932, KB933 Senegal, Kaolack 14u10N 16u07W x Sen 17,18 CBGP: KB1243 Senegal, Lampsar Peuhl 16u05N 16u20W x x Sen 5 CBGP: KB1244 Senegal, Lampsar Peuhl 16u05N 16u20W x Sen 9 CBGP: KB924, KB925 Senegal, Lindiane 14u10N 16u09W x Sen 15,16 CBGP: KB3125, KB3126 Senegal, Mibess 15u25N 16u42W x Sen 25,28
CBGP: KB2407 Senegal, Ndya 14u34N 12u45W x x Sen 11
CBGP: KB2408 Senegal, Ndya 14u34N 12u45W x Sen 12
CBGP: KB1191 Senegal, Niaga 14u49N 17u16W x x Sen 10 CBGP: KB3143 Senegal, Pekh Tall 15u27N 16u24W x Sen 26 CBGP: KB3150 Senegal, Pekh Tall 15u27N 16u24W x x Sen 27 GenBank: AF004572 Senegal, Richard Toll 16u28N 15u45W x Sen 29 CBGP: KB2765, KB2766 Senegal, Sare´-Gayo 13u51N 13u58W x x Sen 21,22 CBGP: KB1437 Senegal, Savoigne 16u09N 16u18W x x Sen 6 CBGP: JMD645, JMD646 Senegal, Sinthiane Doude´ 15u25N 12u57W x Sen 3,4 CBGP: KB2755 Senegal, Sinthiou-Maleme 13u49N 13u55W x x Sen 19 CBGP: KB2758 Senegal, Sinthiou-Maleme 13u49N 13u55W x Sen 20 CBGP: KB2441 Senegal, Sinthiou-Doude´ 14u11N 12u45W x x Sen 13 CBGP: KB2442 Senegal, Sinthiou-Doude´ 14u11N 12u45W x Sen 14 CBGP: KB1335, KB1336 Senegal, Wouro-Aı¨b 16u28N 15u37W x Sen 7,8 GenBank: EF128062, 128063, 128064 Sudan, Dongola 19u00N 30u29E x Sud 5–7 GenBank: EF128067, EF128068, EF128069 Sudan, El Sabagola 17u34N 33u26E x Sud 3, 10–11 GenBank: EF128070, EF128071, EF128072; DM: 9106 Sudan, El Sabagola 17u34N 33u26E x Sud 12–15
Seddon et al. [46]. These PCR products were purified and then sequenced in both directions by Macrogen (Seoul, Korea). In total, our Fib7 dataset groups 67 sequences that represent 60 A. niloticus, two A. cf. niloticus from Kenya, four representatives of other Arvicanthis species as well as one representative of genus Mastomys, to be used as an outgroup (Table 1). As stated previously, all individuals sequenced for Fib7 were sequenced for cytb (except for the A. niloticus specimen labelled ‘Mal 299, and the representative
of genus Mastomys), thus allowing us to build a combined dataset of 1,871 nucleotides (nt) encompassing 171 individuals. Importantly, all 10 countries that are represented for A. niloticus or A. cf. niloticus individuals in our cytb dataset are also represented in our Fib7 dataset. Similarly, 57 out of the 72 localities sampled in the A. niloticus or A. cf. niloticus cytb dataset were also sampled for Fib7 (see Table 1), thus providing a very similar and fully overlapping geographic coverage for both genes. All the sequences generated Table 1. Cont.
Individuals and species Origin Lat. Long. cyt b Fib7 Labels
DM: 9103, 9108 Sudan, El Suki 13u19N 33u54E x x Sud 1,2 GenBank: EF128083, EF128084 Sudan, El Suki 13u19N 33u54E x Sud 26,27 GenBank: EF128073, EF128074, EF128075 Sudan, Khartoum 15u40N 32u35E x Sud 16–18 GenBank: EF128076, EF128077 Sudan, Khartoum 15u40N 32u35E x Sud 19,20 GenBank: EF128078, EF128079, EF128080 Sudan, Medani 14u23N 33u29E x Sud 21–23 GenBank: EF128081, EF128082 Sudan, Medani 14u23N 33u29E x Sud 24,25 GenBank: EF128065, EF128066 Sudan, Shandi 16u42N 33u29E x Sud 8,9 Arvicanthis cf. niloticus**
MNHN: VV1996-009, VV1996-010 Kenya, Masai Mara NP 01u49S 35u20E x x 1,2 Arvicanthis abyssinicus
GenBank: AF004567.1*** Ethiopia, Menagesha 09u03N 38u34E x 1 GenBank: AF004566.1*** Ethiopia, Sululta 09u11N 38u46E x 2 Arvicanthis neumanni
GenBank: AF004574**** Tanzania, Berega 06u11S 37u09E x 1 GenBank: AF004573**** Tanzania, Berega 06u11S 37u09E x 2 Arvicanthis ansorgei
CBGP: Leish NEG 024MS1 Burkina-Faso, Pissy 12u20N 01u35W x x 3 CBGP: M6068 Burkina-Faso, Toumbani 11u00N 00u58E x x 2
CBGP: M5619 Mali, Se´nie´na 10u50N 05u40W x x 1
Arvicanthis sp. (ANI-2)
GenBank: HM635839 Cameroon, Gamnaga 10u57N 14u03E x x ANI-2 1 GenBank: AF004584 CAR, Koumbala 09u14N 20u42E x ANI-2 2 Arvicanthis cf. rufinus
GenBank: AF004582 Benin, Lokossa 06u38N 01u43E x 1 GenBank: AF004583 Benin, Tanougou 10u49N 01u26E x 2 non-Arvicanthis species
Aethomys chrysophilus (GenBank: AJ604526.1) Tanzania x Desmomys harringtoni (GenBank: AF141206) Ethiopia x Golunda ellioti (GenBank: AM408338.1) India x Lemniscomys striatus (MNHN: ZM-2008-020) Benin x
Mastomys erythroleucus (CBGP: M4136) Chad x
Mylomys dybowskii (GenBank: AF141212.1) Ivory Coast x Pellomys fallax (GenBank: DQ022382.1) Tanzania x Otomys irroratus (GenBank: EU874434) South Africa x
Otomys sungae (GenBank: JF795993) ? x
Otomys tropicalis (GenBank: JF795995) ? x
Rhabdomys pumilio (GenBank: AF533116) South Africa x
‘‘CBGP’’, ‘‘DM’’ and ‘‘MNHN’’ stand for Centre de Biologie pour la Gestion des Populations (Montpellier, France), Durban Natural Science Museum (Durban, South Africa) and Museum National d’Histoire Naturelle (Paris, France), respectively. Individuals’ labels corresponding to Figures 1 to 3 are also provided.
*referred to as A. dembeensis in [29];
**most probably referable to A. somalicus (cf. text for details); ***referred to as A. cf. abyssinicus in [29];
****referred to as A. cf. somalicus in [29]. doi:10.1371/journal.pone.0077815.t001
in this study were deposited in GenBank (accession numbers KF478244 to KF478310 for the Fib7 and KF478311 to KF478426 for the cytb).
Phylogenetic and Dating Analyses
Bayesian inference (BI) was used to co-estimate phylogenetic relationships and divergence times using the BEAST v1.7.5 package [47]. BEAST uses Bayesian Markov Chain Monte Carlo (MCMC) procedures to approximate phylogenies and simulta-neously infer nodes ages. To infer the time-calibrated phylogeny, we used the Bayesian relaxed clock (BRC) approach [48] implemented in BEAST. This method accounts for rate variation across lineages and assumes that substitution rates are uncorrelat-ed across the tree (there is thus no a priori correlation between a lineage rate and that of its ancestor). To maximize the amount of available information, analyses were performed on the combined dataset, using specific sets of parameters for each gene [49]. Best-fit models of evolution for each gene were selected with jModelTest [50] using the Bayesian information criterion (BIC). For the molecular dating analyses, each gene was associated with a specific uncorrelated lognormal relaxed clock (ULRC) model. A coalescent model tree prior with a constant population size was also preferentially used to account for the fact that our trees mostly describe intra-specific relationships [51]. BEAST. xml files were also modified to implement the path-sampling (PS) procedure [52], which allows a better approximation of the marginal likelihood of runs [53]. In a complementary way, we carried out maximum likelihood (ML) analyses with the software RAxML v.7.0.8 [54] using default settings and 100 random-addition replicates. For the corresponding partitioned analyses, the same best-fit models of evolution (as in BI) were used. Clade support for ML was assessed with non-parametric bootstrap values (BV; 1,000 replicates were used).
Three distinct sets of calibration were used in this study. The first two sets rely on the oldest known fossil occurrence for the genus Arvicanthis [55]. This fossil (individual BPRP#76) is a relatively complete specimen found in Kenya, in the Lukeino formation, which was radiometrically dated at 5.9-5.7 million years ago (Ma; [55]). We used two distinct parametric distributions (exponential and lognormal) to set a minimum age of 5.7 Ma for the genus Arvicanthis (see [56], for more rationale on these settings). The corresponding 5.7 Ma minimum age constraint was enforced as follows: exponentialPrior mean = 5.0, offset = 5.444 (for the exponential distribution), and lognormalPrior mean = 1.0, stdev = 1.0, offset = 5.175 (for the lognormal distribution). For the third set of constraints we used the time-calibrated phylogeny of Lecompte et al. [42] to set a series of secondary calibrations for the nodes that are shared between our respective datasets. Though the use of secondary calibration is not advocated [56,57], we conducted these analyses for comparison purpose. The fact that our outgroup choice was based on the result of the study of Lecompte et al. [42] allowed us to identify six shared nodes that were used for secondary calibrations. To do so, we used normal parametric distributions to set minimum and maximum ages for the corresponding nodes. These constraints were enforced as follows: (i) most recent common ancestor (MRCA) of Arvicanthis and Aethomys, normalPrior mean = 6.9 stdev = 1.0; (ii) MRCA of Arvicanthis and Desmomys, normalPrior mean = 8.4 stdev = 1.0; (iii) MRCA of Arvicanthis and Lemniscomys, normalPrior mean = 4.8 stdev = 1.0; (iv) MRCA of Arvicanthis and Otomys, normalPrior mean = 11.0 stdev = 1.0; (v) MRCA of Desmomys and Rhabdomys, normalPrior mean = 5.1 stdev = 1.0; (vi) MRCA of Mylomys and Pelomys, normalPrior mean = 3.85 stdev = 1.0.
For each calibration set (‘exponential distribution’; ‘lognormal distribution’; ‘secondary calibrations’), two distinct runs were carried out, each one with 50 million generations, default priors and trees sampled every 5000th generation. After applying a conservative burn-in of 12.5 million generations for each run, convergence of runs was further assessed by examining the effective sample size (ESS) of parameters with Tracer available at www.tree.bio.ed.ac.uk/software/tracer/. The resulting log and tree files were then combined using LogCombiner. We then directly estimated both node support (posterior probabilities: PP) and node age (median age estimates and 95% higher posterior densities: 95% HPD) using TreeAnnotator. Only nodes with posterior probabilities (PP) $0.95 were considered strongly supported [58]. Bayes factor (BF; [59]) were then estimated using the log files of the three distinct calibration sets, using scripts detailed in Baele et al. [53]. The resulting time-calibrated trees (one per calibration set) were further modified under Mesquite v2.75 [60] by pruning the most basal outgroup taxa. For comparison purpose, additional runs (same settings for the MCMC) were also conducted for the cytb dataset (169 taxa; 1,113 nt) and the Fib7 dataset (67 taxa; 758 nt).
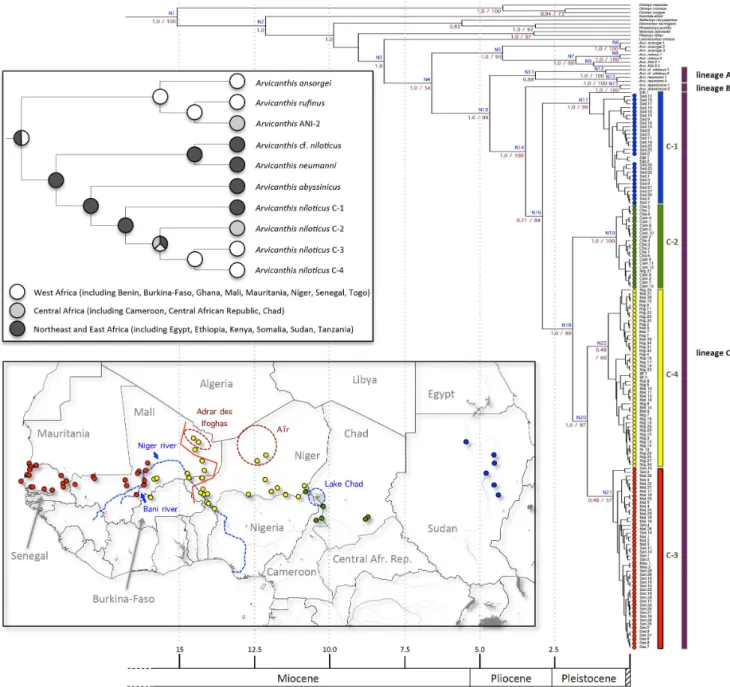
Additional phylogenetic-based analyses were also conducted to precise the geographic origin of the various Arvicanthis niloticus populations. To do so, we relied on the tree resulting from the analyses of the combined dataset. This tree was further pruned under Mesquite in order to include one specimen for each of the major lineages of A. niloticus, and one specimen for each other Arvicanthis species. Character optimizations were then performed to infer the ancestral areas of distribution. Three major areas were categorized for this analysis: (i) ‘West Africa’, which includes Benin, Burkina-Faso, Ghana, Mali, Niger, Senegal, Togo; (ii) ‘Central Africa’, which includes Cameroon, Central African Republic, Chad; and (iii) ‘North-East and East Africa’, which here includes Egypt, Ethiopia, Kenya, Somalia, Sudan, Tanzania. We then performed a single state parsimony optimization with Mesquite in order to identify the geographic origin of the MRCA of each A. niloticus phylogroups.
Genetic Differentiation, Genetic Diversity and Network Analyses
Analyses at the intraspecific level were performed on datasets that encompass only A. niloticus individuals (146 individuals for the cytb dataset and 60 individuals for the Fib7 one). The genetic differentiation between specimens belonging to the major phylogroups inferred by the phylogenetic analyses of the combined dataset was assessed for each gene using DnaSP v.5.1.0 [61]. However, the fact that DnaSP does not take into account missing data was problematic for the Fib7 dataset since it led to the exclusion of 113 nucleotide positions. Therefore, we analyzed a subset of the original dataset from which two sequences with a lot of missing data were removed [62]. In order to assess the level of genetic differentiation among the four phylogroups, we used three distinct statistics (FST, KST*, and Snn). The FST(fixation index) is a statistic that compares the level of diversity of randomly chosen alleles in a given population with those found in the entire geographical sample; the KST*is a statistic that takes into account the number of nucleotide differences between different haplotypes but does not give much weighting to large numbers of differences [63]; the nearest-neighbour statistic (Snn)measures how often the nearest neighbours within a matrix of sequences originate from the same population [64]. Because these three indices are known to be more or less sensitive to specific dataset features (such as low level of genetic diversity or low sample size), we used them in combination to ensure a more robust detection of genetic
differentiation [65]. For each statistics, a permutation test of 1,000 replicates was performed to assess the significance of the subdivision parameters. DnaSP was then used to infer the following parameters of genetic diversity: number of segregating sites (S), number of haplotypes (h), haplotypic (Hd) and nucleotide (p) diversities. We also performed neutrality tests for each gene using Tajima’s D [66] and Fu’s F statistics [67]. For the latter, values close to zero are expected for historically stable populations, whereas negative values would be indicative of recent population expansion.
Finally, networks analyses were conducted on the reduced cytb and fib7 datasets using the reduced median joining method [68], which has the ability to deal with missing data as well as to infer ancestral haplotypes. This method also performs well against, or outperforms other network approaches [69]. It was implemented using the software Network v.4.6.1.1 (http://www.fluxus-engineering.com), with e set to 0 in order to minimize alternative median networks.
Results
Phylogenetic Analyses
The BIC returned a general time reversible (GTR) model+C as best-fit model for each gene. For all analyses (combined dataset, or Fib7 and cytb gene alone), convergence was reached as indicated by the high ESS values (.200) recovered for all runs.
Analyses of the combined dataset yield a similar topology whatever the method used (BI or ML; Figure 1). Overall the corresponding trees are well supported, and most interspecific nodes are supported by PP$0.95 under BI or bootstrap values $70% under ML (Figure 1). Within the genus Arvicanthis, two main plurispecific clades emerge: specimens of A. ansorgei, A. cf. rufinus and ANI-2 cytotype (sensu [30]) form a well-supported monophyletic group (PP of 1.0/BV of 93%) whose sister assemblage contains (PP of 1.0/BV of 99%) representatives identified as A. neumanni, A. abyssinicus, A. cf. niloticus (two specimens from Kenya) and A. niloticus sensu stricto (i.e. all A. niloticus but the two latter Kenyan specimens) here below referred to as A. niloticus. Within the former group, A. ansorgei forms a first robust monophyletic lineage (PP of 1.0/BV of 100%), while the second one contains A. cf. rufinus and ANI-2 individuals (PP of 1.0/BV of 98%). Within the second main Arvicanthis assemblage, three lineages were clearly retrieved: lineage A (PP of 0.88/BV #50%) is basal and made of two A. cf. niloticus and two A. neumanni specimens from Kenya and Tanzania, respectively; then, lineage B (PP of 1.0/BV of 100%) is represented by the two A. abyssinicus specimens from Ethiopia; lineage C (PP of 0.71/BV of 84%) groups all A. niloticus (from Ethiopia, Sudan, Egypt throughout all other westward countries) specimens (Figure 1).
Central to the present study, lineage C splits into four phylogroups (C-1 to C-4), which also correspond to remarkably well-defined and exclusive geographic areas: (i) phylogroup C-1 (PP of 1.0/BV of 99%) contains all A. niloticus from Ethiopia, Sudan and Egypt; (ii) phylogroup C-2 (PP of 1.0/BV of 100%) groups all A. niloticus from Chad and Northern Cameroon, as well as one specimen from the Western bank of Lake Chad (Bosso) in Niger; (iii) A. niloticus individuals from West Mali to Senegal and Mauritania all gather in phylogroup C-3 (PP of 0.48/BV of 57%); (iv) specimens from phylogroup C-4 (PP of 0.48/BV of 60%) are all Nile grass rats originating from Niger, Burkina-Faso, North and East of Mali. In other words, in addition to a perfect match between genetic and geographic structure, a clear differentiation from East (phylogroup C-1 as sister to all remaining group) to West (phylogroups C-3 and C-4 as the most derived ones) is
suggested. The latter pattern is also supported by the result of the character optimization of ancestral areas (see Figure 1), which indicates that the MRCA of all A. niloticus phylogroups is of East African origin. On a side note, it is also worthy to notice that individuals from Adrar des Ifoghas massif (specimens ’Mali.10’, ‘Mali.11’, ‘Mali.12’ and ‘Mali.13’) appear genetically very close to each other, while those from Aı¨r massif (specimens ‘Nig.4’, ‘Nig.5’ and ‘Nig.9’) do not convincingly do so.
All the aforementioned lineages and phylogroups are recovered by the separate analysis of the cytb gene (see Figure 2), with moderate (PP of 0.58 for lineage C) to high supports (PP of 0.98 for lineage A, and PP of 1.0 for lineage B and phylogroups C-1, C-2, C-3 and C-4). By contrast, a less resolved and supported topology is inferred by the analysis of the Fib7 gene alone (see Figure 3), which only identifies two well-supported (PP of 1.0) clades within A. niloticus: the first one mixes together individuals that are found in previously mentioned phylogroups C-1 and C-2, while the second one gathers representatives from phylogroups C-3 and C-4. The two Kenyan representatives of A. cf. niloticus were found basal to all other A. niloticus.
Divergence Time Estimates
Regarding dating analyses, the ‘secondary calibrations’ set yields younger age estimates (Table 2). The latter is problematic since the age of the oldest known Arvicanthis fossil (5.7–5.9 Ma) significantly predates the median age resulting from the ‘secondary calibrations’ calibration set (4.71 Ma). The two other calibration sets recover very similar median ages, which never differ from more than 1 Ma when considering Arvicanthini lineages. Because the ‘exponential distribution’ calibration set is significantly favoured by the corresponding BFcomparison (Ln BF= 210881.60+11332.01 = 450.41), we chose to preferentially present the corresponding age estimates in Figure 1.
With respect to the age of Arvicanthini, a mid-Miocene origin was inferred with ages ranging from 11.29 Ma (95% HPD: 6.7– 19.3; ‘lognormal distribution’ calibration) to 12.13 Ma (95% HPD: 7.04–10.924; ‘exponential distribution’ calibration). A Late Miocene origin was recovered for the genus Arvicanthis with ages ranging from 6.52 Ma (95% HPD: 5.27–10.24; ‘lognormal distribution’ calibration) to 6.6 Ma (95% HPD: 5.44–11.41; ‘exponential distribution’ calibration). The lineage encompassing all A. niloticus specimens (lineage C) appeared in the Late Pleistocene approximately 2.72–2.92 Ma. Several major splits then occurred in the Pleistocene (1.85–1.92 Ma, 1.16–1.43 Ma), leading to A. niloticus phylogroups C-1 to C-4.
Genetic Differentiation, Genetic Diversity and Network Analyses
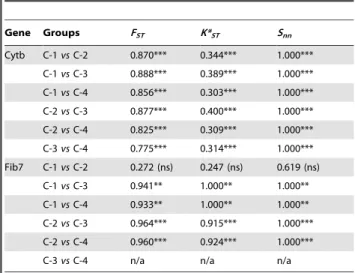
For the cytb gene, all statistics (FST, KST*, and Snn) recovered a significant level of genetic differentiation among the four major phylogroups (Table 3). By contrast, the level of genetic structure was lower for the Fib7 gene since no significant genetic structure was evidenced between C-1 and C-2, or between C-3 and C-4. For the latter, the statistics were not even computable because of the absence of genetic variation (when excluding gaps and positions with missing data) between the 50 sampled specimens of the two groups.
In contrast with the cytb gene (S = 182, h = 79, Hd = 0.985), genetic diversity was extremely low for the Fib7 gene (S = 9, h = 4, Hd = 0.253) (Table 4). For both genes, the highest levels of genetic diversity were found in the phylogroup C-1. Interestingly, this result was recovered despite the fact that the number of sampled individuals for phylogroup C-1 is lower than those of phylogroups C-3 and C-4 (and even C-2 when considering the Fib7 dataset).
The results of the neutrality tests for the two genes showed that A. niloticus populations were stable over time. We only find evidence for expansion of populations’ size for the phylogroup C-1 (both Tajima’s D and Fu’s F statistics) and in the phylogroup C-3 (Fu’s F statistics).
Network analyses recovered a relatively congruent pattern for both genes (Figure 2 and Figure 3), in which the haplotypes from East Africa (phylogroup C-1) are connected with haplotypes from
Central Africa (phylogroup C-2), which are further connected with haplotypes from West Africa (phylogroups C-3 and C-4), thus indicating a clear East to West pattern of colonization. Further-more, the cytb dataset suggests that the genetic pool that is now present in the eastern part of West Africa (phylogroup C-4) originated from the haplotypic population that currently lies in the western part of West Africa (phylogroup C-3).
Figure 1. Time-calibrated tree resulting from the partitioned Bayesian analysis of the combined dataset. Age estimates correspond to the results of the BRC analysis using the fossil constraint with an exponential distribution. Labels on nodes correspond to the nodes listed in Table 2. Posterior probabilities (left) and bootstrap values (right) are also indicated for major nodes (values below,0.50 are not figured). On the bottom left (lower panel), a map is included to figure the localities of almost all sampled Arvicanthis niloticus specimens (with the exception of the specimen from Ethiopia and the two specimens from Egypt). Additional information on mountain and hydrogeographic formations of interest is also provided. A red line is also used to figure the distribution limits of the two distinct A. niloticus cytotypes (ANI-1a and ANI-1b; see text for details). On the right side, the general origin of Arvicanthis niloticus specimens is represented using circles filled with colours corresponding to those used on the map. In addition, vertical sidebars highlight the three major lineages (A, B and C) and the four major clades within the lineage C (C-1, C-2, C-3 and C-4). On the bottom left again (upper panel), the simplified phylogenetic topology of Arvicanthis studied here is represented with corresponding geographic origin of extant lineages as well as of MRCA as inferred by the ancestral area optimization under Mesquite (see text for details).
Discussion
All Arvicanthis individuals cluster in a monophyletic clade, whose sister group is Lemniscomys striatus, in agreement with Lecompte et al. [42]. Within Arvicanthis, three distinct clades are retrieved. A
first one, that would be the sister group of all other Arvicanthis specimens studied here, comprises two subgroups of specimens: one includes individuals of A. ansorgei and the other contains individuals of A. cf. rufinus as well as those referred to as ANI-2. Such an association was already retrieved and discussed by Ducroz
Figure 2. Haplotype network and phylogenetic tree resulting from the analysis of the cytb dataset. The haplotype network reconstruction takes into account missing data and gap so the inferred number of haplotype I higher than the one presented in Table 4. Red values on nodes indicate the inferred number of mutation steps between haplotypes or ancestral haplotypes (symbolized by a red node). The absence of value means that the number of steps is inferior to 10. The phylogenetic tree corresponds to the results of a Bayesian inference analysis (see text for details); posterior probabilities (PP) are indicated for major nodes (values below,0.50 are not figured). On the right side, the general origin of Arvicanthis niloticus specimens is figured using circles filled with different colours that directly refer to the map presented in Figure 1.
et al. [29], Volobouev et al. [70], and Dobigny et al. [34], and it will thus not be commented further here.
A second clade comprises two specimens of A. neumanni and two A. cf. niloticus specimens from Kenya. The two specimens labelled A. neumanni (from Tanzania) are those studied under the name A. somalicus by Ducroz et al. [29] who found them to be characterized by a 2N = 54/NFa = 62 karyotype. Ducroz [27] further proposed that they correspond to A. neumanni, as acknowledged by Castiglia et al. [32] to distinguish them from the true A. somalicus that they considered as having a karyotype with 2N = 62 and NFa = 62–63. As in Ducroz et al. [29], these two A. neumanni specimens have a sister-group relationship with the A. niloticus/A. abyssinicus clade. Yet, they here share this position with two A. cf. niloticus from Kenya, that were also karyotyped by Ducroz [27] as 2N = 62/ NFa = 62. The clear distinctness of these two A. cf. niloticus from the remaining A. niloticus specimens on molecular grounds strongly suggests that another name should be given to them. The latter
may well be A. somalicus since their karyotypes seem to match quite well the one proposed by Baskevich & Lavrenchenko [71] for this species (for further comments, see [32]).
The third main clade is characterized by the two individuals of A. abyssinicus that lie in a basal position relative to all other Arvicanthis niloticus. This result, also found using a much smaller sample of A. niloticus specimens by Ducroz et al. [29], tends to consolidate the sister status of A. abyssinicus and A. niloticus. The two species are sympatric, but apparently not syntopic, in Ethiopia where the former is considered an endemic of the High Plateaus, whereas the latter would range at lower altitudes, west of the Rift Valley [24]. The remaining part of this clade corresponds to Arvicanthis niloticus, whose phylogeography is discussed in detail below, thanks to a large and wide-ranging sample.
It was previously shown that A. niloticus may display two distinct karyomorphs differing by an inversion: ANI-1a with 2N = 62/ NFa = 62 and ANI-1b with 2N = 62/NFa = 64 on the Eastern and
Figure 3. Haplotype network and phylogenetic tree resulting from the analysis of the Fib7 dataset. The haplotype network reconstruction takes into account missing data and gaps, so that the inferred number of haplotypes is higher than the one presented in Table 4. Red values on nodes indicate the inferred number of mutation steps between haplotypes or ancestral haplotypes (symbolized by a red node). The absence of value means that the number of step is equal to 1. The phylogenetic tree corresponds to the results of a Bayesian inference analysis (see text for details); posterior probabilities (PP) are indicated for major nodes (values below,0.50 are not figured). On the right side, the general origin of Arvicanthis niloticus specimens is figured using circles filled with different colours that directly refer to the map presented in Figure 1.
Western parts of the species range, respectively, with no geographic overlap ( [30]; see Fig. 1). Nevertheless, the two chromosomal lineages were also found paraphyletic on DNA grounds, and the taxonomic significance of this chromosomal Table 2. Bayesian relaxed clock age estimates (Ma) based on three distinct calibration sets (fossil constraint with an ‘exponential distribution’, fossil constraint with a ‘lognormal distribution’, ‘secondary calibrations’).
Node Ancestor of Clade of interest Fossil constr. (expon.) Fossil constr. (lognormal) Secondary calibrations Median 95% HPD Median 95% HPD Median 95% HPD
1 Otomys tropicalis - Arvi. niloticus Sen.7 15.08 7.87–30.00 13.87 7.52–25.02 10.78 9.02–12.60 2 Golunda ellioti - Arvi. niloticus Sen.7 Arvicanthini 12.13 7.04–22.06 11.29 6.70–19.30 9.03 7.19–11.14 3 Lemniscomys striatus - Arvi. niloticus Sen.7 8.19 5.68–14.04 7.83 5.67–12.70 5.60 4.65–7.56 4 Arvi. ansorgei 1 - Arvi. niloticus Sen.7 Arvicanthis spp. 6.60 5.44 –11.41 6.52 5.27–10.24 4.71 3.40–6.07 5 Arvi. ansorgei 1 - Arvi. rufinus 1 4.25 1.67–7.85 4.16 1.89–7.00 3.00 1.75–4.36 6 Arvi. ansorgei 1 - Arvi. ansorgei 3 0.33 0.03–0.43 0.27 0.05–0.72 0.21 0.06–0.47 7 Arvi. rufinus 1 - Arvi. ANI2-1 1.81 0.65–3.71 1.67 0.65–3.36 1.25 0.62–2.06 8 Arvi. rufinus 1 - Arvi. rufinus 2 0.34 0.06–0.96 0.31 0.06–0.80 0.23 0.06–0.54 9 Arvi. ANI-2 1 - Arvi. ANI-2 2 1.22 0.40–2.66 1.07 0.36–2.33 0.83 0.31–1.51 10 Arvi. cf. niloticus 1 - Arvi. niloticus Sen.7 4.67 2.46–8.30 4.37 2.42–7.16 3.09 2.09–4.22 11 Arvi. cf. niloticus 1 - Arvi. neumanni 2 lineage A 3.16 1.20–5.89 2.83 1.15–5.11 2.03 1.04–3.20 12 Arvi. cf. niloticus 1 - Arvi. cf. niloticus 2 0.82 0.15–2.11 0.62 0.11–1.56 0.48 0.12–1.06 13 Arvi. neumanni 1 - Arvi. neumanni 2 0.44 0.07–1.05 0.40 0.06–1.13 0.31 0.06–0.73 14 Arvi. abyssinicus 1 - Arvi. niloticus Sen.7 3.48 1.67–6.46 3.20 1.59–5.46 2.33 1.49–3.34 15 Arvi. abyssinicus 1 - Arvi. abyssinicus 2 lineage B 0.33 0.05–1.05 0.30 0.05–0.89 0.22 0.04–0.59 16 Arvi. niloticus Eth.1 - Arvi. niloticus Sen.7 lineage C 2.92 1.42–5.42 2.72 1.59–5.46 1.97 1.25–2.82 17 Arvi. niloticus Eth.1 - Arvi. niloticus Sud.7 phylogroup C-1 1.35 0.50–2.72 1.25 0.56–2.41 0.92 0.50–1.50 18 Arvi. niloticus Cha.5 - Arvi. niloticus Sen.7 1.92 0.93–3.71 1.85 0.86–3.29 1.35 0.84–2.01 19 Arvi. niloticus Cha.5 - Arvi. niloticus Cam.13 phylogroup C-2 0.46 0.16–1.01 0.47 0.17–0.64 0.33 0.14–0.63 20 Arvi. niloticus Nig.30 - Arvi. niloticus Sen.7 1.43 0.66–2.76 1.16 0.54–2.12 0.88 0.55–1.38 21 Arvi. niloticus Sen.3 - Arvi. niloticus Sen.7 phylogroup C-3 0.57 0.35–1.49 0.49 0.20–0.97 0.34 0.19–0.57 22 Arvi. niloticus Nig.24 - Arvi. niloticus Nig.30 phylogroup C-4 0.73 0.22–1.23 0.63 0.31–1.19 0.45 0.27–0.71
The median age and 95% HPD of major nodes are reported for each calibration set. Clades of interest are highlighted using bold characters. doi:10.1371/journal.pone.0077815.t002
Table 3. Parameters describing genetic differentiation among phylogroups. Gene Groups FST K*ST Snn Cytb C-1 vs C-2 0.870*** 0.344*** 1.000*** C-1 vs C-3 0.888*** 0.389*** 1.000*** C-1 vs C-4 0.856*** 0.303*** 1.000*** C-2 vs C-3 0.877*** 0.400*** 1.000*** C-2 vs C-4 0.825*** 0.309*** 1.000*** C-3 vs C-4 0.775*** 0.314*** 1.000*** Fib7 C-1 vs C-2 0.272 (ns) 0.247 (ns) 0.619 (ns) C-1 vs C-3 0.941** 1.000** 1.000** C-1 vs C-4 0.933** 1.000** 1.000** C-2 vs C-3 0.964*** 0.915*** 1.000*** C-2 vs C-4 0.960*** 0.924*** 1.000*** C-3 vs C-4 n/a n/a n/a
The following abbreviations were used: *significant with P,0.05;
**significant with P,0.01;
***significant with P,0.001. ‘‘n/a’’ indicates that it was impossible to compute the corresponding test statistic because of the lack of relevant data. doi:10.1371/journal.pone.0077815.t003
Table 4. Parameters describing genetic diversity and genetic differentiation. Gene phylogroup (n) S h Hd p D F Cytb (All) (146) 182 79 0.985 0.0465 0.078 (ns) 28.008 (ns) C-1 (30) 83 24 0.983 0.0151 21.897* 211.536* C-2 (22) 16 9 0.870 0.0055 0.318 (ns) 20.695 (ns) C-3 (47) 32 24 0.946 0.0043 21.713 (ns) 214.579* C-4 (47) 57 22 0.946 0.0107 20.863 (ns) 22.781 (ns) Fib7 (All) (58) 9 4 0.253 0.0026 20.162 (ns) 3.101 (ns) C-1 (2) 1 2 1.000 0.0014 n/a n/a C-2 (6) 1 2 0.600 0.0008 1.445 (ns) 0.795 (ns) C-3 (24) 0 1 0.000 0.0000 n/a n/a C-4 (26) 0 1 0.000 0.0000 n/a n/a
The following abbreviations were used: number of sequences per phylogroup (n); number of polymorphic sites (S); number of haplotypes (h); haplotypic diversity (Hd); nucleotide diversity (p); Tajima’s D statistic (D); Fu’s F statistic (F). doi:10.1371/journal.pone.0077815.t004
mutation has already been questioned [30]. Since then, reasonably large series of animals were karyotyped on the Eastern part of A. niloticus’ range (Sudan: 33; Northern Cameroon: 34) and, accordingly, they were found with the ANI-1a karyotype. Moreover, the geographic distributions of ANI-1a and ANI-1b (see Fig. 7 in [30]) resemble that of the genetic clades retrieved here, with C-3 range (this study) widely overlapping ANI-1b’s one [30]. However, this geographic match is imperfect since C-3 does not extend beyond the Bani River, while ANI-1b reaches the Adrar des Ifoghas massif (Northern Mali) and South-Western Niger (i.e., Anderamboukane). More precisely, several localities were included in both the cytogenetic and the molecular studies (e.g., Menaka, Ouatagouna and Tararabat, all in North-Eastern Mali) and provided animals with the ANI-1b karyotype but belonging to the C-4 (and not C-3) mtDNA clade. In addition, the two cytotypes were found sympatric in Sare Mama (Central Mali; Granjon, unpubl. data), and one heterozygous individual (2N = 62/NFa = 63) was trapped in Gaya (Southern Niger; Dobigny, unpubl. data). Taking into account the strict geographic exclusion of the C-3/C-4 mtDNA clades observed here, such an imperfect geographic match between chromosomal and molecular patterns may be due to asymmetric introgression between the nuclear (here the karyotype) and mitochondrial genomes following secondary contact of clades C-3 and C-4. Unfortunately, the resolution power offered by the Fib7 gene is too weak here to test for this hypothesis. Karyotypic vs. mtDNA profiles mismatch could also be due to incomplete lineage sorting of a long-standing inversion polymorphism, as already observed in another murid rodent genus, namely Mastomys, within the same regions [16]. If true, this would imply that this inversion polymorphism has been segregating in A. niloticus since at least the C-3/C-4 divergence, ,1.16–1.43 Ma ago, hence is hemiplasic [72]. These two explanations (introgression and incomplete lineage sorting) are not mutually exclusive. Moreover, the detection of animals with heterozygous karyotypes (i.e., ANI-1a6ANI-1b) within the range of both C-3 and C-4 mtDNA clades suggest at least persisting nuclear gene flows between these two lineages.
The present work is the first one to include both mitochondrial and nuclear DNA sequences for phylogeographic purposes in African rodents. These two genes led to rather congruent patterns, although the nuclear dataset was much less phylogenetically informative. This is expected since nuclear DNA in coding regions usually evolves under slower mutation rates. Nevertheless, the use of Fib7 appeared informative here, and insures the absence of no sex-associated bias (such as male-biased dispersal) in our study.
The first striking result that was obtained here is that the TMRCA for all A. niloticus lineages (2.72–2.92 Ma) is markedly older than those of all nine other African rodent species that were investigated so far (all between 1.25 Ma in Acomys chudeaui and 0.31 Ma in Praomys tullbergi; see references above). This may be attributable to possible biases in previous dating analyses, which likely result from the overuse of questionable secondary calibra-tions such as the classical Mus/Rattus split at 12 Ma [73], in association with the use of methods that do not always account for rate variation across lineages. It could also be due to the existence of non-sampled lineages in the other species (for instance due to either true sampling bias or basal lineages’ extinction), or to a higher mutation rate in the Arvicanthis mitochondrial genome. Yet, geographic coverage appears really comparable in most investi-gations, with several of the previous studies also considering numerous localities all along from Western to Eastern Africa (e.g., [13,15]). In addition, mtDNA-based analyses of higher-systematic levels within murids never detected any atypical molecular features or particularly long branches in Arvicanthis (e.g., [41–42,44,74]). As
a consequence, and waiting for further proper comparisons between species, we suggest that A. niloticus can reasonably be considered as a truly rather ‘old’ species, already following its own trajectory with a first major split ,2 Ma ago. Our results are significantly older than those inferred by Abdel Rahman and colleagues [33]. While taxonomic and geographic coverage as well as calibration and inference methods are quite different in both studies, thus making a proper comparison difficult, such a discrepancy is probably due to their use of a younger Arvicanthis fossil supposed to be 5-4 Myr old [33], whereas we relied on a 5.9-5.7 Myr old one [53]. Interestingly, our dates fit perfectly well with one of the major faunal turnover that was associated with grasslands expansion and increased adaptation to open habitats (2-1.8 Ma; [75]).
Furthermore, there is little doubt from our results that A. niloticus centre of origin is Eastern Africa. Indeed, the lineages that are the most closely related to unambiguously identified A. niloticus phylogroups (i.e. C-1 to C-4) all originate from this region (Table 1 and Fig. 1): A. abyssinicus (Ethiopia), A. somalicus (represented here by the two ‘A. cf. niloticus’ specimens from Kenya; see above) and A. neumanni (Tanzania). The corresponding character optimization of ancestral areas also supports this hypothesis (Fig. 1). At some point, it is also the case of the results of the genetic diversity analyses, which recovers a higher level of genetic diversity for the phylogroup C-1. Thanks to the results of the network analyses, we can also infer a more precise pattern for A. niloticus phylogroups. Overall, there is a clear East to West differentiation of populations, with Egyptian and Sudanese individuals (phylogroup C-1) being connected to Chadian or Northern Cameroonese (phylogroup C-2) populations. Unfortu-nately, a wide sampling gap exists between Sudanese (phylogroup C-1) and Chadian (phylogroups C-2) samples which precludes any precise localization of the contact zone between these two lineages. Surprisingly, the clade from Central Africa (phylogroup C-2) is genetically more related to a lineage that is not in direct contact (phylogroup C-3), thus suggesting that the ancestors of these lineages were likely isolated during a past episode. After this episode, the eastern part of West Africa was recolonized by another population (phylogroup C-4), which is in contact with phylogroup C-3 in Central Mali (more precisely along the Eastern side of the Niger River valley) and in contact with phylogroup C-2 in the Lake Chad surroundings.
As already suggested for many other rodent as well as non-rodent African organisms (see below, and Table S1), such a pattern, which is referable to phylogeographic category I of Avise [76], strongly suggests that extant genetic structure in A. niloticus results from the divergence of allopatric populations, either through ecological local adaptation, through vicariance (i.e. on each side of persisting geographic barriers) or through isolation in refuges and subsequent dispersal until secondary contact. West African steppes and savannas represent a rather homogenous habitat from Senegal to the Red Sea. This is why the East-West differentiation of A. niloticus lineages can hardly being accounted for by ecology-driven local adaptive processes. Furthermore, the numerous individuals that were trapped in very close localities but that yet belong to different genetic clades (e.g., in Central Mali and around Lake Chad) poorly support the local adaptation hypothesis. In the same manner, although putative geographic barriers that currently delimit A. niloticus intraspecific clades (Niger River, Lake Chad basin) were identified, vicariance appears as an inaccurate explanation here since no admixture at all was detected in our dataset. Indeed, this would imply that propagules crossed each of those barriers only ‘once’ and then remained reproductively isolated for hundreds thousand years, something that sounds highly improbable.
On the contrary, the refuge theory [77] fits well to the phylogeographic pattern observed in the Nile grass rats: lineages’ splits all occurred during the Pleistocene which is characterised by deep climatic variations that induced extensive modifications of the open grasslands habitat range in Sub-Saharan Africa. Indeed, some 3 million years ago, the African climate started to get generally cooler and drier, along with successive arid-pluvial cycles, more or less following glacial-interglacial ones at higher latitudes [78–81]. Whatever sudden [78,79] or progressive [80], these recurrent aridification events have led to cyclic contractions of the moistest habitats (i.e., riverine and tropical forests, swampy areas), which were reduced to refugial patches in several instances during the Plio-Pleistocene surrounded by savannah-forest mosaic landscapes [82]. In parallel, arid phases induced wide-scale expansion of more xeric and open habitats. These climatic oscillations translated into deep modifications of all major biomes distribution ([79–81,83–85]; among many others). In particular, C4 grasses, which are considered as valuable biomarkers of open grassland habitats, emerged during the Upper Miocene but became a major component of African biomes only from the Plio-Pleistocene [86]. Recurrent phases of grassland expansion following Pleistocene climatic cycles were accompanied by major turnovers of mammalian faunas towards more numerous and more abundant open habitat-adapted species [85]. Conversely, phases of savannah fragmentation have triggered intra- and inter-specific diversification ( [10], and references below). These variations in grassland habitats of the Sahelian region during the Pleistocene have probably had major consequences on A. niloticus evolution since this species is highly specialized in this habitat type: its diet is mainly herbivorous, and it also forages along runways through matted grass around its nests which are mainly made of intermingled blades of grass themselves [25,87].
The refuge theory is also strongly supported by an increasing number of studies dealing with other Sub-Saharan rodent species (see below as well as Table S1), and where geographic distributions perfectly or almost perfectly match with genetic assemblages. All these studies similarly point towards isolation and genetic differentiation within refuges during unfavourable periods, with subsequent dispersion phases during favourable ones. Secondary contacts then tend to stabilize around strict (or even partial) geographic barriers that stop (or slow down) dispersal and gene flow –the so-called suture zones sensu Hewitt [88]. Of course, the nature of refuges, favourable/unfavourable periods and/or barriers depend on species-specific characteristics.
For instance, the Sahelo-Saharan spiny mouse Acomys chudeaui was most probably restricted to rocky areas that were surrounded by sand deserts during arid episodes, but may have dispersed through steppe-like environments during less arid periods [18]. The humid habitat-adapted Mastomys huberti underwent isolation around water-body relics during arid phases, while it colonized hydrographic basins of Senegal, Mali and Guinea during humid ones [19]. As far as forest-dwelling rodent species are concerned, they are expected to be trapped in forest relic patches during arid episodes but to extend during forest expansions associated with humid periods (e.g., Praomys tullbergi and Praomys rostratus: [21]; Praomys misonnei: [22,23]). Similarly, populations of open tree savannah species would diverge allopatrically during moist episodes, when fragmented throughout extended savannah-forest mosaic landscapes (e.g., Praomys daltoni: [14]). On the contrary, species from the drier scrub savannah and steppes are thought to be isolated when surrounded by forests during the moistest phases, and then to disperse widely with expanding open grasslands (Mastomys erythroleucus: [15]; Lemniscomys striatus: [13]). A. niloticus is to be considered as belonging to the latter category.
Geographic barriers to dispersal were also identified in most of African rodent phylogeographic investigations. Once again, many similarities appear between species-specific case studies. The tectonic complex of the Rift Valley was identified as a contact zone between parapatric phylogroups in L. striatus [13] and Mastomys natalensis [17]. Similarly, the relationships between some hydrographic features and genetic structure have been document-ed in several Sub-Saharan rodent species (e.g., Taterillus spp.: [89]; M. erythroleucus: [15,16]; L. striatus: [13]; P. tullbergi: [21]; P. misonnei: [22,23]; P. daltoni: [14]). In particular, it is striking to see how the same rivers and/or lakes have been pointed out as putative barriers in several taxa. In regards to the present study, this is notably the case for the Niger River valley that tends to separate clades C-3 and C-4 of A. niloticus, as well as several parapatric clades within (L. striatus: [13]; M. erythroleucus: [15,16]; P. daltoni: [14]) and between (Taterillus spp.: [89]) other unrelated rodent species. In the same manner, Lake Chad and its surroundings coincide with the contact zone between A. niloticus clades C-2 and C-3, while this area also signs genetic hiatus in Mastomys erythroleucus [15,16], Gerbillus nigeriae [90] and Taterillus spp. [89]. Besides, it has already been suggested that the latter region constitutes a ‘phylogeographic crossroad’, i.e. a centre of diversification where faunas may have diversified following the recurrent Plio-Pleistocene cycles of transgression/regression of the Palaeolake Chad [34,91].
So, in essence, ancestral A. niloticus populations would have diverged allopatrically during humid periods within at least four different Pleistocene refuges of open habitat. They would have dispersed during more arid ones until secondary contacts around geographic barriers such as the Niger River and the Lake Chad basins. The precise timing of isolation within Pleistocene refuges and of dispersal outside these refuges is not feasible here since molecular inferences of dates for such events are associated with confidence intervals that are usually of the same magnitude -when not larger- than Pleistocene climatic cycles themselves, thus precluding any robust conclusion. Also, the putative existence of a third barrier eastwards will require further sampling in Eastern Chad and Sudan in order to identify the precise geographic range of clades C-1 and C-2.
Finally, although we did not attempt to investigate formally sub-structure within each clade, we clearly retrieve a well-supported group of individuals that all originate from Adrar des Ifoghas in Mali (4 specimens from 2 different localities). No such signal could be obtained for individuals from Aı¨r in Niger (3 specimens from 2 different localities), thus supporting a previous hypothesis [92,93] that the Malian Adrar may represent a more isolated Sahelian refuge within the Sahara desert than the Aı¨r.
Interestingly, the picture drawn from studies on rodents often resembles those obtained on other mammals that we are aware of: refuges and allopatry during successive climatic cycles in the past were advocated to explain the differentiation of genetic lineages in cercopithecine monkeys (e.g., [94,95]), baboons [96], hyenas [97], wild dog [98], common warthog [99], giraffe [100], buffalo [101] and many large antelopes like topi, hartebeest [102,103], impala, kudu [104], waterbuck [105], kob [106], African bushbuck [107], common eland [108] and roan [109]. Similar conclusions were also reached in plants (e.g., shea tree: [110]; giant lobelia: [111]; coffee tree: [112]), insects (e.g., maize stalk borer: [113]), reptiles (e.g., puff adder: [114]; Southern rock agama: [115]) and birds (e.g., starred robin: [116]; ostrich: [117]). Zoogeographic barriers to dispersal have also been pointed out in several species, including the Rift Valley (e.g., lion: [118]; giraffe: [100]; wildebeest: [102]; waterbuck: [105]; bushbuck: [107]; maize stalk borer: [113]; giant lobelia: [111]) and great rivers (e.g., [95]).
As a whole, this reaches what was inferred for other continents, especially the well-studied Europe and North America [119–121]. Sub-Saharan Africa was once claimed to be understudied [119], but data have accumulated during the last decade (reviewed in [10], and references hereabove). Among studies that have concerned ungulates, a clear sampling bias towards Eastern and Southern Africa is obvious. West African megafauna’s phyloge-ography remains very poorly documented and this part of the continent is usually dramatically absent from most datasets: Lorenzen and colleagues’ recent review [10] clearly illustrates such a gap of knowledge, with several highly differentiated ungulate lineages west of the Rift Valley (see their Figure 3) that, unfortunately, are documented through extremely reduced num-ber of localities (but see [101], for a slightly higher numnum-ber of sampling sites in buffaloes). This emphasizes the importance of studies conducted on rodents that, in the contrary, have mainly focused on West and Central African deserts, grasslands and forests. In particular, the present study adds to the three other available ones that are typical of open grasslands in West and Central Africa, namely Mastomys natalensis [17], M. erythroleucus [15] and Lemniscomys striatus [13]. Together, these latter works allow us to draw an integrative picture of West and Central African open habitats history during the Pleistocene, something that could not be reached with ungulates models. In particular, one refuge was hypothesised in West Africa (i.e., between Senegal and the Rift Valley) on the basis of large mammals data [10], while at least three and potentially four major ones can be speculated from patterns obtained in these four rodent species: one most probably westward of the Niger River, one somewhere between the Niger River and the Lake Chad, and one or two between the Lake Chad
and the Nile River. Nevertheless, the precise locations of these Pleistocene refuges for open habitat species are still to be precisely assessed.
Supporting Information
Table S1 Summary of previous phylogeographic studies
conducted on Sub-Saharan African rodents. The species, their preferred habitat, the molecular marker used, the sample size, the methods for date inference, the major evolutionary events as well as putative corresponding geographic aspects are indicated. References can be found in the main text.
(DOCX)
Acknowledgments
We would like to thank the associate editor Dr. Roscoe Stanyon and four anonymous reviewers for their constructive comments on the present manuscript. We are grateful to Drs C. Brouat and F.L. Condamine for useful advices on a preliminary version of the manuscript. We also thank the numerous collectors and providers of samples that helped us with the sampling. Some of the molecular data used in this work were produced through technical facilities of the ‘‘Laboratoire d’Excellence - Centre Me´diterrane´en de l’Environnement et de la Biodiversite´’’ (LabEx -CeMEB), Montpellier, France.
Author Contributions
Conceived and designed the experiments: GD CT PG. Performed the experiments: GD CT PG. Analyzed the data: GD GJK. Contributed reagents/materials/analysis tools: GD CT PG KB JMD LG. Wrote the paper: GD CT JMD LG GJK.
References
1. Parmesan C (2006) Ecological and evolutionary response to recent climate change. Ann Rev Ecol Evol Syst 37: 637–669.
2. Willis KJ, Bhagwat SA (2009) Biodiversity and climate change. Science 326: 806–807.
3. Pereira HM, Leadley PW, Proenca V, Alkemade R, Scharlemann JPW, et al. (2010) Scenarios for global biodiversity in the 21st century. Science 330: 1496– 1501.
4. Dawson TP, Jackson ST, House JI, Prentice IC, Mace GM (2011) Beyond predictions: biodiversity conservation in a changing climate. Science 332: 53– 58.
5. McMahon SM, Harrison SP, Armbruster WS, Bartlein PJ, Beale CM, et al. (2011) Improving assessment and modelling of climate change impacts on global terrestrial biodiversity. Trends Ecol Evol 26: 249–259.
6. Bellard C, Bertelsmeier C, Leadley P, Thuiller W, Courchamp F (2012) Impacts of climate change on the future of biodiversity. Ecol Lett 15: 365–377. 7. Avise JC (1998) The history and purview of phylogeography: a personal
reflection. Mol Ecol 7: 371–379.
8. Pease KM, Freedman AH, Pollinger JP, McCormack JE, Buermann W, et al. (2009) Landscape genetics of California mule deer (Odocoileus hemionus): the roles of ecological and historical factors in generating differentiation. Mol Ecol 18: 1848–1862.
9. Beaty GE, Provan J (2011) Comparative phylogeography of two related plant species with overlapping ranges in Europe, and the potential effects of climate change on their intraspecific genetic diversity. BMC Evol Biol 11: 29. 10. Lorenzen ED, Heller R, Siegismund HR (2012) Comparative phylogeography
of African savannah ungulates. Mol Ecol 21: 3656–3670.
11. Poelchau MF, Hamrick JL (2013) Comparative phylogeography of three common Neotropical tree species. J Biogeog 40: 618–631.
12. Ben Faleh A, Granjon L, Tatard C, Duplantier JM, Dobigny G, et al. (2012) Phylogeography of two cryptic species of African desert jerboas (Dipodidae: Jaculus). Biol J Linnean Soc 107: 27–38.
13. Nicolas V, Mboumba JF, Verheyen E, Denys C, Lecompte E, et al. (2008b) Phylogeographic structure and regional history of Lemniscomys striatus (Rodentia, Muridae) in tropical Africa. J Biogeog 35: 2074–2089.
14. Bryja J, Granjon L, Dobigny G, Patzenhauerova H, Konecny A, et al. (2010) Plio-Pleistocene history of West African Sudanian savanna and the phyloge-ography of the Praomys daltoni complex (Rodentia): the environment/ geography/genetic interplay. Mol Ecol 19: 4783–4799.
15. Brouat C, Tatard D, Baˆ K, Cosson JF, Dobigny G, et al. (2009) Phylogeography of the Guinea multimammate mouse (Mastomys erythroleucus) : a case study for Sahelian species in West Africa. J Biogeog 36: 2237–2250.
16. Dobigny G, Catalan J, Gauthier P, O’Brien PCM, Brouat C, et al. (2010). Geographic patterns of inversion polymorphisms in a wild African rodent, Mastomys erythroleucus. Heredity 104: 378–386.
17. Colangelo P, Verheyen E, Leirs H, Tatard C, Denys C, et al. (2012) A mitochondrial phylogeographic scenario for the most widespread African rodent, Mastomys natalensis. Biol J Linnean Soc 108: 901–916.
18. Nicolas V, Granjon L, Duplantier JM, Cruaud C, Dobigny G (2009) Phylogeography of spiny mice (genus Acomys, Rodentia: Muridae) from the south-Western margin of the Sahara with taxonomic implications. Biol J Linnean Soc 98: 29–46.
19. Mouline K, Granjon L, Galan M, Tatard C, Abdoullaye D, et al. (2008) Phylogeography of a Sahelian rodent species Mastomys huberti: a Plio-Pleistocene story of emergence and colonization of humid habitats. Mol Ecol 17: 1036– 1053.
20. Mboumba JF, Deleporte P, Colyn M, Nicolas V (2011) Phylogeography of Mus (Nannomys) minutoides (Rodentia, Muridae) in West Central African savannas: singular vicariance in neighbouring populations. J Zool Syst Evol Res 49: 77– 85.
21. Nicolas V, Bryja J, Akpatou B, Konecny A, Lecompte E, et al. (2008a) Comparative phylogeography of two sibling species of forest-dwelling rodent (Praomys rostratus and P. tullbergi) in West Africa: different reactions to past fragmentation. Mol Ecol 17: 5118–5134.
22. Nicolas V, Missoup AD, Denys C, Kerbis Peterhans J, Katuala P, et al. (2011) The roles of rivers and Pleistocene refugia in shaping genetic diversity in Praomys misonnei in tropical Africa. J Biogeog 38: 191–207.
23. Nicolas V, Missoup AD, Colyn M, Cruaud C, Denys C (2012) West-Central African Pleistocene lowland forest evolution revealed by the phylogeography of Misonne’s soft-furred mouse. African Zool 47: 100–112.
24. Musser GG, Carleton MD (2005) Arvicanthis. In: Wilson DE, Reeder DAM, editors. Mammals of the World: a taxonomic and geographic reference, 3rd
edition, volume 2. Baltimore, USA: The Johns Hopkins University Press. pp. 1285–1292.
25. Granjon L, Duplantier JM (2009) Les rongeurs de l’Afrique sahe´lo-soudanienne. Marseille, France : Editions IRD, Publications Scientifiques du MNHN. 215 p.
26. Granjon L, Duplantier JM, Catalan J, Britton-Davidian J (1992) Karyotypic data on rodents from Senegal. Israel J Zool 38: 263–276.
27. Ducroz JF (1998) Contribution des approches cytoge´ne´tique et mole´culaire a` l’e´tude syste´matique et e´volutive des genres de rongeurs Murinae de la division « Arvicanthis ». PhD thesis, Muse´um National d’Histoire Naturelle, Paris, France. 250 p.