HAL Id: hal-02148415
https://hal-univ-perp.archives-ouvertes.fr/hal-02148415
Submitted on 30 Nov 2020HAL is a multi-disciplinary open access archive for the deposit and dissemination of sci-entific research documents, whether they are pub-lished or not. The documents may come from teaching and research institutions in France or abroad, or from public or private research centers.
L’archive ouverte pluridisciplinaire HAL, est destinée au dépôt et à la diffusion de documents scientifiques de niveau recherche, publiés ou non, émanant des établissements d’enseignement et de recherche français ou étrangers, des laboratoires publics ou privés.
Modeling competition, niche, and coexistence between
an invasive and a native species in a two-species
metapopulation
Maxime Dubart, Jelena Pantel, Jean-pierre Pointier, Philippe Jarne, Patrice
David
To cite this version:
Maxime Dubart, Jelena Pantel, Jean-pierre Pointier, Philippe Jarne, Patrice David. Modeling compe-tition, niche, and coexistence between an invasive and a native species in a two-species metapopulation. Ecology, Ecological Society of America, 2019, 100 (6), �10.1002/ecy.2700�. �hal-02148415�
1
Modelling competition, niche and coexistence between an invasive and a native species 1
in a two-species metapopulation 2
3
MAXIME DUBART1,4,JELENA H.PANTEL1,2,JEAN-PIERRE POINTIER3,PHILIPPE JARNE1 AND
4
PATRICE DAVID1
5 6
1 CEFE UMR 5175, CNRS - Université de Montpellier - Université Paul-Valéry Montpellier –
7
IRD - EPHE, 1919 route de Mende, 34293 Montpellier cedex 5, France 8
2 Department of Biology, The College of William and Mary, P.O. Box 8795, Williamsburg,
9
Virginia, United States of America 10
3 CRIOBE, USR 3278 CNRS–EPHE, Université de Perpignan, 66880 Perpignan cedex, France
11
4 Corresponding author: maxime.dubart@cefe.cnrs.fr
12 13
Running Head: Coexistence of snail species 14
4 figures, 2 tables, 2 online appendices
15 16
2
Abstract
17
Modelling the dynamics of competition and coexistence between species is crucial to predict
18
long-term impacts of invasive species on their native congeners. However, natural
19
environments are often fragmented and variable in time and space. In such contexts regional
20
coexistence depends on complex interactions between competition, niche differentiation and
21
stochastic colonization-extinction dynamics. Quantifying all these processes at landscape scale
22
has always been a challenge for ecologists. We propose a new statistical framework to evaluate
23
metapopulation parameters (colonization and extinction) in a two-species system and how they
24
respond to environmental variables and interspecific competition. It requires spatial surveys
25
repeated in time, but does not assume demographic equilibrium. We apply this model to a
long-26
term survey of two snails inhabiting a network of freshwater habitats in the West Indies. We
27
find evidence of reciprocal competition affecting colonization or extinction rates, modulated by
28
species-specific sensitivity to environmental variables. Simulations using model estimates
29
allow us to predict species dynamics and explore the role of various coexistence mechanisms
30
described by metacommunity theory in our system. The two species are predicted to stably
31
coexist, because niche partitioning, source-sink dynamics and interspecific differences in
32
extinction-colonization parameters all contribute to reduce the negative impacts of competition.
33
However, none of these mechanisms is individually essential. Regional coexistence is primarily
34
facilitated by transient co-occurrence of the two species within habitat patches, a possibility
35
generally not considered in theoretical metacommunity models. Our framework is general and
36
could be extended to guilds of several competing species.
37 38
Key Words: metacommunity, competition, environmental variability, extinction / colonization, 39
Physa acuta, Aplexa marmorata, freshwater snails 40
3 INTRODUCTION
42
Species coexistence is a long standing issue in community ecology (e.g., Gause 1934). A
43
critical question is why so many species coexist, particularly when they belong to the same
44
trophic level (Hutchinson 1959). Indeed, when two or more species live on the same resource,
45
competition can lead to the exclusion of the less competitive one (the competitive exclusion
46
principle; Darwin 1859, Gause 1934). In a constant and homogeneous environment, two main
47
mechanisms can counteract competitive exclusion. First, similar species (ecological
48
equivalence) may be subject to neutral dynamics (Bell 2001, Hubbell 2001). In that case,
49
coexistence is transient and species replacement follows a stochastic process, resulting in a slow
50
erosion of diversity that can be counteracted by migration and speciation (MacArthur and
51
Wilson 1963, Hubbell 2001). Second, dissimilar species may coexist through negative
52
frequency-dependent processes that favor species when they become rare, for example when
53
they use resources not or less efficiently exploited by other species (niche theory, Chase and
54
Leibold 2003). This negative frequency-dependence is a key component of the so-called
55
‘modern coexistence theory’ (Chesson 2000, Barabás et al. 2018).
56
However, environments can be fragmented, unstable and variable in space (Amarasekare
57
2003, Gravel et al. 2011). In these situations, local equilibria are never permanent, and
58
colonization and extinctions affect local dynamics (Leibold et al. 2004). Coexistence is
59
therefore not only determined by local processes, but also by regional ones. The interplay
60
between local and regional processes has been encompassed under the metacommunity
61
framework in which source-sink and patch dynamics play an important role (Leibold et al. 2004,
62
Holyoak et al. 2005). Under source-sink dynamics, source populations with positive growth
63
rates maintain sink populations with negative growth rate through recurrent migrant flux
64
(Pulliam 1988). Under patch dynamics, species coexist by virtue of trade-offs among traits, for
65
example traits involved in competition vs. colonization (Tilman 1994, Calcagno et al. 2006) or
4
in dispersal vs. fecundity (Yu and Wilson 2001). Note that these metacommunity processes do
67
not exhaust all possibilities and are not mutually exclusive (Brown et al. 2017). For example,
68
their relative importance depends on environmental heterogeneity and species traits (Meynard
69
et al. 2013).
70
Disentangling the various processes that drive community assembly is a serious
71
challenge. Previous attempts have largely been based on the analysis of species occurrence or
72
co-occurrence, monitored at a (single) given time, often together with environmental
73
parameters, using statistical methods partitioning the impact of environment and/or space (e.g.,
74
Cottenie 2005, Pollock et al. 2014). We focus on more dynamical approaches that formally
75
account for environmental heterogeneity, local vs. regional dynamics and species interactions.
76
More specifically, we model competition and niche effects on colonization and extinction rates
77
at a metapopulation scale, based on temporal data of species occurrence. This general approach
78
has recently been implemented in several, closely related methods (e.g., Dorazio et al. 2010,
79
Miller et al. 2012, Yackulic et al. 2014, Davis et al. 2017). These studies take into account
80
imperfect species detection, a critical issue for any observational study, that, if neglected, can
81
lead to biased inferences (review in Guillera-Arroita 2017). They however present an important
82
drawback; colonization is not modelled as proportional to the fraction of already occupied sites
83
acting as propagule sources in a metapopulation. This proportionality should be considered
84
when this fraction varies in time, whether continuously (e.g., invasive species) or transiently
85
(Moilanen 2000). Effects of variation in occupancy can be modelled through auto-regressive
86
linear effects (e.g., Yackulic et al. 2014). However, this approach results in unwanted properties
87
for prediction, such as allowing colonization by regionally extinct species, or setting it to zero
88
below a certain occupancy. Moreover, some estimations assume that the system has reached a
89
quasi-stationary regime, or temporal variation is modelled through a “sampling year” factor
5
(Naujokaitis-Lewis and Fortin 2016), which precludes analysing and predicting non-stationary
91
dynamics, for example when invasive and native species are interacting.
92
We addressed these issues by developing a new model. Our approach extends the
93
spatially-implicit metapopulation model developed by Lamy et al. (2013a), which estimates
94
extinction and colonization rates as a function of environmental variables while considering
95
imperfect species detection. Our model includes, in addition, the impact of competitive
96
interactions on these parameters, and estimates colonization rates relative to occupancy as in
97
the original model of Levins (1969), therefore accounting for temporal changes in propagule
98
pressure. We focus on a two-species system for the sake of simplicity - the approach could
99
afford more species in principle. Importantly, we use the model outcomes to perform
100
simulations, in order to (i) predict the future dynamics of the interacting species, and (ii)
101
evaluate the impact of the various mechanisms mentioned above on species coexistence at
102
regional scale.
103
We used this approach to describe the joint dynamics of two species from the freshwater
104
snail metacommunity of Guadeloupe (Lesser Antilles) which has been monitored every year
105
since 2000 at 250 sites. These two species are closely related and ecologically similar. One is
106
native while the other was introduced at the end of the 20th century and started to spread in the
107
metacommunity at the beginning of the survey. We first evaluated whether competition actually
108
occurs, as previously suggested (Chapuis et al. 2017), and how each species may locally reduce
109
colonization (resource preemption) or increase extinction (competitive replacement) of the
110
other. We then assessed the impact of environmental heterogeneity, niche differentiation, and
111
source-sink dynamics (Pulliam 1988) on local and regional coexistence. Lastly, we explored
112
whether the negative impacts of competition could be compensated by differences in other
113
demographic traits, and whether such differences are promoting species coexistence, as in
6
patch-dynamics models of coexistence in metacommunities (Levins and Culver 1971, Tilman
115
1994, Calcagno et al. 2006).
116 117
MATERIALS &METHODS 118
The freshwater snail metacommunity from Guadeloupe 119
Study area. - The study area is the Grande-Terre island (570 km2) of Guadeloupe in the
120
Lesser Antilles, a limestone plateau harboring a large number of ponds (ca. 2000), a few small
121
intermittent rivers, and swamp grasslands connected to mangroves (hereafter back-mangrove).
122
The study system has been described in detail in previous studies (e.g., Lamy et al. 2012, 2013a,
123
Chapuis et al. 2017), and we report here the information relevant to the current work. Sites vary
124
in size (from a few m to a few hundreds of m), coverage by aquatic vegetation, connectivity,
125
and water permanence (some can be dry for up to several months). The latter two are markedly
126
influenced by the alternation between the dry season (December to June) and the rainy season
127
(hereafter RS) from July to December. A minor rainy episode often interrupts the dry season
128
from March to May (LRS for “little rainy season”) with a very variable intensity among years.
129
Strong precipitation often leads to flooding events, which can connect freshwater habitats and
130
create dispersal routes for their inhabitants. Snails are one of the dominant groups of
131
invertebrate communities in freshwater environments from Grande-Terre with 26 species in
132
total.
133
Focal species. – We focus on two pulmonate snails (Aplexa marmorata and Physa acuta) 134
belonging to the Physidae family. Both are currently abundant in Grande-Terre (Chapuis et al.
135
2017). Aplexa marmorata is native to Guadeloupe and is found on average in 59% of the sites
136
in our yearly surveys (see below). Physa acuta was introduced at the end of the 20th century,
137
probably through the trade of aquatic plants, but began spreading in Grande-Terre only around
138
2000 to now occupy ca. 50% of sites. These hermaphroditic species are phenotypically quite
7
similar, but differ in their mating systems. Aplexa marmorata reproduces mainly through
140
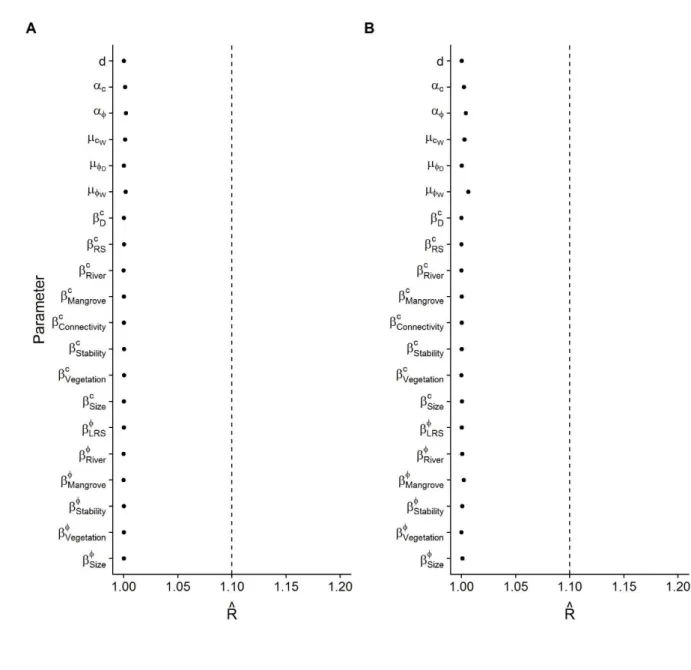
selfing (Escobar et al. 2011, Lamy et al. 2013b) while P. acuta is an outcrossing species (Henry
141
et al. 2005). Dispersal among sites, as in most freshwater snails, is mainly passive and can occur
142
through abiotic (e.g., floods) and biotic vectors (e.g., birds) and through human activities (Van
143
Leeuwen et al. 2013). Previous studies have highlighted competition between these species, as
144
the arrival of P. acuta results in both a decrease in densities and a rapid evolutionary shift in
145
life-history traits in A. marmorata (Chapuis et al. 2017).
146
Field surveys and environmental variables. – We surveyed around 250 sites yearly from 147
2001 to 2015, including mainly ponds, but also some intermittent rivers and back-mangroves.
148
A smaller number of sites (58) was surveyed in 2012 for technical reasons. Our protocol is
149
described in details in Lamy et al. (2013a, 2013b) and Chapuis et al. (2017). In each site we
150
noted the presence / absence of species (the primary data in the present study). Each year, a
151
randomly-chosen subset of sites (ca. 30) was visited twice in order to estimate species
152
detectability (see Mackenzie and Royle 2005, Lamy et al. 2013a). A set of environmental
153
characteristics was recorded in each site, including state (dry or wet), size (m), vegetation cover
154
(percent of total surface), water connectivity to neighboring freshwater habitats (four
155
categories), and water permanence (five levels, from fully permanent to frequently dry).
156 157
Multistate occupancy model 158
In order to estimate the demographic parameters of our two focal species in the
159
Guadeloupe metacommunity, we use the state-space modeling approach developed in Lamy et
160
al. (2013a), and derived from MacKenzie et al. (2003) and Royle and Kéry (2007). We extend
161
this approach to account for competition among species and dependency of colonization rates
162
on previous occupancy. The principle of the state-space approach is to distinguish between two
163
processes: a state process capturing transitions between states (occupied / not occupied) and an
8
observational process linking the data (observed or not) to the underlying state, accounting for
165
imperfect detection.
166
The model. – The model structure is reported in detail in Lamy et al. (2013a), and we 167
present here its general logic, as well as the extensions in the current version. The full details
168
are given in Appendix S2 and notations are summarized in Table 1. We model, simultaneously
169
for the two species, occupancy data in N sites (a metapopulation) over T occasions,
170
distinguishing between an observation status 𝑦𝑖,𝑡 (=1 if the species is observed in site i at
171
occasion t, and 0 otherwise) and a true occupancy status 𝑥𝑖,𝑡 (=1 if the species is present in site
172
i at t, and 0 otherwise). Two sampling occasions are separated by (successively) the dry season 173
during which extinction may occur and the rainy season during which colonization may occur.
174
The occupancy dynamics of a site (omitting the site index i for clarity) is modeled as a Bernoulli
175
draw with probability:
176
𝑃(𝑥𝑡+1= 1) = 𝑥𝑡[𝜑 + (1 − 𝜑)(1 − 𝑒−𝑐 𝑥̅̅̅ 𝑡)] + (1 − 𝑥
𝑡)(1 − 𝑒−𝑐 𝑥̅̅̅ 𝑡) (1)
177
with 𝑥̅ the overall metapopulation occupancy at the beginning of the cycle. 𝑡
178
The temporal transitions between occupancy status within sites are governed by the
179
probabilities of local persistence 𝜑 (local extinction:1 − 𝜑) and of colonization 𝛾 (probability
180
that an unoccupied site becomes occupied). Rather than estimating a constant colonization
181
probability as in Lamy et al. (2013a), we here modeled the metapopulation colonization rate c
182
(Levins 1969) which is connected to the colonization probability by 𝛾 = 1 − 𝑒−𝑐 𝑥̅ where 𝑥̅ is
183
the proportion of occupied sites. The advantage of fitting c rather than γ is that γ automatically
184
follows year-to-year variation in 𝑥̅ as long as stationarity is not reached. For example, γ
185
increases during an invasion simply because more and more sites become occupied and produce
186
propagules. In contrast, c does not have this property, being the metapopulation analog of a
per-187
capita birth rate. This is a relevant property when considering invading species such as P. acuta
188
in Guadeloupe, or collapsing metapopulations. The negative exponential comes from the
9
assumption that colonization occurs as a continuous process in time and through propagules
190
emitted by occupied sites at a constant rate, such that the probability that a site has not been
191
colonized in one time unit (cycle) is 𝑒−𝑐 𝑥̅ (i.e. the Poisson probability of no events in the time
192
interval).
193
A peculiarity of our study system is that a given site can be either wet, or dry at different
194
times. In what follows, wet and dry refer to site state observed at the time of sampling. Some
195
snail species can persist buried in the ground in dry sites, where they cannot be detected
196
(Pointier and Combes 1976, Lamy et al. 2013a). Species observation (y) in such sites is always
197
0 as the site is in practice not sampled. Therefore, its estimated occupancy is a purely latent
198
variable based upon occupancies during the previous and following wet periods. Following
199
Lamy et al. (2013a), we estimated persistence probabilities separately for dry and wet sites (𝜑𝐷
200
and 𝜑𝑊 respectively). We made a similar distinction for the colonization rate (𝑐𝐷 and 𝑐𝑊
201
respectively), but preliminary tests showed that 𝑐𝐷 was imprecisely estimated and its 95%
202
credibility interval always included zero. Therefore we simply set 𝑐𝐷 to zero, with no effect on
203
the estimates of other parameters.
204
Imperfect species detection results in a possible mismatch between state and observation.
205
Observation and state were linked by incorporating a detection probability (d) in both dry and
206
wet sites (Appendix A). The detection probability was set to 0 in dry sites for both species, and
207
estimated separately for each species in wet sites.
208
Integrating environmental covariates and competition. - Lamy et al. (2013a) modeled 209
persistence and colonization in wet sites as functions of site and year-specific environmental
210
covariates, and we extend their framework to account for competition. The final model reads
211
for each species in site i between time t and t+1:
212
𝑙𝑜𝑔 (𝑐𝑊𝑖,𝑡) = µ𝑐𝑊+ 𝜷𝒄. 𝑿𝒄𝑖,𝑡+ 𝛼𝑐𝑥′𝑖,𝑡 (2a)
213
𝑙𝑜𝑔𝑖𝑡 (𝜑𝑊𝑖,𝑡) = µ𝜑𝑊+ 𝜷𝝋. 𝑿𝝋𝑖,𝑡+ 𝛼𝝋𝑥′𝑖,𝑡 (2b)
10
𝑐𝐷 = 0 (2c)
215
𝑙𝑜𝑔𝑖𝑡(𝜑𝐷) = µ𝜑𝐷 (2d)
216
where for each parameter µ is the intercept, 𝜷 a row vector of regression coefficients, 𝑿 a vector
217
of environmental covariates (site and year specific), and 𝛼 a regression coefficient modeling
218
the effect of the competitor species. 𝑥′ represents the competitor occupancy in the focal site in
219
the previous year; it is a latent state predicted by the model, rather than an observation (as the
220
latter underestimates occupancy because of imperfect detection). Competition should result in
221
𝛼 < 0 (the presence of the other species reduces colonization or persistence), while 𝛼 > 0 could
222
result from facilitation. Log and logit transformations, for c and φ respectively, rescale the
223
authorized intervals (c ≥ 0 and 0 ≤ φ ≤1) to ]-;+[. We chose to model persistence in dry sites
224
(𝜑𝐷) as a constant: competition is unlikely to occur when sites are dry and snails are aestivating
225
(Eq. 2d). Moreover, the occurrence of dry sites is low in our dataset (5.8%), limiting the number
226
of parameters that can correctly be fitted.
227 228
Application of the model to our study system 229
Species and environmental variables. – We fit the dynamics and interactions of P. acuta 230
and A. marmorata in the Grande-Terre of Guadeloupe using a joint model that estimates the
231
intercepts µ and regression coefficients and 𝜷 for 𝑐𝐷 and 𝑐𝑊 , 𝜑𝐷, the initial occupancy at
232
the beginning of the survey , and the detection probability (in wet sites) d for each species.
233
The covariates included in our analysis were constructed from field and meteorological data,
234
and were site-specific, year-specific or site-and-year-specific (see Lamy et al. 2013a, 2013b).
235
The site-specific covariates are site type (pond vs. river and back-mangrove), site size,
236
vegetation cover and connectivity (Appendix S1: Tab. S1). We also considered stability, a
237
synthetic index negatively related to year-to-year fluctuations and perturbations within sites
238
(Lamy et al. 2013a, Appendix S1: Tab. S1). The two year-specific covariates were cumulative
11
rainfall over the little rainy season (LRS; when sites tend to shrink, reducing snail habitat) and
240
over the rainy season (RS; during which potential water connections are established among
241
sites) in the year preceding the survey. The last covariate (site- and year-specific) reflects the
242
local propagule pressure around the focal site (𝐷𝑖,𝑡 for site i at time t), an estimate of the number
243
of occupied sites surrounding the focal site in the preceding year (total number of water bodies
244
within a 4-km distance multiplied by the average 𝑥𝑡−1 of the sites that were included in our
245
survey within this radius). This distance allows the inclusion of a large-enough number of sites
246
around each sampled site without encompassing a too large fraction of Grande-Terre (Lamy et
247
al. 2013a). Following Lamy et al. (2013a), the same set of covariates was used to model
248
colonization and persistence rates with a few exceptions: connectivity and local propagule
249
pressure were included only for colonization as they are related to the probability of receiving
250
propagules. Similarly, RS was included for colonization only, while LRS was included only for
251
persistence. Thus, the number of covariates was limited to those that are likely to have an effect,
252
in order to avoid overfitting.
253
In order to facilitate interpretation, the values of all environmental covariates were
254
standardized to zero mean and unit variance before analysis, such that model intercepts
255
represent colonization rate and persistence probability in an average site (i.e. in which all
256
environmental values are set to metapopulation means). We did not standardize x’ (competitor
257
occupancy), meaning that the intercept µ estimates the colonization or persistence rate in an
258
average site when the competitor is absent (x’ = 0) while (µ+ 𝛼) is the corresponding estimate
259
when it is present (x’ = 1).
260 261
Implementing the model. – We fit the model to data using a Bayesian Markov Chain 262
Monte Carlo method. The analyses were conducted using JAGS (Just Another Gibbs Sampler,
263
Plummer 2003) implemented in the packages {rjags} and {coda} (Plummer et al. 2006) of R
12
(version 3.3.1, 2016). The model generates posterior probability distributions of all parameters
265
for both species. We used wide prior distributions for 𝜓 ~ 𝑈(0,1), 𝑑 ~ 𝑈(0,1), µ𝑐~ 𝒩(0,0.1),
266
µ𝜑 ~ 𝒩(0,0.1), as well as for the 𝛽 ~ 𝒩(0, 0.1) and 𝛼 ~ 𝒩(0, 0.1) coefficients (Normal
267
priors are expressed with a precision parameter). We ran three parallel Markov chains for 40000
268
iterations after a burn-in of 20000 iterations. Convergence was assessed by visual inspection
269
and using several diagnostics available in the {ggmcmc} (Fernández-i-Marín 2016). We report
270
potential scale reduction factor (𝑅̂, Brooks and Gelman 1998) in Appendix S1: Fig. S1,
271
posterior distributions of parameters in Appendix S1: Fig. S2 and pairwise correlations among
272
parameters in Appendix S1: Fig. S3. We report the medians and credibility intervals of posterior
273
distributions in Table 2.
274 275
Projecting species dynamics to understand coexistence 276
The results of the Bayesian approach were used to explore species dynamics, based on
277
simulations, with various aims. The first was to evaluate whether the model correctly
278
reproduced the observed dynamics of the two species at the time scale of our study. The second
279
aim was to make long-term projections (500 cycles) of occupancies and prospects of
co-280
existence of the two species in the Guadeloupe landscape. The third aim was to explore the
281
impact of various mechanisms (priority effects, environmental heterogeneity, and competition)
282
on the two-species dynamics by varying their intensity in the simulations.
283
For these purposes, we developed a stochastic simulation model of a two-species
284
metacommunity in a landscape of 250 sites mimicking the Guadeloupe system. The
site-285
specific covariates and geographical position of the simulated sites exactly matched those of
286
our dataset. At each cycle (corresponding to one year in the Guadeloupe system), we used LRS
287
and RS covariates, and a pattern of dry/wet sites, based on observed data; the first 15 years of
288
the simulations were as in the data, and the following years were drawn at random with
13
replacement from the first 15 years (i.e. assuming no temporal trend). The site and year-specific
290
covariate describing local propagule pressure (𝐷𝑖,𝑡) was computed for each site at each time
291
step, and standardized based on the mean and standard deviation from empirical data (the
292
appropriate scale to use the regression slope estimates produced by the Bayesian method).
293
Finally, occupancy was drawn at each time step from a Bernoulli distribution following Eqs. 1
294
and 2. We implemented the simulations in Julia (Bezanson et al. 2017, version 0.6.2), a fast
295
and user-friendly programming language, with 1000 replicates per parameter set (including 50
296
random initializations for RS, LRS and desiccation patterns, replicated twenty times each).
297
Simulations were run for 500 cycles (i.e. years). The values extracted from the simulations at
298
each cycle were the fraction of sites that were empty, occupied by a single species or occupied
299
by both species, as well as the transition frequencies among these states.
300
For aims 1 and 2 parameters were drawn for each replicate from the posterior joint
301
distribution obtained from the model. The first 15 years of simulations were used to compare
302
with empirical observations (aim 1) while the 500th year (after visually checking for stationarity,
303
see e.g., Appendix S1: Fig. S4) was used to predict the stationary state of the system (aim 2).
304
For aim 3, we changed some parameter values to investigate their impact. The other
305
parameters were again drawn from the joint posterior distribution generated from the statistical
306
model. We first evaluated possible priority effects by reversing the initial occupancies of the
307
two species (ca. 5% in the invasive P. acuta and ca. 50% in the native A. marmorata) in the
308
simulations of two-species metacommunity dynamics (see e.g., Hanski 1983). However, this
309
did not detectably influence the long-term behavior of the model (results not reported). Note
310
that 5% may already be high enough to overcome the initial stochasticity inherent to an invasion
311
process. Therefore, we also performed simulations initiated with a single occupied site (i.e.
312
0.4% of occupied sites) for one species, the other species being at its single-species stationary
14
occupancy. This was done for each species and used to estimate the probability of invasion
314
success.
315
Next, we studied the impact of environmental heterogeneity. To this end, we simulated
316
environmentally uniform landscapes, composed of 250 identical sites mimicking the conditions
317
of one of the 250 observed sites, for both species, including competition or setting it to zero.
318
This was done using each of the 250 sets of site-specific environmental covariates, and we
319
recorded for each set whether one or both species persisted on the long term. We could therefore
320
identify three categories of environments per species based on whether the metapopulation (i)
321
persisted in a landscape uniformly composed of this environment, even in competition with the
322
other species, (ii) persisted only in the absence of competition, or (iii) never persisted. By
323
analogy with classical concepts, we refer to category (i) as our metapopulation estimate of the
324
“realized niche” of the focal species, while the “fundamental niche” is represented by categories
325
(i) and (ii) together. By intersecting the realized and fundamental niches of the two species, we
326
ended up with six more precise categories of environments: (1) outside the two fundamental
327
niches (no species can persist), (2) within both realized niches (both species persist), (3) out of
328
the fundamental niche of A. marmorata but within that of P. acuta (only the latter persists), (4)
329
out of the realized niche of A. marmorata but within its fundamental niche (A. marmorata
330
persists only when P. acuta is absent). Categories (5) and (6) are as (3) and (4), swapping the
331
two species. We conducted a linear discriminant analysis (LDA) to determine which linear
332
combinations of the site-specific environmental variables (size, connectivity, vegetation cover,
333
stability, and site type) best differentiated among these six categories.
334
We explored the impact of competition asymmetry and difference in demographic
335
strategies on metapopulation persistence using two series of simulations. We first ran
336
simulations setting the competition coefficients () to zero for each species in turn (i.e. making
337
competition unidirectional rather than reciprocal). Second, we simulated a range of colonization
15
and extinction rates for each species, in presence and absence of competition, to determine how
339
the competitive effect exerted by the other species modifies the persistence thresholds. The two
340
series of simulations were performed both with and without environmental heterogeneity.
341 342
RESULTS 343
Metacommunity parameters and the influence of environmental covariates and competition 344
Aplexa marmorata (the native species) was found in 59% of the sites per year on average 345
(minimum 41%, maximum 77%), and was never observed in only 1.2% of the sites over the
346
whole period. Its detection probability was 0.84 (Table 2). The detection probability of P. acuta
347
(invasive) was slightly lower (0.75), and its dynamics differed, as it was detected in 1.4% of
348
the wet sites in 2000, steadily increased to 49% in 2015, and plateaued somewhat after 2011
349
(Fig. 1).
350
The intercepts for colonization and persistence (recall that intercepts represent
351
probabilities/rates in the absence of competition in a site with average environmental
352
characteristics) were very different between the two species (Table 2; posterior distributions are
353
reported in Appendix S1: Fig. S2). The colonization rate (𝑐𝑤) of A. marmorata was almost
354
twice as high as that of P. acuta (1.24 vs. 0.70), while the persistence probability in wet sites
355
(𝜑𝑤) was much higher in P. acuta (0.99) than in A. marmorata (0.75). Interestingly, both
356
species persisted well in dry sites (𝜑𝐷 = 0.87 and 0.81 in A. marmorata and P. acuta
357
respectively). Note that the 𝜑𝐷’s were imprecisely estimated (see credibility intervals in Table
358
2) since they were calculated on a limited number of sites (5.8% of sites are dry on average per
359
year). However, the credibility intervals were well above zero, validating the inclusion of 𝜑𝐷
360
in the model.
361
Habitat type, site size, vegetation cover and connectivity affected the two species in
362
different ways. In both species lower colonization rates were found in back-mangroves than in
16
other habitats (Table 2 and Appendix S1: Fig. S5). The reverse was true for persistence, with
364
higher values in back-mangroves, especially in P. acuta (Appendix S1: Fig. S5). However, a
365
lower persistence rate and a higher colonization rate were estimated in A. marmorata than in P.
366
acuta in all three habitat types. Note that the model predicted extremely low colonization and 367
extremely high persistence in P. acuta in back-mangroves (Appendix S1: Fig. S5). We
368
confirmed based on raw data that this reflects a real pattern. P. acuta is continuously present in
369
a few back-mangrove sites, and continuously absent in others, during the whole study period.
370
In the one hand, high vegetation cover had a markedly positive effect on the persistence of A.
371
marmorata, and a weaker, but still positive effect on its colonization. On the other hand, 372
vegetation cover decreased the colonization rate for P. acuta and its effect on persistence was
373
weak (credibility interval including zero). Site size and connectivity increased colonization in
374
P. acuta, but had no impact on A. marmorata. The rainfall variables (LRS and RS) had no 375
influence in A. marmorata, but in P. acuta, persistence was increased by LRS, while RS slightly
376
decreased the colonization rate (Table 2). The local propagule pressure covariate (𝐷𝑖,𝑡) had no
377
effect in either species.
378
Competition had a different effect on the two species (Table 2 and Fig. 2). The presence
379
of P. acuta strongly decreased the colonization rate of A. marmorata but had no effect on the
380
persistence of established populations. In contrast, the presence of A. marmorata strongly
381
decreased the persistence of P. acuta, and decreased its colonization to a lesser extent. These
382
effects are represented in Fig. 2. Competition drives both species closer to the extinction
383
threshold (when extinction overwhelms colonization), but each species would persist in a
384
hypothetical metapopulation completely occupied by its competitor.
385 386
Simulated species dynamics: role of competition and environmental heterogeneity 387
17
When all parameters were drawn from the posterior joint distribution, the simulated
388
dynamics matched the 15 years of data, both for each species separately and for the sites where
389
they co-occur (Fig. 1A). They also predicted that the two species could co-exist on the long
390
term and co-occur at equilibrium in a non-negligible fraction of the sites, despite the strong
391
reciprocal effects of competition detected above (Fig. 1A). In both species, however, the
392
predicted equilibrium occupancy was decreased by competition (60% instead of 85% in A.
393
marmorata, and 77% instead of 94% in P. acuta), and co-occurrence decreased from 80% to 394
42% (Fig. 1B). The influence of competition on the temporal turnover in site occupancy can be
395
represented in transition graphs extracted from simulations (Appendix S1: Fig. S6). In
396
simulations without competition, most sites (79.9%) were doubly occupied, a high fraction of
397
which stayed in this state between two successive years (88%). The largest predicted fluxes
398
were between doubly-occupied sites and sites with P. acuta only, reflecting frequent
399
extinction/colonization cycles in A. marmorata. With competition, the predicted fraction of
400
doubly-occupied sites strongly decreased; the probability to stay in this category the next year
401
was still high, but lower than without competition (70%). The turn-over rates were more
402
balanced, as the fluxes between singly- and doubly-occupied sites were comparable for the two
403
species (6.5 vs. 4.5%; Appendix S1: Fig. S6).
404
Possible priority effects were investigated by evaluating the invasion probability in
405
simulations initialized with a single randomly-chosen site occupied by one species, while
406
leaving the other species being at its equilibrium occupancy. The invasion probability decreased
407
from 0.97 to 0.78 in P. acuta (in the absence and presence of A. marmorata respectively), and
408
from 0.87 to 0.59 in A. marmorata (reciprocally).
409
We investigated the potential for coexistence of the two species in a (theoretical)
410
homogeneous landscape, by setting all sites to environmental conditions identical to those
411
observed in actual sites. These simulations showed that both species were able to maintain
18
viable metapopulations in most conditions in the absence of competitor (Fig. 3 and Fig. 4).
413
These conditions define the fundamental niche of the two species, which include 95% of the
414
sites for A. marmorata and 99% for P. acuta. A single site (0.4%) did not belong to either
415
fundamental niche. Competition decreased the number of favorable sites (realized niche, Fig.
416
3): 68% for A. marmorata and 93% for P. acuta. 64% of the site types would allow stable
417
coexistence of the two species in a homogeneous landscape, defining their shared realized
418
niche.
419
The first two axes of the LDA explained 72.3% and 24.4% of the total variance among
420
the six categories of sites based on realized and fundamental niches of the two species (Fig.
421
4A). Axis 1 was mainly related to vegetation cover, to which A. marmorata appeared to be very
422
sensitive. Very low values on this axis were outside its fundamental niche. Low to intermediate
423
values represent conditions under which A. marmorata could not maintain a viable
424
metapopulation in the presence of P. acuta (outside the realized niche; Fig. 4B). On the other
425
hand, only a few sites with low values on axis 2 were outside the fundamental niche of P. acuta
426
(Fig. 4C), and these were small, poorly connected and unstable sites. The conditions in which
427
P. acuta might be excluded by A. marmorata mostly combined relatively low values on axis 2 428
and high values on axis 1, i.e. sites that were relatively small, poorly connected, unstable and
429
vegetated (Fig. 4C). However, this exclusion domain was neither as large, nor as clearly
430
delimitated as for A. marmorata (compare Fig. 4B and 4C).
431
Simulations of heterogeneous landscapes, in which all sites retained their actual
432
environmental characteristics, predicted positive occupancy probabilities in all sites, the lowest
433
values being 0.20 in P. acuta, 0.13 in A. marmorata, and 0.08 for local co-occurrence. Thus,
434
all sites, even the less favorable ones, were transiently occupied from time to time. Some sites
435
were predicted to be occupied more often, and others less often, in the real heterogeneous
436
landscape, than they would be in environmentally-homogeneous landscapes entirely composed
19
of sites similar to them. In both species, about 45% of sites belong to the first category
438
(Appendix S1: Fig. S7), which includes all sites outside the species’ respective realized niches
439
(where the predicted occupancy is positive in a heterogeneous landscape, and zero in a
440
homogeneous one). Importantly, landscape heterogeneity overall resulted in more gain in
441
average occupancy in unfavorable sites than losses in favorable ones in both species (Appendix
442
S1: Fig. S7). This asymmetry is even more pronounced on the site-specific probability of
co-443
occurrence of both species (Appendix S1: Fig. S7).
444
We then ran simulations to evaluate the effects of competition on persistence. First, we
445
set the competitive effect of one species on the other to zero, leaving the reciprocal effect intact.
446
These simulations mimicked a situation of completely asymmetrical competition. When
447
removing the effect of P. acuta on A. marmorata colonization, the expected occupancy of P.
448
acuta decreased from 85% to 68% in the mean environment and from 77% to 74% in the 449
heterogeneous landscape, whereas A. marmorata occupancies increased by almost 30%, from
450
47% to 85% in the mean environment and from 60% to 87% in the heterogeneous landscape.
451
When removing the effect of A. marmorata on P. acuta, A. marmorata occupancies slightly
452
decreased both in the mean environment (47% to 41%) and in the heterogeneous landscape
453
(60% to 55%) whereas P. acuta occupancies increased by about 15%, from 85% to 97% in the
454
mean environment and from 77% to 94% in the heterogeneous landscape. The competitive
455
effect is therefore beneficial to the species exerting competition, but simulations suggest each
456
species would persist despite the competition exerted by the other, even without exerting any
457
reciprocal competitive effect.
458
Second, we investigated threshold values of species-specific demographic rates (φ and
459
c) allowing persistence at the metapopulation scale (Appendix S1: Fig. S8), focusing on the 460
component for which the species are performing better (i.e. colonization for A. marmorata and
461
persistence for P. acuta). The colonization rate of A. marmorata in the mean environment is
20
1.24, its lower limit for regional persistence being 0.29 without competition and 0.86 with
463
competition. The local persistence probability of P. acuta in the mean environment is 0.99, its
464
lower limit for regional persistence being 0.40 without competition and 0.91 when competition
465
occurs. The same values in the heterogeneous landscape are 0.06 and 0.19 (colonization) in A.
466
marmorata and 0.02 and 0.43 (persistence) in P. acuta. 467
468
DISCUSSION
469
A methodology to predict the dynamics of competing species in a fragmented landscape 470
Biological invasions create novel pairwise competitive interactions worldwide, with
471
uncertain outcomes (David et al. 2017). Invasive competitors often affect the demography of
472
native species at a local scale (Byers 1999, 2000). However, regional persistence in fragmented
473
landscapes depends on higher-scale impacts of competition on colonization and extinction rates
474
(Levins 1969, Leibold et al. 2004). Previous studies have used occupancy models to document
475
these impacts (e.g., Dugger et al. 2011, Yackulic et al. 2014) but did not provide useful
476
projections, as they did not account for natural feedbacks of occupancy on colonization in
non-477
equilibrium conditions inherent to ongoing invasions. In contrast, our model quantifies relative
478
colonization and extinction rates (as in Levins’ model), and their sensitivity to competition. In
479
addition, our model accounts for imperfect species detection (MacKenzie et al. 2003,
Guillera-480
Arroita 2017). It accurately reproduces the trajectory of our system over the last 15 years,
481
suggesting that robust projections can be built without assuming equilibrium.
482 483
Asymmetrical impacts of competition on colonization and extinction rates 484
In the absence of competition the two snail species display striking differences in
485
demographic parameters: A. marmorata is a more fugitive species than P. acuta, with higher
486
colonization and lower persistence. Competition can affect both rates resulting in preemption
21
when an established competitor impedes colonization by other species, and/or replacement
488
when it drives it to local extinction (see e.g., Slatkin 1974, Hanski 1983, Calcagno et al. 2006,
489
Little and Altermatt 2018). Both forms markedly affect our two-species system, in an
490
asymmetric way: P. acuta reduces colonization in A. marmorata (preemption), while A.
491
marmorata mostly reduces persistence in P. acuta (replacement). Although it has been 492
theorized for a long time that competition might act on both colonization and persistence in
493
metacommunities (e.g., Levins and Culver 1971, Slatkin 1974, Hanski and Ranta 1983), this
494
has been quantified in surprisingly few studies – possibly because long-term data are required
495
(see Hastings 1987). For example, Bengtsson (1989) identified effects on extinction, though
496
not on colonization, in Daphnia species. Dugger et al. (2011) demonstrated the invasive barred
497
owl decreased both colonization and persistence of the Spotted Owl in North America, but the
498
barred owl dynamics was not quantified. Naujokaitis-Lewis and Fortin (2016) highlighted
499
reciprocal competition on the two components between two warbler species. However, they
500
estimated environmental effects and competition sequentially rather than simultaneously,
501
potentially biasing competition estimates. Our study therefore adds to these few examples, and
502
goes a step forward by simultaneously fitting two-species dynamics dependent on environment
503
and species interactions, and by considering per-capita colonization rates instead of absolute
504
ones (Moilanen 2000).
505
We observed differences in colonization, extinction, and competition that may be related
506
to species traits. Colonization has classically been related to “fast” life-history and
self-507
fertilization ability, often found in early-succession stages (Baker 1955, Baker 1974, Grime
508
1977). In the laboratory, Guadeloupe populations of A. marmorata reproduce earlier, have a
509
lower fecundity and adult body volume, and a higher juvenile survival, but a shorter adult
510
lifespan than populations of P. acuta (Chapuis et al. 2017). The latter is also a preferential
511
outcrosser that can self-fertilize only after a long waiting time (Tsitrone et al. 2003), and at the
22
cost of strong inbreeding depression (Jarne et al. 2000, Escobar et al. 2011). In contrast, A.
513
marmorata is a preferential selfer subject to none of these two constraints (Escobar et al. 2011). 514
Thus, both life-history traits and mating system may favor the ability of A. marmorata to rapidly
515
grow in numbers from an initial low-density population in a context of abundant resources (high
516
colonization rate), while P. acuta might be more efficient at maintaining an established
517
population dominated by long-lived adults tolerating low resource levels (high persistence rate).
518
In consistency with this hypothesis, A. marmorata depends on the abundant food and shelter
519
provided by aquatic vegetation for persistence. Positive effects of site size and water
520
connectivity on colonization in P. acuta suggest a limitation by propagule pressure: founding a
521
new population may require more attempts than in A. marmorata. Competitive preemption by
522
P. acuta may occur because established populations keep resources at a low level, especially 523
when vegetation is rare, reducing the colonization probability of A. marmorata. The
524
competitive replacement ability of A. marmorata is more difficult to explain, perhaps resulting
525
from a faster exploitation of ephemeral resources (e.g., vegetation patches) during
contraction-526
expansion cycles of waterbodies in the dry season, reducing the population growth rate of P.
527
acuta. 528
529
Coexistence, competition and species sorting at the landscape scale 530
Our simulations do not predict competitive exclusion. However, (i) the invasion of each
531
species is predicted to be slightly slower and more uncertain when the other species is
532
established; (ii) the model predicts competition should reduce the equilibrium occupancy of
533
each species by 15 to 20%, and the number of co-occupied sites by nearly 50%. We used
534
additional simulations to disentangle the contribution of various processes modulating these
535
effects, thus favoring or disfavoring local and regional coexistence of the two species.
23
The first process indicated by our simulations is a species-specific response to
537
environmental heterogeneity. Specialization in different patch types may facilitate coexistence
538
through “species sorting”, i.e. niche partitioning at the landscape scale (Amarasekare et al.
539
2004, Leibold et al. 2004). However, mapping favorable sites for each species is not a simple
540
task in a metapopulation. Classical niche models such as species distribution models, based on
541
the presence of a species in a given environment (e.g., see Guisan and Thuiller 2005 for review),
542
cannot be applied at this scale because migration from favorable habitats maintains species in
543
patch types that would not, in the absence of other types, sustain a stable metapopulation
544
(source-sink dynamics; Pulliam 1988, Loreau and Mouquet 1999). This led us to propose an
545
operational definition of the niche in a metapopulation context: the region in the environmental
546
space where a species could potentially maintain a viable metapopulation in the absence of
547
heterogeneity among patches. Although homogeneous landscapes do not exist, simulating them
548
allows one to identify species-specific sink and source habitats, to express competition effects
549
in the form of realized vs. fundamental niches, and to evaluate the reduction in local
co-550
occurrence due to species sorting. We observed, for example, contrasted responses to vegetation
551
cover in the two species. Nevertheless, the two fundamental niches still largely overlapped.
552
Adding inter-specific competition to the model reduced this overlap, but not to a dramatic
553
extent. At least half of the sites harbor environments that, if generalized to the whole landscape,
554
would result in stable coexistence of the two species (shared realized niche).
555 556
Competition and coexistence theory 557
As our results suggest that environmental species-sorting is not necessary for coexistence,
558
are there environment-independent mechanisms at play? Metacommunity theory has
559
highlighted two such mechanisms (Leibold et al. 2004): (i) ecological neutrality (Bell 2001,
560
Hubbell 2001), under which competition is approximately symmetrical. However, neutrality is
24
here contradicted by the very different estimates of metapopulation vital rates and asymmetrical
562
impacts of competition between the two species; (ii) trade-offs among species traits, whereby
563
competitive inferiority of one species is compensated by an advantage in some other trait,
564
usually colonization (Kneitel and Chase 2004). Classical models of the
colonization-565
competition tradeoff (Levins and Culver 1971, Tilman 1994) assume hierarchical competitive
566
effects resulting in instantaneous eviction of the inferior species, and precluding local
co-567
occurrence. Our system differs from this idealized situation in two ways: competition is not
568
efficient enough to preclude co-occurrence within patches (70% of doubly-occupied patches
569
remain in this state from one year to the next), and species may compensate for differences in
570
competitive replacement ability not only by colonization, but also by persistence and
571
competitive preemption (here, A. marmorata has stronger replacement effects, and P. acuta
572
stronger preemption effects). The available models that best capture these characteristics are
573
metapopulation models of two competing species (Slatkin 1974, Taneyhill 2000) in which
574
conditions for coexistence at the landscape scale are not as stringent as in classical
competition-575
colonization metacommunity models. For example, competition may elevate the threshold
576
colonization rate below which a species cannot persist, but this threshold does not have to
577
exceed the colonization rate of the competitor (e.g., Taneyhill 2000). Accordingly, our
578
simulations suggest that although A. marmorata has a greater basal colonization rate than P.
579
acuta, and P. acuta a higher basal local persistence rate than A. marmorata, these conditions 580
were not required for them to co-exist. Similarly, compensation between two components of
581
competition occurs (A. marmorata has stronger replacement effects, and P. acuta stronger
582
preemption effects) and affects equilibrium occurrences, but does not seem necessary for
583
coexistence.
584
Overall, a diversity of mechanisms (species sorting, differences in colonization and
585
persistence rates, reciprocal competitive effects) contribute to increase the levels of occurrence
25
and co-occurrence of the two species in our system, none of which appears individually
587
essential in our simulations. As mentioned above, one reason might be that competition itself
588
is not strong enough to preclude transient local coexistence. Local co-occurrence between
589
competitors is common in many empirical studies, for example in small mammals (Guélat et
590
al. 2008), birds (Dugger et al. 2011) or frogs (Lehtinen and Carfagno 2011). In this respect,
591
classical competition-colonization trade-offs models, although useful to conceptualize
592
coexistence, are caricatural representations of true metacommunities as they implicitly assume
593
extremely high and asymmetrical impacts of competition, and conceal the stochastic and
594
multifarious nature of the processes and trade-offs at play. These models may be more
595
applicable to sets of individual sites (i.e. can be occupied by at most one individual of one
596
species) than to true metacommunities, where patches are occupied by entire populations,
597
possibly of two or more species.
598 599
Limitations and future directions 600
There are some limitations in our study. (i) As for any study incorporating niche
601
differentiation, unmeasured variables might affect colonization and extinction, potentially
602
biasing estimates of competition (see e.g. Chase and Leibold 2003). Unfortunately, including
603
too many covariates may result in overfitting instead of model improvement; therefore, we tried
604
to rely on a limited set of variables that appeared most relevant for the species considered (Lamy
605
et al. 2013a). (ii) We only modelled coexistence at the landscape scale. The conclusion that
606
transient co-occurrence is possible in many site types and facilitates coexistence at landscape
607
scale does not specify the underlying local mechanisms. Microhabitat differentiation within
608
sites could exist in our system, and may facilitate local coexistence. (iii) Our model is spatially
609
implicit. A spatially-explicit model may be required in systems with strong dispersal limitation.
26
Our method could be generalized to accommodate more species and/or
environment-611
dependent competition. However this would rapidly increase the number of parameters,
612
especially competition parameters if all pairwise coefficients are estimated. A solution might
613
be to consider independently small groups of species for which we have a priori expectations
614
of stronger interactions, or decomposing the interaction matrix in order to reduce its
615
dimensionality (see e.g., Warton et al. 2015, Godoy et al. 2017). One could also make use of
616
regularization methods (e.g., using “spike and slab” priors or L1 regularization – Laplacian
617
prior) in order to produce more sparse coefficient matrices. None of these solutions may be
618
perfect, but exploring them is a worthy objective for future research in order to deepen our
619
understanding of metacommunity dynamics.
620 621
Conclusion 622
Our study is the first attempt to estimate metapopulation vital rates of two related species
623
in a fragmented landscape, including reciprocal competitive effects on both colonization and
624
persistence, as a first step towards understanding more complex metacommunities. Simulations
625
based on our estimates accurately reproduce the observed trajectory of the two species during
626
15 successive years, and provide the opportunity to project the long-term trajectory of the
627
system. We also explore hypothetical trajectories that serve as thought experiments to
628
understand coexistence conditions. The metacommunity framework organizes coexistence
629
mechanisms in fragmented landscapes along four idealized paradigms: neutral dynamics,
630
species-sorting, mass-effects, and patch-dynamics (Leibold et al. 2004, Holyoak et al. 2005).
631
Empirical studies have mainly tried to classify observed communities along these axes
632
(reviewed by Logue et al. 2011), essentially using pattern-based methods (e.g., variation
633
partitioning, Cottenie 2005). However, these processes are not exclusive (e.g., Winegardner et
634
al. 2012, Brown et al. 2017). Our case study illustrates how they can interact. We observe
27
species-sorting, although recurrent migration among sites allows species to occur or co-occur
636
in unfavorable habitats (i.e. mass-effects). However, the coexistence of snail species would be
637
possible even without environmental heterogeneity. Thus, providing evidence for niche
638
partitioning is not sufficient to argue that it plays a large role in coexistence. We also show that
639
theoretical models that inspire the patch-dynamic perspective often rely on assumptions
640
unlikely to be met in metacommunities, and that models integrating doubly-occupied sites and
641
transient co-occurrence (Slatkin 1974, Taneyhill 2000) may provide parsimonious explanations
642
to regional coexistence, even in the case of similar species.
643 644
ACKNOWLEDGEMENTS
645
We thank two reviewers for insightful comments and the numerous people who participated to
646
metacommunity sampling in Guadeloupe over the last two decades: N. Bonel, V. Calcagno, E.
647
Chapuis, M.-P. Dubois, G. Epinat, J.S. Escobar, N. Juillet, T. Lamy, F. Laroche, F. Massol, and
648
A. Ségard. MD is supported by a PhD fellowship from the University of Montpellier. The
649
research conducted here was supported by grants from the Agence National de la Recherche
650
(AFFAIRS, ANR-12SV005, and NGB, ANR-17CE32-0011-05) to PD and by the CNRS.
651
Analyses benefited from facilities from the Montpellier Bioinformatics Biodiversity platform
652
(CeMEB LabEx).
28
LITERATURE CITED
654
Amarasekare, P. 2000. The geometry of coexistence. Biological Journal of the Linnean
655
Society 71:1–31.
656
Amarasekare, P. 2003. Competitive coexistence in spatially structured environments: A
657
synthesis. Ecology Letters 6:1109–1122.
658
Amarasekare, P., M. F. Hoopes, N. Mouquet, and M. Holyoak. 2004. Mechanisms of
659
coexistence in competitive metacommunities. The American naturalist 164:310–326.
660
Baker, H. G. 1955. Self-compatibility and establishment after “long-distance” dispersal.
661
Evolution 9:347–349.
662
Baker, H. G. 1974. The evolution of weeds. Annu. Rev. Ecol. Syst 5:1–24.
663
Barabás, G., R. D’Andrea, and S. M. Stump. 2018. Chesson’s coexistence theory. Ecological
664
Monographs.
665
Bell, G. 2001. Ecology - neutral macroecology. Science 293:2413–2418.
666
Bengtsson, J. 1989. Interspecific competition increases local extinction rate in a
667
metapopulation system. Nature 340.
668
Bezanson, J., A. Edelman, S. Karpinski, and V. B. Shah. 2017. Julia: A fresh approach to
669
numerical computing. SIAM review 59:65–98.
670
Brooks, S. P., and A. Gelman. 1998. General methods for monitoring convergence of iterative
671
simulations. Journal of Computational and Graphical statistics 7:434–455.
672
Brown, B. L., E. R. Sokol, J. Skelton, and B. Tornwall. 2017. Making sense of
673
metacommunities : dispelling the mythology of a metacommunity typology. Oecologia
674
183:643–652.
675
Byers, J. E. 1999. The distribution of an introduced mollusc and its role in the long-term
676
demise of a native confamilial species. Biological Invasions 1:339–352.
677
Byers, J. E. 2000. Competition between two estuarine snails: implications for invasions of