HAL Id: hal-01757079
https://hal.inria.fr/hal-01757079v2
Submitted on 21 May 2018
HAL is a multi-disciplinary open access
archive for the deposit and dissemination of
sci-entific research documents, whether they are
pub-lished or not. The documents may come from
teaching and research institutions in France or
abroad, or from public or private research centers.
L’archive ouverte pluridisciplinaire HAL, est
destinée au dépôt et à la diffusion de documents
scientifiques de niveau recherche, publiés ou non,
émanant des établissements d’enseignement et de
recherche français ou étrangers, des laboratoires
publics ou privés.
Characterizing Granular Networks Using Topological
Metrics
Joshua Dijksman, Lenka Kovalcinova, Jie Ren, Robert Behringer, Miroslav
Kramár, Konstantin Mischaikow, Lou Kondic
To cite this version:
Joshua Dijksman, Lenka Kovalcinova, Jie Ren, Robert Behringer, Miroslav Kramár, et al..
Character-izing Granular Networks Using Topological Metrics. Physical Review E , American Physical Society
(APS), 2018, 97, pp.042903. �hal-01757079v2�
Characterizing Granular Networks Using Topological Metrics
Joshua A. Dijksman,1 Lenka Kovalcinova*,2 Jie Ren,3 Robert P.
Behringer,4 Miroslav Kramar,5 Konstantin Mischaikow,6 and Lou Kondic2
1Physical Chemistry and Soft Matter, Wageningen University, Wageningen, The Netherlands 2
Department of Mathematical Sciences, Center for Applied Mathematics and Statistics, New Jersey Institute of Technology, Newark, NJ 07102, USA
3Merck Research Laboratories, Merck & Co., Inc., West Point, PA 19486, USA 4
Dept. of Physics, Duke University, Science Drive, Durham NC 27708-0305, USA
5
Advanced Institute for Materials Research, Tohoku University, Sendai, Japan
6Department of Mathematics, Rutgers University, Piscataway, NJ 08854-8019, USA
We compare experimental and numerical realizations of a granular system as it undergoes shear jamming. We adjust the numerical methods used to optimally represent the experimental settings. Measures presented here range form microscopic, through mesoscopic to system-wide characteristics of the system. Properties of the mesoscopic force networks provide a key link between micro and macro scales. We report two main findings: the number of particles in the packing that have at least two contacts is a good predictor for the mechanical state of the system, regardless of strain history and packing density. All measures explored in both experiments and numerics, including stress tensor derived measures and contact numbers depend in a universal manner on the fraction of non-rattler particles, fN R. The force network topology also tends to show this universality, yet
the shape of the master curve depends much more on the details of the numerical simulations. In particular we show that adding force noise to the numerical data set can significantly alter the topological features in the data. We conclude that both fN R and topological metrics are useful
measures to consider when quantifying the state of a granular system.
An important class of particulate systems includes granular materials, colloids, foams and molecular glass
formers. These materials can become “rigid”, or
“jammed”, in the absence of long range spatial order. Jammed states are solids in mechanical equilibrium, with non-zero elastic moduli [1, 2]. In order to be in mechan-ical equilibrium, forces must be transferred from parti-cle to partiparti-cle, creating self-organized networks of
con-tacts and forces. These networks undergo
rearrange-ments when shear induced deformation of the materi-als occurs. The networks are typically spatially hetero-geneous [3], and during deformation, they are tempo-rally intermittent, with avalanches, slip events, fracture and elasto-plastic failure modes. Finding the microscopic metrics responsible for this broad spectrum of mechani-cal behaviors across the solid-liquid transition has been challenging, since many of the conventional tools for char-acterizing ordered thermal systems do not apply.
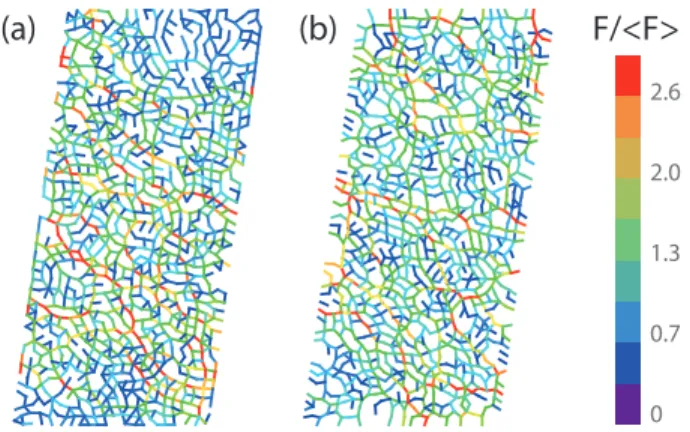
Understanding how granular materials self-organize into mechanically stable states requires consideration of the structure of force networks. Figure 1 shows exam-ples of typical force networks found in the experiments and simulations. A full description of the force network requires a high dimensional space that reports on micro-scopic features and does not directly reveal its mesomicro-scopic structure. In order to understand this structure, we need statistical tools for their characterization that are sensi-tive, systematic, unbiased, minimal, and consistent with macroscopic properties, such as the system-wide stresses. These tools must also be able to distinguish different states of the system, based on force networks.
To demonstrate the need for mesoscopic description of
(a)
(b)
2.6 1.3 0.7 0 2.0F/<F>
FIG. 1. Examples of an experimental (a) and numerical (b) force network. Experimental and numerical examples are generated at the same strain amplitude γ = 14.9% and φ = 0.8036. The color scale represents the total force at each contact, normalized by the concurrent mean force. As de-scribed in the text, the simulation results in this and all the following figures include additional noise of amplitude 0.01 N, except if specified differently.
the force network we will consider the granular response to quasi-static shear strain, γ, which is analogous to time in a more conventional dynamical system. The structure of the network as a granular system is strained shows a sensitive dependence on the initial conditions. We show that simple topological measures detect the variability in force networks formed in response to shear in quasi-two-dimensional granular systems. These metrics cap-ture feacap-tures that are missed by conventional measures,
such as stresses or contact force distributions.
In this article, we consider two realizations of a partic-ular granpartic-ular system: experimental and computational. The studies of these realizations show the importance
of the fraction of non-rattler particles, fN R, defined as
particles with at least two contacts, as a relevant state variable. In particular, the considered metrics fall onto
master curves when expressed as functions of fN R. These
metrics include traditional measures, such as contact numbers, stresses, and contact force probability distribu-tion funcdistribu-tions which identify system-wide as well as mi-croscopic features. We observe a good match between the experimental and computational systems at these scales. However, at the mesoscale, there are clear differences identified using topological metrics. We conjecture that the differences arise from small imperfections and noise in the experiments that are absent in the simulations. The topological metrics that we employ are sensitive to the force noise in the experimental data sets and capture these differences. Our conjecture is reinforced by the fact that by introducing appropriate random noise in the sim-ulations we can generate a reasonable match between the statistics of the topological networks in simulations and experiments. This finding suggests that the considered topological measures may have an important utility in quantifying the properties of intrinsic noise that is always involved in the experiments. As a consequence, topolog-ical techniques provide new opportunities for identifying the scale of the experimental noise, and distinguishing noise from intrinsic fluctuations.
Topological metrics Although there exists a number of tools to extract network information, see [4, 5] for re-views, recent work [6–13] demonstrates that topological methods are well suited to characterize force networks in granular packings. In this Letter, we use the Betti
numbers β0 and β1 to quantify the topology of a
net-work, where β0 indicates the number of clusters or
con-nected components of the network, and β1 characterizes
the number of loops. Thus, in a rough sense, β0is a
mea-sure of force network segments, and β1is related to their
interconnectivity. Computations were performed using software Perseus [14]. In particular, we are interested in the properties of the (simplicial complex) network that describes the force interactions between the particles with
force magnitude larger than fc. We pick fc= 1.0h|f|i in
our analysis (here h|f|i is the average force), and note that results are not very sensitive to this choice of threshold. This network is constructed in the following manner.
Ev-ery particle, pi, is represented by a vertex, vi. The edge
< vi, vj > belongs to the network if the magnitude of
the force interaction, between the corresponding
parti-cles pi and pj, is larger than fc. In our construction, we
decided to fill in the loops formed by three interacting particles, i.e. we include the triangle < vi, vj, vk > if the pairwise force interactions between the particles exceed
fc. Therefore the boundary of the loops detected by β1
must contain at least four edges.
While more elaborate tools from algebraic topology
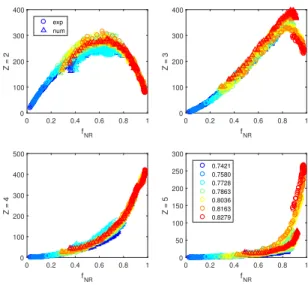
0 0.2 0.4 0.6 0.8 1 f NR 0 100 200 300 400 Z = 2 exp num 0 0.2 0.4 0.6 0.8 1 f NR 0 100 200 300 400 Z = 3 0 0.2 0.4 0.6 0.8 1 f NR 0 100 200 300 400 500 Z = 4 0 0.2 0.4 0.6 0.8 1 f NR 0 50 100 150 200 250 300 Z = 5 0.7421 0.7580 0.7728 0.7863 0.8036 0.8163 0.8279
FIG. 2. The evolution of the fraction of particles with contact number Z2,3,4,5 as a function of the fraction of
non-rattlers fN R, for both experiments (◦) and simulations (4)
for a range of φ’s (color scale). Numerical data color cod-ing has been increased by 0.015 in this and all the followcod-ing figures as discussed in the text.
have been used to quantify force networks in simula-tions [15, 16], in the present work we restrict ourselves
to the simple measures described above. The reasons
for this choice are twofold: (i) This method allows for a direct comparison of the statistical properties of force networks between simulations and experiments. To our knowledge, such comparison has not been attempted so far. (ii) These methods show potential for assessing the type and size of the noise present in the data [17].
Experimental Details The experiments involve shear of constant-density two dimensional packings of ∼ 1000 photoelastic bidisperse disks, starting from a stress free state. The packing density is given in terms of the pack-ing fraction, φ. The particles interact via force laws that include friction, and the result is that the applied strain shear-jams the packing [27]. This protocol allows one to probe a large range of mechanically distinct states, from very loose to highly jammed packings. In particu-lar, we use experimental data obtained in a simple shear geometry described in [19, 20] – see the Appendix for details. The particles rest on a co-moving, articulated base, that through its boundaries induces a linear shear profile, suppressing shear bands and other large scale in-homogeneities. We prepare packing fractions from 0.75 ≤ φ ≤ 0.825. We consider results for packings in the range 0.77 ≤ φ ≤ 0.825, where φ = 0.77 is the lowest packing fraction for which we achieve shear jammed states with this apparatus. We then quasi-statically shear the sys-tem by a sequence of 100 strain steps of 0.27% each, for a maximum strain of γ = 27% [19], and extract the infor-mation about all the forces the particles experience [20]. The force extraction algorithm is applied to each particle
individually. Hence, every contact between two parti-cles yields two force vectors. In the topological analysis
we use the average of the norms. Note that this
ap-proach has its limitations. First, there exists a lower
force threshold below which we cannot detect contacts. By examining the best contact number dynamics match with the numerics for a range of thresholds, we estimate this threshold to be ≈ 0.001N . Second, for larger pres-sures, P , we reach a force level such that deformations at contacts become large. We note that the force inverse al-gorithm assumes small deformations at contacts to make the process more efficient and becomes increasingly
inac-curate when fN R > 0.95 where deformations are large,
so we omit this (small) data set from the analysis where forces are involved. The exact value of this cutoff is not crucial for the present purposes. Furthermore, this is not an intrinsic limitation on the technique; however, since we are mostly interested in behavior near jamming where forces are moderate, amending current algorithms is not necessary.
Simulation Details Despite the simplicity of the nu-merical scheme, it is highly nontrivial to select the right packing preparation protocol. This sensitivity of granu-lar mechanics to initial preparation is well known even for frictionless systems [21] yet makes a direct comparison between numerical and experimental results very non-trivial. Note that regardless of the preparation proto-col chosen, the qualitative behavior observed was always similar; notably the collapse of all data sets as a
func-tion of fN Ris particularly robust. Two features however
required protocol fine tuning: the density range and off-set in which the shear jamming was observed and the network anisotropy. The contact number dynamics and pressure dynamics were not dependent on preparation.
The simulations use a soft-particle non-linear force model and reproduce the experimental settings as closely
as possible. The shear geometry, particle sizes and
numbers, friction coefficients, density and elastic mod-uli used in the numerical simulations match the exper-imental values as taken from the current data or pre-vious work [20, 27]. The inelasticity of the particles is modeled through a coefficient of restitution, frictional in-teraction between the particles using the Cundall-Strack model [22]. We also simulate a moving base, including translational and rotational friction between the base and the particles. The details of implementation can be found in the Appendix. The simulations reported here are car-ried out for the same values as for which we have exper-imental data. We show below that simulations produce results that are comparable to experiments.x
As we will discuss in more detail later, we add ran-dom noise to simulation data: all the figures in the paper include this additional noise, unless otherwise specified. Importantly, the essential results shown in Figs. 1 - 3 are insensitive to the noise addition.
Common features of experiments and simulations We extract particle positions and inter-particle forces for each particle at every 0.27% strain step, and we
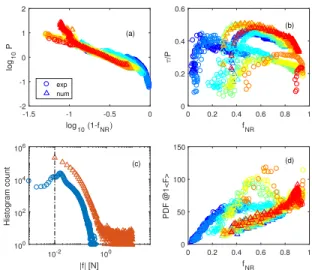
com--1.5 -1 -0.5 0 log10 (1-fNR) -2 -1 0 1 2 log 10 P (a) exp num 0 0.2 0.4 0.6 0.8 1 fNR 0 0.2 0.4 0.6 /P (b) 10-2 100 |f| [N] 100 102 104 106 Histogram count (c) 0 0.2 0.4 0.6 0.8 1 f NR 0 50 100 150 PDF @1<F> (d)
FIG. 3. (a) Pressure evolution versus 1-fN Rfor both
exper-iments (◦) and simulations (4). (b) Normalized anisotropy τ /P evolution as a function of fN R. (c) histogram of
con-tact force magnitudes |f | for all concon-tacts in the five runs at φ = 0.7863 for both numerics and experiments. The dashed line indicates the force noise added after the numerical runs were completed. (d) The probability distribution function of the norm of the contact forces P (|f|) as a function of fN Rfor
both experiments (◦) and simulations (4) for the force bin centered around 1.2h|f|i.
pute the local stress tensor σ using the Irving-Kirkwood method [23]. This provides the pressure from the sum
of its eigenvalues P = (σ1 + σ2)/2 the shear stress,
τ = (σ2− σ1)/2 and the stress anisotropy, τ /P . At each
φ, we carry out five realizations in both numerics and experiments, and average the results.
To illustrate the degree of agreement between experi-ments and simulations when conventional measures are considered, we start by exploring the average number of contacts per particle, Z. This is an important quantity
since there is a minimum or isostatic value of Z, Zisofor
marginal stability. For frictional particles, Ziso= N + 1,
where N is the system dimension, e.g. Ziso= 3 for 2D
frictional disks. If a system is sheared from zero stress
into a shear jammed state, Z must reach at least Ziso= 3
when the system becomes jammed. However, the parts of the force network that first form during the shear jam-ming process contain a number of particles with only two contacts. Hence, it is relevant to consider not only Z, but
also Zn(φ, γ), the fraction of particles with n contacts.
A key finding in [27] is that many properties such
as stresses and Z depend on fN R, in a universal way.
Here we show that fN Ralso determines the dynamics of
Zn(φ, γ). Figure 2 shows data for Z2,3,4,5vs. fN R. There
are two outstanding features in this data: (i) the
dynam-ics of each Zn collapses on a single curve, independent of
φ; and(ii) the agreement between experiments and ulations is quantitative. We thus conclude that the sim-ulations reproduce the experiments very well, and that
fN Rcan be used as an apparently universal state variable to describe the state of the system.
Figure 3 shows other conventional measures comparing the experimental and the numerical data: in Fig. 3a we see that the experimental pressure data for all φ’s col-lapse to a single curve. Furthermore, we find power law
scaling for P vs. 1 − fN R. Intuitively, the inverse
re-lation between P and fN R makes qualitative sense: the
larger the fraction of rattlers, 1 − fN R, the smaller the
pressure. However, the power law nature of this rela-tion is not trivial. For the simularela-tions, we also find an
excellent collapse of P vs. 1 − fN R, via a power-law,
although the dynamics deviates from power law scaling at large nonrattler fractions, and note a small deviation in the overall pressure scale. A quantitative magnitude agreement in particular in the pressure is sensitive to the choice of inclusion of rattlers, the force law used in the numerics and the area normalization choice in the Irving-Kirkwood formalism, and hence more challenging to get consistent among the experimental and numerical data
sets. However, the trends of fN R collapse and P (fN R)
are mostly insensitive to this.
Figure 3b shows the stress anisotropy, given by τ /P . We find an initial rapid increase of τ from the randomly prepared nominally isotropic stress-free initial state. Af-ter this transient, the anisotropy shows only a modest
decrease with fN Rfor both experiments and simulations,
while it remains nonzero. The decreasing trend is con-sistent with the observation that shear jammed states initially have a very anisotropic network, that evolves to-wards a more isotropic one with increasing strain. The agreement between experiments and simulations is only qualitative, but even though there is modest scatter in
the numerical data, the collapse with fN R is obvious.
Force Probability Distribution — A useful microscopic measure is the probability distribution function (PDF) of the norm of the contact forces P (|f|). Much work has been devoted to characterizing and understanding this distribution [24, 25] although isotropically compressed packings have been the primary focus of past work. Here
we examine P (|f|) vs. fN R, and contrast the
experimen-tal P (|f|) and numerical data. Figure 3c shows the prob-ability of finding a contact force of a certain magnitude in the entire data set at φ = 0.7863. The numerical and experimental histograms are again very similar; the only difference is most likely due to the use of a linear force law in the numerics, where the particles have a much more non-linear interaction. Regardless, the probability
distri-bution function again shows a good collapse with fN R. In
Figure 3d we show the bin with force range 1.1 − 1.2h|f|i. Two features are prominent: First, in both experimental
and numerical data, there are good collapses with fN R.
Second, experimental and numerical data are in
quan-titative agreement. The collapse with fN R is observed
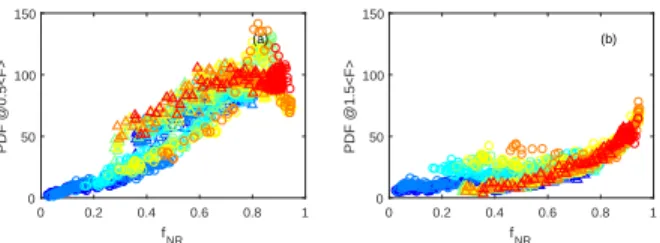
for other force bins; for example, we have verified that the same feature are observed for force bin centered on 0.5h|f|i and 1.5h|f|i (see Appendix).
The previous metrics have addressed either
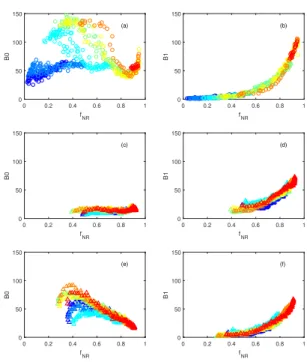
macro-0 0.2 0.4 0.6 0.8 1 fNR 0 50 100 150 B0 (a) 0 0.2 0.4 0.6 0.8 1 fNR 0 50 100 150 B1 (b) 0 0.2 0.4 0.6 0.8 1 fNR 0 50 100 150 B0 (c) 0 0.2 0.4 0.6 0.8 1 fNR 0 50 100 150 B1 (d) 0 0.2 0.4 0.6 0.8 1 fNR 0 50 100 150 B0 (e) 0 0.2 0.4 0.6 0.8 1 fNR 0 50 100 150 B1 (f)
FIG. 4. Betti numbers, β0(left) and β1(right), as a function
of fN Rfor both experiments (a,b: ◦) and simulations (c-f, 4).
(a,b) show original numerical data; (c,d) show the numerical data with 0.01N noise added.
scale or micro-scale structural properties, but do not pro-vide detailed information about the structure of force networks, such as those shown in Fig. 1. We now use topological metrics to analyze the properties of the net-work that describes the force interactions between the
particles with force magnitude larger than fc= 1.0h|f|i.
Figure 4a shows the resulting Betti number
dynam-ics for the experiments. β0 shows a plateau around 100
and subsequently a decrease. Simulations without added noise (Figure 4c) however, show very different results
with much smaller values of β0: they are essentially
inde-pendent of fN R. This observation is in a sharp contrast
to the findings for more conventional measures, for which experimental and numerical simulations showed at least a qualitative agreement. We see a similar difference in
the β1 dynamics in Figure 4b,d: the numerical data do
not seem to asymptote to β1= 0 in the limit of fN R→ 0.
The question is: what causes such a dramatic differ-ence in the numerical and experimental network prop-erties? To explain the larger number of the connected components present in the experimental data we propose the following mechanism. Consider the part of the con-tact network at which the particle interactions are a little
below fc. A slight increase of a single interaction in this
region will introduce a new connected component. On the other hand a slight decrease of single interaction, at the region where the interactions are just a little above
two pieces. Noise will thus affect topological features in the network. To explore this possibility, we add random noise to the simulations results. The random noise that we use is chosen from a flat distribution within the range of [0, 0.01]N that is consistent with the expected level of error in the experiments — see Fig. 3c. Note that after the noise is added to the contact forces, a small force in-balance may result on the particles. The non-zero mean of the added noise is motivated by the fact that we con-sider here a (positive definite) norm of the force vector.
After noise addition, the agreement between experi-mental and simulations improves significantly for both
β0 and β1. Figures 4e shows a monotonically
decreas-ing behavior of β0, much more in line with experimental
data. For β1 we observe quantitative agreement between
experiments and simulations. Again, for both β0and β1
we see a good collapse when we consider these quantities as functions of fN R.
Conclusions — In this paper, we have presented one of the first attempts to directly compare microscopic con-tact force level data from experiments and simulations of dense granular systems. We perform the comparison with metrics across the scales that range from micro to meso and macro. The comparison of micro and macro measures is mostly satisfactory. In particular, we find for both experiments and simulations that, when we express the contact number, pressure, anisotropy, or probability density function of the normal forces as a function of the
non-rattler fraction, fN R, we obtain collapse onto
mas-ter curves, capturing the dynamics over a wide range of conditions.
After finding good agreement for the quantities speci-fied above, it is perhaps surprising to see that the force network in the experiments and simulations, described by Betti numbers, are qualitatively different when raw data from simulations are considered. We argue that contact force noise can be of significant influence on mesoscopic network features, and test this by including adding artifi-cial noise to simulation results. We find that after adding noise of small magnitude, the mesoscopic Betti number dynamics is very similar between experiments and nu-merics.
On the one hand, the fact that noise influences the properties of force networks, but not classical micro and macro measures listed above is encouraging, since it sug-gests that the quantities that are commonly observable in granular experiments should not be influenced by typ-ical (experimental) noise. On the other hand, the fact that noise had to be added to simulation results to reach agreement with experiments suggests that direct compar-ison of the force network properties may be difficult to reach. However, sensitivity of the force networks’ proper-ties to noise opens the door towards the use of topological measures to quantify the experimental noise level and its properties, and to distinguish intrinsic fluctuations from experimental noise. Our future work should consider ad-ditional measures to provide even better understanding of the properties of force networks and their connection
to macroscopic response of particulate-based systems. Appendix
Methods: Experiments — We discuss here experimen-tal data obtained in a setup described in detail else-where [19, 20]. We expose ∼ 1000 bi-disperse photoe-lastic particles in a linear shear cell with articulated bot-tom. The articulated bottom shear induces linear shear profile, suppressing shear bands other inhomogeneities. We extract the local particle stress by either a nonlin-ear pattern-fitting algorithm discussed previously [26–28] that yields the complete contact network, particle forces,
and stress tensor (e.g. P and τ ), or via G2, the local
squared intensity gradient of the photoelastic response,
averaged on each particle. G2is a one-to-one function of
P on the particle level, and provides an easy measure for P . For small data sets, we use the former approach; for larger data sets, we use the latter approach to get only P . In addition to P and τ , we can probe the contact number dynamics with great accuracy: due to the pho-toelastic response of the disks, we can determine contacts with much more sensitivity than typical distance based metrics [11]. We can thus measure the fraction of
par-ticles with n contacts, which we describe with Zn. We
thus also have access to the number of non-rattlers fN R,
the particles that are in a force bearing network. Recent work showed [27] showed that this was an important mi-crostructural metric. We probe these structural metrics and force networks in shear jammed states by shearing the system. We prepared packings in a stress free ini-tial state, for 0.75 ≤ φ ≤ 0.825. We then quasi-statically shear the system by 100 small strain steps of 0.27%, up to a total strain of γ = 27% [19]. For the larger φ’s consid-ered here, we could not apply the full 27% strain because P became so large that the layer of disks was unstable to out-of-plane buckling. If buckling occurs, we termi-nate the shear experiment. At each packing fraction, we carried out the same shear experiments five times for re-producibility. Beyond a compression level of about 10
N/m or, equivalently, fN R = 0.95, the compression of
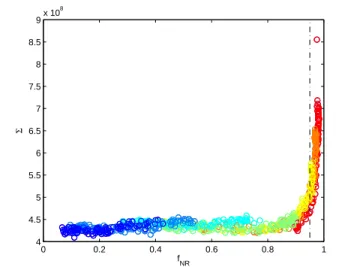
the disks is such that the visibly deform, and hence the force inversion method breaks down. We measure the quality of force extraction by calculating the total image difference between the original photoelastic images and their reconstructed equivalents, where the reconstructed image is based on the fitted contact forces. We show the
results in Fig. 7. At large fN R we can clearly see that
the image reconstruction becomes significantly different from the image as taken during the experiment, so we
omit all data from fN R> 0.95.
Methods: Numerics — We perform discrete element simulations using a set of circular disks confined in an initially rectangular domain. The number of the particles ranges from 910 up to 1050, depending on the packing fraction and is set exactly to the number of particles in the experiments. The walls are composed of monodis-perse disks. The domain is rectangular, and the length and width of the rectangle are 54 and 27 particle diam-eters, respectively. System particles are bidisperse and
0 0.2 0.4 0.6 0.8 1 4 4.5 5 5.5 6 6.5 7 7.5 8 8.5 9x 10 8 f NR Σ
FIG. 5. Integrated image difference Σ for the averaged ex-perimental runs at different densities (color coding, same as main paper). There is a constant background difference due to pixel level noise and other artifacts. The dashed line at fN R= 0.95 represents the cutoff we impose in the data
selec-tion in the main paper.
FIG. 6. Calibration curve from experiments (o) and curves using non-linear force model in Equation 1 with different δ.
the ratio of the diameters of the large and small par-ticles is ≈ 15.9/12.7. The exact positions and particle radii for all packing fractions and different realizations are taken from the initial conditions in the experiments. Particles are soft and interact via normal and tangential forces during collision, with static friction and viscous damping.
The force model used in the simulations is non-lienar; normal force between particles i and j is (see [29] for more details)
Fni,j= knxδn − γnx0.5mv¯ ni,j (1)
ri,j= |ri,j|, ri,j= ri− rj, n = ri,j/ri,j
kn=
2Y 3(1 − σ2)d
1−β ave
where 1 + β = δ, vni,jis set to the relative normal velocity
and Y and σ are Young’s modulus and Poisson ratio,
respectively. The amount of compression is x = di,j−ri,j,
where di,j = (di+ dj)/2; di and dj are the diameters
of the particles i and j and dave is the average particle
diameter. Here, ri, rj are the vectors pointing from the
centers of particles i, j towards the point of contact. The exponent δ in the force model is chosen to match the experimental calibration curve measuring the amount of compression of the photoelastic disk particle pressed by a steel plate with a given force. Figure 6 shows the
ex-perimental calibration curve and knxδ curves for chosen
values of δ with kn (dependent on δ, as specified in the
set of Equations 1) and Y = 3.45 GPa and σ = 0.5 set to match the experiments. We find that choosing δ = 1.625
yields the least square difference between knxδand
exper-imental calibration curve and therefore we use this value of δ in the force model for particle-particle interaction in the simulations.
Here, the characteristic lenghtscale is dave, the average
particle mass, ¯m, is the mass scale and the binary particle
collision time τc is the time scale. The value of τc is set
to [29] τc = α(1 + 0.5β) 1 2+β m¯3(1 − σ 2) 2Y d(1−β)ave !2+β1 v −β 2+β 0 (2)
where v0= 0.01423 ms−1is a characteristic magnitude of
velocity in the system (shearing speed); prefactor α and
damping coefficient γn is obtained as reported in [29].
We implement the commonly used Cundall-Strack model for static friction [22], where a tangential spring is introduced between particles for each new contact
that forms at time t = t0. Due to the relative motion
of the particles, the spring length, ξ, evolves as ξ = Rt
t0v t
i,j (t0) dt0, where vti,j= vi,j− vni,j. For long lasting contacts, ξ may not remain parallel to the current
tan-gential direction defined by t = vt
i,j/|vti,j| (see, e.g,. [30]);
we therefore define the corrected ξ0 = ξ − n(n · ξ) and
introduce the test force
Ft∗= −ktxβξ0− γtx0.5mv¯ ti,j (3)
where kt= 6/7kn (close to the value used in [31]), γt is
the coefficient of viscous damping in the tangential
direc-tion (with γt = γn). The value of µ = 0.7 is set to the
inter-particle friction from the experiments. To ensure that the magnitude of the tangential force remains below the Coulomb threshold, we constrain the tangential force to be
Ft= min(µ|Fn|, |Ft∗|)Ft∗/|Ft∗| (4)
and redefine ξ if appropriate.
In the force model, we include interaction with the
base. The force between the particle and the base
has a translational and a rotational component and the
particle-base friction coefficient is µb = 0.4,
of the deceleration of the particle in translational
direc-tion due to the fricdirec-tion with base is µb|g| where g is the
gravitational acceleration. The rotational deceleration of i-th particle due to friction with base
|αi| = 4 3µb |g| ri (5) is computed by integrating torque arising from friction with the base and using the moment of inertia of the disk,
I = (mir2i)/2, where mi, ri are the values of mass and
radius of the i-th particle, consecutively. For simplicity,
we use ri= 1/3davefor both small and large particles.
0 0.2 0.4 0.6 0.8 1 fNR 0 50 100 150 PDF @0.5<F> (a) 0 0.2 0.4 0.6 0.8 1 fNR 0 50 100 150 PDF @1.5<F> (b)
FIG. 7. Probability distribution function of contact forces for a force magnitude bin of 1.2h|f|i
FIG. 8. Pressure, log10(P ) and anisotropy, τ /P as a function
of log10(1 − fnr) and fnr, respectively.
We integrate Newton’s equations of motion for both the translation and rotational degrees of freedom using
a 4th order predictor-corrector method with time step ∆t = 0.02τc.
From the initial configuration taken from the exper-iments, the system is sheared by moving the left wall in positive and the right wall in the negative direction. Shearing speed used in the simulations, expressed in the units of dave/τc, is v00 = 2.5 × 10⁻⁵. Relaxation is in-terjected after each strain step of 0.27%. The maximum strain amplitude is 27%.
Consistency checks —
In this section we present consistency checks; specifi-cally, we focus on the distribution of the forces measured in both experiments and simulations for a different force bin than in the main body of the paper. Then we show that the particle-particle and particle-base friction is es-sential if we want to achieve a quantitative agreement between simulations and experiments.
In Figure 3d we show the probability distribution func-tion of contact forces for a force magnitude bin of 1.2h|f|i.
In Figure 7 we show that the fN R collapse and
consis-tency between experimental and numerical data is re-tained for the force bin around 0.5h|f|i (a) and 1.5h|f|i (b). Thus we conclude that our results comparing force distribution is not sensitive to the choice of the bin.
To demonstrate the importance of having a non-zero friction coefficient, we consider the dynamics of pressure and anisotropy for a few single runs with µ = 0.0 and
µb= 0.0 at various packing fractions around the jamming
point as observed in our protocol. Figure 8 shows P
and τ /P as a function of fnr for frictionless systems.
Evidently, our numerical protocol does not produce the
same fN Rdynamics as the experiments, even though the
pressure and anisotropy values remain within a similar
range in jammed systems (especially for large fN R).
Acknowledgments *JAD and LK contributed equally
to this work. This work was partially supported by
NSF-DMS-0835621, 0915019, 1125174, AFOSR Grant Nos. FA9550-09-1-0148, FA9550-10-1-0436 and DARPA (M.K., and K.M) HR0011-16-2-0033 (K.M, L.K, R.P.B) and NSF Grant No. DMS-0835611, and DTRA Grant
No. 1-10-1-0021; NSF Grants DMR-12063251 and
DMS1248071 and NASA grants NNX10AU01G and NNX15AD38G. MK was also supported by ERC project GUDHI (Geometric Understanding in Higher Dimen-sions).
[1] A. J. Liu and S. R. Nagel, Nature 396 21-22 (1998). [2] M. van Hecke, J. Phys. Cond. Matt. 22 033101 (2010). [3] B. Cambou, M. Jean and F. Radjai (eds.),
Micromechan-ics of Granular Materials (Wiley, 2009).
[4] R. Albert and A.L. Barabasi, Rev. Mod. Phys. 74, 47 (2002).
[5] S. Alexander, Phys. Rep. 296, 65 (1998).
[6] D.S. Bassett, E.T. Owens, K. E. Daniels and M.A. Porter, Phys. Rev. E 86, 041306 (2012)
[7] J.P. Peters, M. Muthuswamy, J. Wibowo and A. Torde-sillas, Phys. Rev. E 72, 041307 (2005)
[8] A. Tordesillas, D. M. Walker and Q. Lin, Phys. Rev. E 81 011302 (2010)
[9] G. Carlsson, J. Gorham, M. Kahle, J. Mason, Phys. Rev. E, 85, 011303 (2012).
[10] R. Arevalo, I. Zuriguel, L. A. Pugnaloni and D. Maza, Phys. Rev. E, 87, 022203 (2013).
Maza, Phys. Rev. E, 89, 052212 (2014). [12] L. Kondic et al, EPL 97 54001 (2012)
[13] M. Kramar, A. Goullet, L. Kondic, and K. Mischaikow, Phys. Rev. E 87, 042207 (2013).
[14] K. Mischaikow and V. Nanda, Disc. & Comp. Geom. 50 330 (2013).
[15] L.A. Pugnaloni, C. M. Carlevaro, M. Kram´ar, K. Mis-chaikow and L. Kondic, Phys. Rev. E 93 062902 (2016) [16] L. Kondic, M. Kram´ar, L. A. Pugnaloni, C. M. Carlevaro
and Mischaikow, K., Phys. Rev. E, 93, 062903 (2016) [17] O. Bobrowski, M. Kahle, To appear in: Topology in
Sta-tistical Inference, the Proceedings of Symposia in Applied Mathematics; arXiv 1409.4734 (2014) .
[18] D. Bi, J. Zhang, B. Chakraborty and R. P. Behringer, Nature 480 355-358 (2011).
[19] J. Ren, J. A. Dijksman, and R. P. Behringer, Chaos 21 041105 (2011) and at the online image gallery, Ameri-can Physical Society, Topical Group on Statistical and Nonlinear Physics (2011)
[20] J. Ren, J.A. Dijksman, R. P. Behringer, Phys. Rev. Lett. 110 018302 (2013).
[21] C. P. Goodrich, S. Dagois-Bohy, B. P. Tighe, M. van Hecke, A. J. Liu, and S. R. Nagel, Phys. Rev. E 90,
022138 (2014)
[22] P.A. Cundall and O.D.L. Strack. G´eotechnique 29 4765 (1979).
[23] J. H. Irving and J. G. Kirkwood. J. Chem. Phys. 18 817 (1950).
[24] B. P. Tighe and T. J. H. Vlugt, J. Stat. Mech. 2011 P04002 (2011).
[25] E. I. Corwin, H. M. Jaeger and S. R. Nagel, Nature 435 1075-1078 (2005)
[26] J. Zhang, T. Majmudar, A. Tordesillas, and R. P. Behringer, Granular Matter 12 159-172 (2010).
[27] D. Bi, J. Zhang, B. Chakraborty and R. P. Behringer, Nature 480 355-358 (2011).
[28] T. S. Majmudar, M. Sperl, S. Luding and R. P. Behringer, Phys. Rev. Lett. 98, 058001 (2007).
[29] Kondic L. Dynamics of spherical particles on a surface: Collision-induced sliding and other effects. Phys. Rev. E, 60 751 (1999).
[30] Brendel L. and Dippel S. in Physics of Dry Granular Media, edited by Herrmann H. J., Hovi J.-P. and Luding S. (Kluwer Academic Publishers, Dordrecht, 1998). [31] Goldenberg C., Goldhirsch I. Friction enhances elasticity