HAL Id: hal-02495550
https://hal.uca.fr/hal-02495550
Submitted on 2 Mar 2020
HAL is a multi-disciplinary open access
archive for the deposit and dissemination of
sci-entific research documents, whether they are
pub-lished or not. The documents may come from
teaching and research institutions in France or
abroad, or from public or private research centers.
L’archive ouverte pluridisciplinaire HAL, est
destinée au dépôt et à la diffusion de documents
scientifiques de niveau recherche, publiés ou non,
émanant des établissements d’enseignement et de
recherche français ou étrangers, des laboratoires
publics ou privés.
sedimentology
Loraine Gourbet, Rong Yang, Maria Giuditta Fellin, Jean-Louis Paquette,
Sean Willett, Junfeng Gong, Colin Maden
To cite this version:
Loraine Gourbet, Rong Yang, Maria Giuditta Fellin, Jean-Louis Paquette, Sean Willett, et al..
Evo-lution of the Yangtze River network, southeastern Tibet: Insights from thermochronology and
sed-imentology. Lithosphere, Geological Society of America, 2019, 12 (1), pp.3-18. �10.1130/L1104.1�.
�hal-02495550�
Evolution of the Yangtze River network, southeastern Tibet:
Insights from thermochronology and sedimentology
Loraine Gourbet1,*, Rong Yang2,*, Maria Giuditta Fellin1, Jean-Louis Paquette3, Sean D. Willett1, JunFeng Gong2, and Colin Maden1
1DEPARTMENT OF EARTH SCIENCES, ETH ZÜRICH, SONNEGGSTRASSE 5, 8092 ZÜRICH, SWITZERLAND
2SCHOOL OF EARTH SCIENCES, ZHEJIANG UNIVERSITY, HANGZHOU, ZHEJIANG PROVINCE 310027, CHINA
3LABORATOIRE MAGMAS ET VOLCANS, UNIVERSITÉ CLERMONT AUVERGNE, CNRS, IRD, OPGC, F-63000 CLERMONT-FERRAND, FRANCE
ABSTRACT
We performed apatite and zircon (U-Th)/He dating on a granitic pluton that has been offset by ~10 km by motion on the sinistral strike-slip Xiangcheng fault in SW Sichuan, SE Tibetan plateau, where the Shuoqu River incises a deep valley before joining the upper Yangtze River. Mean ZHe cooling ages range from 49.5 ± 2.2 Ma to 68.6 ± 6.0 Ma. Samples located above 3870 m yield mean apatite (U-Th)/He ages ranging from 30.6 ± 1.4 Ma to 40.6 ± 2.7 Ma, whereas samples at lower elevations range from 9.8 ± 1.3 Ma to 14.6 ± 2.7 Ma. In the same region, Cenozoic continental sediments are exposed on the flanks of deep valleys. They consist of unsorted conglomerates and sandstones that partly fill a paleotopography. The sediments were deposited during an episode of rapid sedimentation, followed by inci-sion that varies between 0.5 and 1.2 km. Thermal and exhumational modeling of the granite thermochronometric data indicates rapid cooling during the middle Miocene that was likely related to fluvial incision. Our findings suggest that the upper Yangtze River and its tributary (Shuoqu) were connected by the middle Miocene. Our modeling also supports the idea that the exhumation pattern during the Cenozoic in the southeastern margin of the Tibetan Plateau is spatially and temporally heterogeneous.
LITHOSPHERE; v. 12; no. 1; p. 3–18; GSA Data Repository Item 2019409 | Published online 12 December 2019 https://doi.org/10.1130/L1104.1
INTRODUCTION
The landscape on the southeastern margin of Tibet is characterized by narrow and deeply incised fluvial valleys (Fielding et al., 1994) with sharp bends close to faults. It transitions northward to the low-relief areas of the Tibetan Plateau and southwards into the lower-elevation reaches of Yunnan (Liu-Zeng et al., 2008). This landscape formed during the India-Asia collision in response to tectonic deformation and uplift (Brookfield, 1998; Clark and Royden, 2000). Several geodynamic models propose different mechanisms to explain the plateau formation, including homogeneous thickening (England and Houseman, 1986), lateral extrusion (Tap-ponnier et al., 2001), and lower-crustal flow (Royden et al., 1997). The landscape response to collision has been complex, including con-striction of drainage basin geometry (Hallet and Molnar, 2001), major river pattern reorganiza-tion (Clark et al., 2004; Yang et al., 2015), and progressive incision possibly reflecting late uplift (Clark et al., 2006). A key to understand-ing the processes associated with the formation
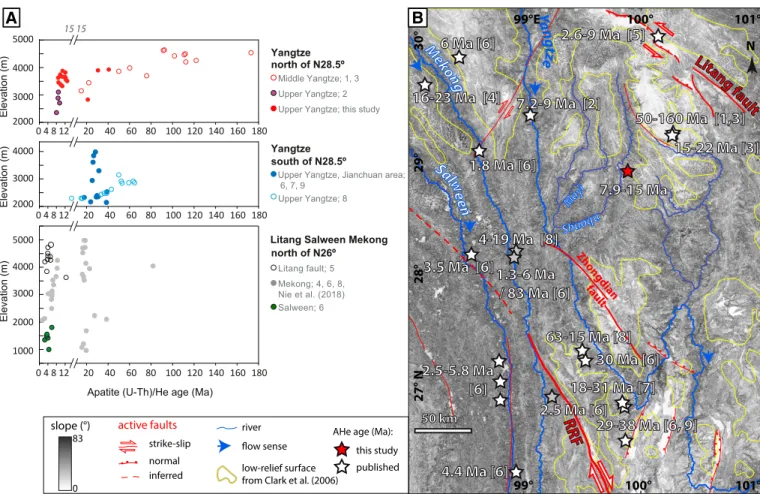
of this landscape is establishing the timing and amount of fluvial erosion. The southeastern margin of Tibet is drained by three main riv-ers: the Salween (Nu Jiang), Mekong (Lancang Jiang), and Yangtze (Chang Jiang; Fig. 1). Sev-eral studies based on different techniques have constrained erosion in several locations along these rivers at the million-year time scale (Clark et al., 2005; Ouimet et al., 2010; Wilson and Fowler, 2011; Duvall et al., 2012; Tian et al., 2014; Ping et al., 2015; Zhang et al., 2015; Shen et al., 2016; Yang et al., 2016; McPhillips et al., 2016; Liu-Zeng et al., 2018; Nie et al., 2018) and at the 1–100 k.y. time scale (Henck et al., 2011; Zhang et al., 2018). However, no clear pattern or single mechanism has emerged (see review by Zhang et al., 2019).
The Yangtze River is particularly intriguing because it has a complex course (Figs. 1 and 2A): Along its upper portion (Jinsha River), it flows southward and parallel to the Mekong and Sal-ween Rivers, and then it bends abruptly in the Yunnan highlands. There, it forms a V-shaped loop, called the Yangtze first bend, and becomes the middle Yangtze River flowing northward. It then bends again in northern Yunnan at latitude ~27.75°N to flow southward and then changes once again to flow eastward and northeastward
along the SE edge of the Sichuan Basin. Along its last portion, the lower Yangtze flows to the East China Sea. The paleocourse of the Yang-tze River has been discussed for more than a century (e.g., Abendanon, 1908; Gregory, 1929; Ting, 1933; Lee, 1934; Barbour, 1936; Ren et al., 1959; see review by Zheng, 2015). Recent geology studies on that topic are often based on thermochronometry and detrital sedimentology and aim at constraining the timing of fluvial incision and establishment of the river course.
Based on isotopic detrital data along the mid-dle Yangtze River, Zhang et al. (2017) placed a late Pliocene upper boundary for the estab-lishment of the modern river, whereas Zheng et al. (2013) suggested it occurred before the Miocene, based on detrital zircon age data along the lower Yangtze and near the Yangtze outlet. One of the main questions regarding the evolution of the Yangtze is a potential former connection between the upper Yangtze and the Red River, which would correspond to a paleo-Yangtze flowing southward (e.g., Clift et al.,
2006; Yan et al., 2012; Wei et al., 2016; Wis-sink et al., 2016; Chen et al., 2017; Gourbet et al., 2017). Near the Yangtze first bend, the Jianchuan Basin (JB in Fig. 2) contains fluvial sediments of Eocene age (Gourbet et al., 2017),
*Corresponding authors: loraine.gourbet@erdw .ethz.ch; royang1985@zju.edu.cn
which are interpreted as relicts of the Yangtze River (Clark et al., 2004). Provenance recon-structions based on detrital zircon ages from these sediments and from sediments near the Red River upper reaches indicate a main river flowing from the plateau interior southward dur-ing the Paleogene (Yan et al., 2012; Chen et al., 2017). These reconstructions are consistent with the hypothesis of major river modifications at 35–31 Ma based on isotopic data from paleo– Red River sediments in the Hanoi Basin (Clift et al., 2006). Other reconstructions, based on detrital zircon ages and on paleoflow directions from several basins, including the Jianchuan, Lijiang, and Yanyuan basins (Fig. 2), indicate no Cenozoic connection between the paleo– Yangtze River and paleo–Red River (Wei et al.,
2016; Wissink et al., 2016). The truncation of a hypothetic southward-flowing paleo–Yangtze River might have been due to the activation of the Ailao Shan–Red River fault during the late Eocene (Gourbet et al., 2017; Chen et al., 2017), thus leading to the modern upper Yangtze and Red River configuration. Other potential trig-gers for drainage reorganization are onset of regional surface uplift (Clark et al., 2004) or local volcanic activity (Zeng, 2002; Gourbet et al., 2017). Today, portions of the course of the
upper Yangtze follow active strike-slip faults. The river is offset by ~80 km by the left-lateral Xianshuihe fault (XF in Fig. 1; Gaudemer et al., 1989). Further south, the Batang fault right
later-ally deflects the river course for ~30 km (Fig. 2; Wang and Burchfiel, 2000). The Yangtze is also offset with a left-lateral sense for ~15 km by the Zhongdian fault (Fig. 2; Burchfiel and Wang, 2003), although this fault may have experienced a reversal in sense of slip (Perrineau, 2010).
Low-temperature thermochronometry can address the timing of incision and thus poten-tial reorganization events. However, many terranes along the main trunk of the Yangtze have lithologies with only rare apatite and zir-con, which limits the number of sites suitable for thermochronometric studies. Along the main upper Yangtze valley, Wilson and Fowler (2011) reported five apatite fission-track ages ranging from ca. 12 to 6 Ma, and Ouimet et al. (2010) reported four apatite (U-Th)/He (AHe) ages from an elevation transect ranging from ca. 9 to 7 Ma. In tributaries located a few kilometers west of the first bend, moderate river incision occurred from 18 to 9 Ma (McPhillips et al., 2016). However, in the same area, Yang et al. (2016) reported a late Eocene AHe age. Based on AHe ages ranging from 30 to 20 Ma, Shen et
al. (2016) proposed that incision occurred dur-ing the Miocene–early Oligocene, which was confirmed by new AHe and fission-track data by Cao et al. (2019), who showed a rapid exhuma-tion phase from 28 to 20 Ma. Downstream of the Yangtze first bend, in the Tiger Leap Gorge (TLG in Fig. 2), Lacassin et al. (1996) suggested that incision by the Yangtze was ongoing around 17.5 Ma during folding of an anticline, based on K-feldspar Ar-Ar thermochronometry.
Here, we focused on one of the tributar-ies of the upper Yangtze River, the Shuoqu River. It flows southward from the SE Tibetan Plateau into the upper Yangtze River (Fig. 2). About 70 km east of the Yangtze and over a
dis-tance of 40 km, the Shuoqu River flows along a granitic pluton and Cenozoic continental sedi-ments, crossing a strike-slip fault (called the Xiangcheng fault). In this study, we applied apatite and zircon (U-Th)/He (ZHe) thermo-chronometry to estimate cooling rates, which we used to quantify the erosion in the area. We combined these data with new observations of perched detrital sediments. Ultimately, we compared our results with published studies and extended our discussion to the regional geologi-cal evolution of the southeastern Tibetan Plateau. GEOLOGICAL AND
GEOMORPHOLOGICAL SETTING
The Xiangcheng area is located in SW Sich-uan, at the transition between the high-elevation, low-relief landscapes of the eastern Tibetan Pla-teau and the Yunnan highlands (Figs. 1A and 1B). Rivers flow either approximately SW toward the upper Yangtze reach, as is the case for the Shuoqu River, or approximately S/SE toward the middle Yangtze reach (Figs. 2 and 3). These rivers are more than 100 km long, in contrast to the short (10–20 km) eastward-flowing tributar-ies of the upper Yangtze reach, which drain the narrow area confined between the Mekong and Yangtze Rivers. Local relief around the city of Xiangcheng has a magnitude of nearly 2.5 km and a wavelength of >20 km (Fig. 2). In this area, the Shuoqu River is a dominantly bedrock river associated with a few quaternary alluvial terraces (Fig. 4).
The study area belongs to the Yidun arc (or Litang-Batang block; Fig. 2). To the west, it is separated from the Qiangtang block by the
Jin-sha suture zone (Şengör, 1985). To the east, it is
separated from the Songpan-Garzê block by the Garzê-Litang suture zone. The western Yidun arc is mostly composed of Paleozoic carbon-ates and volcanic rocks (Pan et al., 2004). It is considered to be a remnant of a passive margin that was formerly attached to the northern South China block. The eastern Yidun arc, where the
M ekon g Yangtze Salween Red R iver
TIBETAN
PLATEAU
HIMALAYA
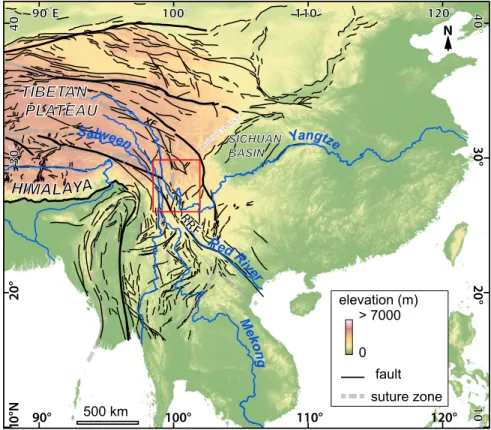
elevation (m) > 7000 0 SICHUAN BASIN fault suture zone XF Long men S han RRF 500 km N 90°E 100° 110° 120° 90° 100° 110° 120° 10°N 20° 30° 40° 40° 30° 20° 10°Figure 1. Topographic and tectonic framework of the India-Asia area. Faults are drawn after Valli (2005). Color is a function of elevation based on a 1-km-resolution Shuttle Radar Topog-raphy Mission (SRTM) data set. XF—Xianshuihe fault; RRF—Red River fault.
study area is located, is composed of Triassic continental and marine sandstones, slates, and limestones. Magmatic rocks are Late Triassic calc-alkaline volcanic-to-subvolcanic and plu-tonic rocks, and Cretaceous granites. Cenozoic continental sediments are rare, but they outcrop in the Yidun arc (Fig. 2; Pan et al., 2004). We describe these sediments in the “Sedimentology and Paleolandscape” section.
The Yidun arc experienced a complex defor-mation history. The closure of the Paleotethys ocean due to convergence of the Qiangtang, North, and South China blocks led to three subduction zones, including the Litang-Batang subduction (to the east) and the Jinsha subduc-tion (to the west), which were active during the Early-Middle Triassic (Wang et al., 2000). The study area is now sandwiched between the Qiangtang and the Songpan-Garzê blocks (Fig. 2). It is affected by approximately N-S– striking folding and thrusting related to the formation of an accretionary Triassic orogenic belt (Reid et al., 2005; Roger et al., 2008). Near the city of Xiangcheng, folds have an approxi-mately SSE-NNW axis and a kilometer-scale wavelength (Reid et al., 2005). The end of this deformation stage is characterized by unde-formed Late Triassic and Cretaceous plutons intruding the deformed sediments (Reid et al., 2005, 2007), including a granitic pluton we sam-pled for thermochronometry dating near the city of Xiangcheng (see “Sampling and Methods” section). This granite belongs to the so-called “Cilincuo intrusion” (Wang et al., 2008; Fei et al., 2009; Li et al., 2014; Wang et al., 2014), for which previous studies reported U-Pb ages ranging from the Late Jurassic to the Paleocene. Cu deposits in this intrusion were dated at ca. 79 Ma (U/Pb; Fei et al., 2015), whereas porphy-ritic granites with amphibole and biotite were
YIDUN ARC QIANGTANG SONGPAN-GARZE SOUTH CHINA INDOCHINA
A
A’
B
B’
27° N 28° 29° 30°
99°E 100° 101°
99° 100° 101°
Fig.4S
alw
ee
n
M
ek
on
g
Ya
ng
tze
Shuoqu May i Xiangcheng Litang TLG FB Batang LijiangLita
ng f
ault
JB
JianchuanYYB
LB
MB
Dongwang DaochengR
RF
Zh ongd ian fault Lita ng sutu re B atan g fa ult Jin sh a s ut ur e city suture active faults strike-slip normal inferredriver N 50 km flow sense Cenozoic fault Cenozoic sediments crustal block Cretaceous-Jurassic volcanic and sedimentary rocks Triassic volcanic and sedimentary rocks plutonic rocks Cenozoic Cretaceous-Jurassic Triassic Paleozoic-Proterozoic Ailao Shan-RRF metamorphic belt YIDUN
A
4500 4000 3500 3000 2500 2000 0 40 80 120 160Distance (km)
2000 2500 1500 3000 3500Elev
ation (m)
Elev
ation (m)
NW SEupper Yangtze Shuoqu River
Batang fault
Mekong Yangtze
Yangtze first bend Mayi River
Jianchuan
basin Red River fault
A A’
B B’
Yangtze drainage area
Yangtze drainage area
B
Figure 2. (A) Close-up of Figure 1 showing a geological map of the SE Tibetan Plateau with locations of the major faults and the main Ceno-zoic sedimentary basins (Quaternary deposits are not shown) superimposed on a shaded relief map based on 30-m-resolution Shuttle Radar Topography Mission (SRTM) data. Terranes are based on BGMR (1991) and Pan et al. (2004). Faults are drawn after Tapponnier and Molnar (1977), Perrineau (2010), and Chevalier et al. (2016). JB—Jianchuan Basin; LB—Lijiang basin; MB— Mula Basin; YYB—Yanyuan basin; FB—first bend of the Yangtze River; TLG—Tiger Leap Gorge area; RRF—Red River fault. Topographic cross-sections A-A′ and B-B′ are indicated by gray dotted lines. (B) Topographic cross sections across the study
area (A-A′, upper panel) and in the Jianchuan
area (B-B′, lower panel) with locations of active
faults. The gray rectangle on A-A′ indicates the
dated at 147 ± 4.6 Ma (U/Pb on zircon; Wang et al., 2008). However, Wang et al. (2008) did not provide the geographical coordinates of the samples, and the location of this early intrusion is uncertain. Last, Li et al. (2014) quoted ages of 98 and 51 Ma from the Yunnan Geological Survey without providing the dating method nor the sample locations. Thus, the Cilincuo intru-sion could actually consist of multiple intruintru-sions, and in order to avoid ambiguities, we define the Cilincuo massif as the granitic massif compris-ing these intrusions.
After a period of relatively limited tectonic activity during the Jurassic–Cretaceous (Roger et al., 2010), deformation resumed following the India-Asia collision and subsequent E-W shortening. Cenozoic deformation in SE Tibet is characterized by EW/SW-NE shortening (Lacassin et al., 1996) and active approxi-mately NW-SE strike-slip faulting (Tapponnier and Molnar, 1977). The Cenozoic shortening affected continental basins, which show con-tractional structures coeval with sedimentation
(Horton et al., 2002), and possibly consisted of two distinct phases at ca. 36 Ma and ca. 17 Ma (Lacassin et al., 1996). In the Mula Basin (MB in Fig. 2A), Jackson et al. (2018) reported NE-SW– oriented thrust faults that are either at the basin boundary or in the basin and affect sediments that are younger than ca. 45.5 Ma and possi-bly early Oligocene in age. In the late Eocene Jianchuan Basin (JB in Fig. 2A), sediments are affected by folds with an approximately N-S axis consistent with approximately E-W shortening (Bureau of Geology and Mineral Resources [BGMR], 1991; Gourbet et al., 2017). The main active strike-slip faults in the area are the left-lateral Litang fault in the Yidun arc (Wang and Burchfiel, 2000; Zhang et al., 2015) and the major Red River fault further south (Leloup et al., 1993; see Fig. 2). The latter was involved in the lateral extrusion of continental blocks (first the Indochina block and then the South China block; Tapponnier et al., 2001). The left-lateral Xiangcheng fault extends along a distance of ~50 km (Fig. 3). It is not clear
where it ends, especially toward the southeast portion. The Shuoqu and Mayi Rivers seem to be left-laterally deflected along the fault, which may indicate that the fault is active. Moreover, two recent ~10-km-deep, 3–4 Ms earthquakes (Fig. 3) have occurred in the vicinity of the fault (csndmc.ac.cn; earthquake.usgs.gov). However, as microseismicity is ubiquitous in the Tibetan Plateau, these earthquakes do not prove the fault activity, which remains unclear.
SEDIMENTOLOGY AND PALEOLANDSCAPE
About 40 km south of Xiangcheng, Cenozoic clastic sediments, or red beds (Pan et al., 2004), are preserved near the village of DongWang (site 4, Fig. 3). The term “red beds” is widely used in the literature to describe Cenozoic sedi-ments in Tibet; here, we only use this term to refer to the ones in the Xiangcheng area. The red beds are exposed on the flanks of deeply incised valleys, where most of the bedrock is
S
alw
ee
n
M
ek
on
g
Ya
ng
tze
Shuoqu MayiLita
ng f
ault
R
RF
Zh ongd ian fault7.2-9 Ma [2]
2.6-9 Ma [5]
16-23 Ma [4]
4-19 Ma [8]
1.3-6 Ma
/ 83 Ma [6]
6 Ma [6]
18-31 Ma [7]
50-160 Ma [1,3]
15-22 Ma [3]
63-15 Ma [8]
29-38 Ma [6, 9]
30 Ma [6]
1.8 Ma [6]
2.5 Ma [6]
4.4 Ma [6]
2.5-5.8 Ma
[6]
3.5 Ma [6]
7.9-15 Ma
27° N 28° 29° 30° 99° 100° 101° 99°E 100° 101° 50 km N active faults strike-slip normal inferred river flow senseAHe age (Ma): this study published low-relief surface
from Clark et al. (2006)
slope (°) 83 0 2000 3000 4000 5000 15 15 Elevation (m)
Apatite (U-Th)/He age (Ma)
2000 3000 4000 Elevation (m) 20 40 60 80 100 120 140 160 180 1000 2000 3000 4000 5000 0 4 8 12 Elevation (m) 20 40 60 80 100 120 140 160 180 0 4 8 12 20 40 60 80 100 120 140 160 180 0 4 8 12 Yangtze Yangtze
Litang Salween Mekong north of N28.5º
south of N28.5º
Middle Yangtze; 1, 3 Upper Yangtze; 2 Upper Yangtze; this study
Upper Yangtze; 8
Upper Yangtze, Jianchuan area; 6, 7, 9 north of N26º Litang fault; 5 Mekong; 4, 6, 8, Nie et al. (2018) Salween; 6
A
B
Figure 3. (A) Published thermochronometry data discussed in the text, with mean apatite (U-Th)/He (AHe) ages plotted vs. elevation. (B) Simplified version of Figure 2A along with the locations of thermochronometric studies and same thermochronometry data as in A. Numbers in brackets refer to published apatite (U-Th)/He ages: 1—Clark et al. (2005); 2—Ouimet et al. (2010); 3—Tian et al. (2014); 4—Ping et al. (2015); 5—Zhang et al. (2015); 6—Yang et al. (2016); 7—Shen et al. (2016); 8—Liu-Zeng et al. (2018); 9—Cao et al. (2019). Data are from Nie et al. (2018) in the upper and lower reaches of the Mekong. RRF—Red River fault.
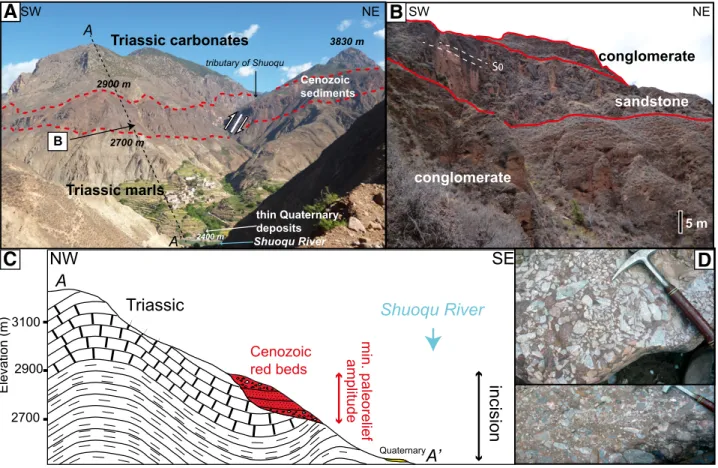
composed of intensively folded Triassic marls and limestones (Fig. 3). The Cenozoic red beds consist of medium-grained sandstones and con-glomerates. From bottom to top, the strata show
an alternation of red conglomerates (Ed1),
sand-stones (Ed2), and conglomerates (E
d3). Sediments
are slightly deformed; they are gently folded, but in some places, they are mapped as horizontal (BGMR, 1991). We observed planar sandstone bedding in places. Thrust-related deformation affects the sediments over a few tens of meters (Fig. 5A). The contact between the red beds and the underlying Triassic bedrock corresponds to an angular unconformity, above which the red beds unconformably rest on Triassic marls and
partly fill a paleorelief that existed prior to depo-sition of the red beds (Fig. 5C). The sedimentary unconformity appears at several locations in the DongWang area (Fig. 4). However, according to BGMR (1991), the westernmost red beds are bounded by a west-dipping, N-S–oriented thrust fault, with the Triassic units overthrusting the Cenozoic red sediments (Fig. 4). Tectonic control on Cenozoic sedimentation has been reported elsewhere in SE Tibet, including the Mula Basin (Jackson et al., 2018). Thus, it is pos-sible that the deposition of the red beds was (at least partly) controlled by the local thrust fault identified by BGMR (1991). Today, the red beds are cut by the Shuoqu River and its tributaries.
Incision is highly variable if it is inferred from the elevation difference between the top uncon-formity of the Cenozoic deposits and the valley bottom. For example, directly above the hamlet in Figure 3, the incision is ~500 m, whereas it can be up to 1200 m further east.
The red beds belong to the Dongwang formation, which is attributed to the Eocene– Oligocene (Zhang, 2009; Yunnan Regional Geological Survey Team, 1982). According to
BGMR (1991), minimum thicknesses of Ed1,
Ed2, and Ed3 sediments are 237, 288, and 479
m, respectively. Conglomerates consist of a red sand-gravel mixture matrix, unsorted clasts, and boulders of a few centimeters to decimeters in size. Boulders are angular to subrounded, sug-gesting limited transport, and are apparently solely composed of limestone (Fig. 5D), likely originating from the surrounding Triassic peaks or at least coming from a local source. These sediments do not correspond to a large riverbed, but rather indicate a short episode of intense sed-imentation with a significant contribution from the talus, in a fluvial environment. The cause of this episode is unclear and may have been related to the activation of the local thrust fault mentioned above. This hypothesis is consistent with a local sedimentary source. The Triassic marls and limestones are well constrained in age because of their fossil record (BGMR, 1991). However, to our knowledge, there is no abso-lute nor relative age constraint on the Cenozoic red beds that would allow us to directly infer an incision rate from the incision amount we observed in these sediments. Because Cenozoic continental sediments are difficult to date, the difference between the assumed and revised depositional age in SE Tibet can reach more than 20 m.y. (Gourbet et al., 2017; Linnemann et al., 2018). As a consequence, we cannot esti-mate an incision rate based on the age of the red beds, and so we simply used the observed range of 0.5–1.2 km as an estimate for the total incision since deposition.
SAMPLING AND METHODS Sampling Strategy
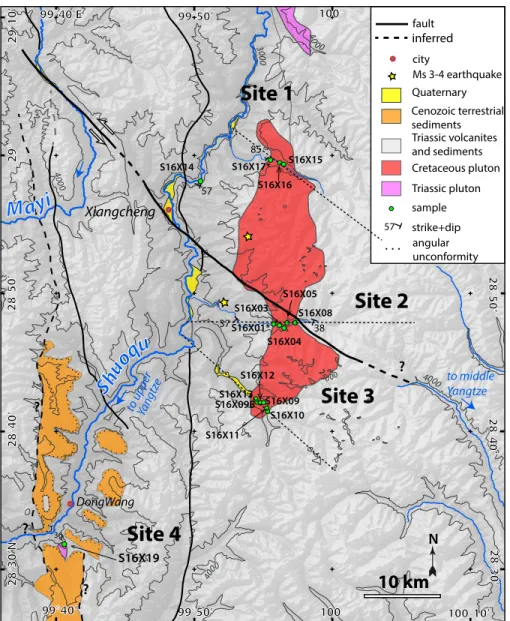
We collected granite samples mainly at three locations in the Cilincuo massif (Figs. 2 and 4;
Data Repository Table ST11): site 1 at its
north-ern edge, site 2 directly south of the strike-slip
1 GSA Data Repository Item 2019409, field
observa-tions and samples locaobserva-tions, isotopic data for zircon U-Pb dating, an assessment of error and data disper-sion of (U-Th)/He ages, and additional thermal models discussed in the main text, is available at http://www .geosociety.org /datarepository /2019, or on request
from editing@geosociety.org. . . . . . . . . . . . . . . . . . . . . . . . . . . . . . . . . . . . . . . . . . . . . . . . . . . . . . . . . . . . . . . . . . . . . . . . . . . . . . . . . . . . . . . . . . . . . . . . . . . . . . . . . . . . . . . . . . . . . . . . . . . . . . . . . . .. . . . . . . . . . . . . . . . . . . . 30 00 40 00 5 000 4000 4 000 4000 28°50’ 28°40’ 29° 29°10’ 99°50’ 100° 100°10’ 99°40’ 28°40’ 28°50’ 99°50’ 100° 99°40’E 28°30’N 28°30’ fault city Ms 3-4 earthquake Triassic volcanites and sediments Quaternary Cretaceous pluton sample strike+dip inferred Triassic pluton angular unconformity . . . Cenozoic terrestrial sediments
10 km
N 57Sh
uo
qu
XiangchengSite 1
Site 2
Site 3
to u pper Yang tze to middle Yangtze ? ? ?Site 4
? DongWangMayi
37 38 57 85 36 . S16X17* S16X16 S16X15 S16X01* S16X14 S16X03 S16X04 S16X08 S16X05 ( S16X13 S16X10 S16X11 S16X09 S16X12 S16X09B S16X19Figure 4. Map of the Xiangcheng area. Shaded relief is based on an ~30-m-resolution Shuttle Radar Topography Mission (SRTM) data set. Mapping is based on our own observations, LAND-SAT images, and BGMR (1991). *See Data Repository Figure S1. Note that at site 4, we did not observe the contact between the Triassic granite and the Cenozoic sediments. The dotted lines perpendicular to the Shuoqu River correspond to the elevation profiles on Figure 7.
Xiangcheng fault, and site 3 at its southern edge. For site 1, samples were distributed over a dis-tance of 1.7 km and ~160 m of elevation; for site 2, samples were distributed over a distance of 2.6 km and ~270 m of elevation; for site 3, samples were distributed over a distance of 2 km and ~550 m of elevation. We also collected a sandstone sample (S16X14) located near the valley floor along the main N-S road, ~8 km west of the intrusive contact, for thermochrono-metric dating. We collected an additional single granitic sample, S16X19, further south in site 4 for U-Pb and (U-Th)/He dating.
U-Pb Dating of Zircon
U/Pb dating was performed by laser ablation– inductively coupled plasma–mass spectrometry (ICP-MS) at the Laboratoire Magmas et Volcans, Clermont-Ferrand, France. The analytical results are presented in the Data Repository (Table ST1). Zircons were ablated using a Resonetics Resolu-tion M-50 laser system operating at a wavelength of 193 nm coupled to a Thermo Element XR ICP-MS. Helium carrier gas was supplemented
with N2 prior to mixing with Ar for sensitivity
enhancement (Paquette et al., 2014). The laser was operated with a spot diameter of 27 μm, a repetition rate of 3 Hz, and a fluence of 2.5 J/
cm2. Instrumental operating conditions and data
acquisition parameters are basically similar to those reported in Hurai et al. (2010). Reduction of raw data was carried out using the GLIT-TER® software package (Van Achterbergh et al., 2001). Isotope ratios were corrected for laser-induced and instrumental mass fraction-ation via sample-standard bracketing using the GJ-1 zircon (Jackson et al., 2004). Data were
not corrected for common Pb. The 207Pb/206Pb
versus 238U/206Pb diagram was generated using
the Isoplot/Ex v. 2.49 software of Ludwig (2001). Error ellipses for each point are shown at the 2s level and incorporate both internal and external uncertainties. Data points were pooled to
calcu-late a date and associated 2s error. The 91500
zircon reference material (Wiedenbeck et al., 1995) was analyzed along with the samples to
independently monitor the external precision and accuracy of the measurements. The concordia age for 132 analyses of 91500 zircon conducted over the course of the study was 1063.9 ± 2.4 Ma (2s, including decay constant errors).
(U-Th)/He Thermochronometry
The (U-Th)/He method allows assessment of the timing of cooling of a rock from relatively low temperatures to ambient surface conditions.
For apatite, the nominal closure temperature (Tc)
of the (U-Th)/He system is ~65 °C (Shuster et al., 2006). The partial retention zone (PRZ) for apatite spans from 40 °C to 85 °C (Wolf et al., 1998). He diffusivity can be altered by several factors, including the accumulation of radiation
damage, which in turn causes Tc to span from
45 °C to 120 °C (Shuster et al., 2006;
Flow-ers et al., 2009). For zircon, Tc is ~180 °C at a
cooling rate of 10 °C/m.y. (Reiners, 2005) and varies from 140 °C to 220 °C depending on the self-irradiation dose (Guenthner et al., 2013); the PRZ for zircon spans from 80 °C to 180 °C (Ehlers et al., 2005). Thus, combining apatite (U-Th)/He and zircon (U-Th)/He (AHe and ZHe) dating provides information on the exhu-mation processes in the upper 6 km of the crust at medium geothermal gradients (~30°/km).
All (U-Th)/He analyses were performed at the Institute of Geochemistry and Petrology, ETH Zürich, and are summarized in Table 1. We
SW NE Triassic carbonates Shuoqu River thin Quaternary deposits 2400 m 3830 m Triassic marls Cenozoic sediments 2900 m 2700 m A A’ B tributary of Shuoqu SW NE 5 m conglomerate conglomerate sandstone S0 . . . . . . . . . . . . . . . . . . . . . . . . . . . . . . . . . . . . . . . . . . . . . . . . . . . . . . . . . . . . . . . . . . . . . . . . . . . . . .
_ _
II
I
I
I I I I I I II
I
I
II
II
II
I
I I I I I II
I
I
I
I I I I I I I II
I
I
I
I
I
I
I I I I II
I
I
I_
_
_
_
_
_
_
_
_
_
_
_
_
_
_
_
_
_
_
_
_
_
_
_
_
_
_
_
_
_ _
_
_
_
_
_
_
_
_ _
_
_ _
_
_
_
_
_
_
_
_ _
_
_
_
_
_
_
_
_ _ _ _
_
_ _ _ _
_
_ _ _
_
_ _ _ _
_ _ _
Shuoqu River
NW SE
Triassic
Cenozoic red beds QuaternaryA’
A
min. paleorelief amplitudeincision
Elevation (m) 3100 2900 2700A
B
D
C
Figure 5. (A) Shuoqu valley landscape at site 4 showing detritus unconformably resting on Triassic bedrock and incised by the Shuoqu River and its tributaries. Farmed fields rest directly on Triassic marls. (B) Close-up of the Cenozoic red beds (Dongwang formation). (C) Sim-plified cross section. Vertical exaggeration is 1.5. (D) Conglomerates with angular (top) or partly rounded (bottom) limestone boulders.
TABLE 1. ANALYTICAL RESULTS OF APATITE AND ZIRCON (U-Th)/He DATING Sample Grain Grain mmass 238U
(fmol) 232Th(fmol) (ppm)eU 147Sm(fmol) (fmol)He Raw age(Ma) Rs* FT Corr. age(Ma) 1σ± Mean age(Ma) Stdv † Apatite Site 1 S16X15 x 1.94 331 895 66 873 5.1 7.28 42 0.74 9.84 0.032 11.42 1.06 y 1.13 139 245 41 415 2.2 8.71 36 0.73 11.96 0.041 z 0.81 215 503 98 426 3.3 7.62 32 0.65 11.82 0.056 w 1.92 454 1309 94 1016 8.6 8.73 41 0.72 12.06 0.067 S16X16 x 1.77 432 1111 93 1036 9.0 10.09 40 0.72 13.96 0.036 13.10 1.33 y 1.28 282 615 79 652 5.5 10.00 37 0.71 14.05 0.039 z 4.25 384 789 32 1434 6.9 9.29 56 0.83 11.19 0.034 w 2.76 509 1141 67 1172 10.3 10.24 49 0.78 13.21 0.056 S16X17 x 0.58 127 240 75 296 2.7 11.28 28 0.64 17.68 0.073 14.59 5.32 y 2.56 636 1286 87 1055 8.3 6.84 45 0.74 9.21 0.030 z 2.61 455 773 58 824 12.9 15.73 48 0.77 20.41 0.060 w 1.63 194 202 35 404 2.6 8.44 41 0.76 11.05 0.089 Road S16X14 x 0.67 8 115 12 249 0.6 13.18 27 0.70 18.75 0.134 21.10 6.88 y 0.61 47 236 39 252 1.3 10.16 29 0.65 15.70 0.100 z 0.63 59 95 30 118 1.9 18.42 28 0.64 28.84 0.125 Site 2 S16X08 x 1.53 299 802 76 1308 22.2 34.99 41 0.76 45.74 0.12 40.59 4.73 y 0.72 104 260 54 446 5.4 25.35 31 0.70 36.43 0.12 z 3.75 586 976 52 1921 34.8 32.76 54 0.83 39.60 0.11 S16X05 x 0.90 140 294 55 400 5.8 21.34 33 0.70 30.60 0.11 30.58 2.82 y 1.48 169 666 52 700 8.5 20.07 38 0.72 27.73 0.10 z 2.13 588 1686 109 1722 33.2 26.06 45 0.76 34.42 0.09 w 1.40 191 146 38 375 6.7 22.83 41 0.77 29.58 0.15 S16X04 x 1.20 350 891 110 739 6.4 8.85 37 0.69 12.82 0.04 12.81 0.80 y 4.12 331 392 24 1084 5.4 9.86 49 0.82 12.01 0.03 z 0.73 218 370 99 484 3.5 8.92 30 0.66 13.61 0.05 S16X03 x 1.39 339 1021 99 1039 7.1 9.47 36 0.70 13.52 0.05 9.76 2.66 y 0.49 101 242 76 346 1.1 5.12 27 0.63 8.13 0.04 z 1.39 377 1004 104 1185 5.5 6.96 37 0.71 9.74 0.04 w 1.38 79 85 17 312 0.8 6.05 39 0.79 7.64 0.12 S16X01 x 1.65 383 1181 95 1319 7.3 8.56 38 0.72 11.85 0.04 11.85 0.04 Site 3 S16X10 x 2.95 397 370 39 1217 4.5 7.08 50 0.83 8.54 0.03 10.31 2.25 y 1.53 557 646 111 939 7.3 7.96 39 0.73 10.91 0.04 ybis 2.77 546 770 62 1376 9.8 10.42 46 0.79 13.25 0.03 z 3.92 564 621 43 1325 6.5 7.06 54 0.82 8.55 0.03 S16X11 y 1.58 488 1311 119 1135 4.5 4.39 38 0.70 6.25 0.02 8.08 1.95 z 3.95 853 2838 91 2636 15.5 7.89 51 0.78 10.13 0.03 zbis 4.02 395 817 35 8717 5.0 6.59 56 0.84 7.86 0.03 S16X09B x 3.99 487 954 42 1591 6.3 6.79 53 0.82 8.31 0.03 7.85 2.63 y 1.54 292 651 69 877 4.0 6.95 39 0.74 9.41 0.04 z 2.70 237 873 39 962 4.3 7.59 49 0.78 9.68 0.03 w 2.95 181 250 19 746 1.0 3.30 48 0.82 4.01 0.05 S16X12 x 1.17 328 690 99 846 3.3 5.16 34 0.69 7.42 0.04 8.21 1.29 y 3.24 547 603 51 1523 7.2 7.99 51 0.82 9.72 0.04 z 1.21 507 1042 147 1355 6.2 6.34 37 0.72 8.80 0.03 w 2.10 429 1239 81 1117 4.8 5.15 44.4 0.75 6.88 0.03 S16X09 x 1.10 328 675 105 760 2.9 4.59 36 0.70 6.53 0.03 8.53 0.93 y 2.73 486 1202 67 1415 7.2 7.21 49 0.78 9.20 0.03 z 1.70 178 303 35 694 2.7 8.40 41 0.78 10.77 0.05 w 1.73 111 215 22 290 1.2 5.63 39 0.74 7.62 0.11 S16X13 x 2.16 625 1817 115 1764 12.0 8.87 40 0.72 12.26 0.04 10.05 2.92 y 1.89 282 626 47 866 2.9 5.23 42 0.76 6.90 0.03 z 1.90 610 1828 129 1622 12.6 9.40 42 0.74 12.79 0.04 w 3.08 269 521 30.15 832 3.4 6.63 51 0.81 8.24 0.07 Site 4 S16X19 x 0.40 19 78 22 75 0.4 8.75 25 0.58 15.18 0.16 26.34 15.8 y 2.28 466 1386 82 1167 28.6 28.01 44 0.75 37.50 0.13 (continued)
TABLE 1. ANALYTICAL RESULTS OF APATITE AND ZIRCON (U-Th)/He DATING (continued) Sample Grain Grain mmass 238U
(fmol) 232Th(fmol) (ppm)eU 147Sm(fmol) (fmol)He Raw age(Ma) Rs* FT Corr. age(Ma) 1σ± Mean age(Ma) Stdv † Zircon Site 1 S16X15 a 4.53 12406 9069 766 1032 54.91 50.5 0.8 71.8 0.53 61.58 14.08 b 3.46 23499 5755 1721 1090 33.90 44.6 0.7 45.5 0.37 c 5.21 14845 6933 756 1096 51.43 49.4 0.8 67.4 0.36 S16X16 a 5.18 19791 9323 1013 1767 62.07 48.3 0.8 81.9 0.38 66.77 9.288 b 2.79 12227 4908 1148 754 43.58 36.3 0.7 63.6 0.39 c 6.67 17005 9066 685 1361 54.97 55.1 0.8 70.0 0.36 S16X17 a 3.29 7462 3106 596 549 51.76 42.9 0.7 70.8 0.47 65.80 4.679 b 4.62 8219 3284 465 566 48.66 46.1 0.7 65.0 0.39 c 2.50 13712 3964 1401 825 43.51 38.7 0.7 61.6 0.84 Road S16X14 a 4.39 2359 516 135 1 114.41 27.3 0.8 152.1 1.11 146.18 8.322 b§ 1.52 2304 802 392 1 119.34 29.3 0.7 175.6 0.87 c 1.39 1278 259 230 2 91.64 28.4 0.7 140.3 0.84 Site 2 S16X08 a 2.92 10561 4405 945 639 42.62 41.2 0.7 59.1 0.28 62.98 11.07 b 4.03 20145 9733 1316 1189 41.01 47.6 0.8 54.3 0.24 c 3.23 9512 4762 785 771 56.02 45.2 0.7 75.5 0.44 S16X05 a 2.34 8024 3523 903 508 44.33 37.7 0.7 63.7 0.62 b 1.81 4828 3195 735 491 68.03 36.9 0.7 99.2 c 2.63 11365 5217 1146 2182 132.97 41.5 0.7 184.3 S16X04 a 4.81 10786 6763 585 561 35.12 41.2 0.8 45.6 0.49 49.48 3.879 b 1.06 4595 2041 1148 223 34.03 47.6 0.6 53.4 0.27 c 2.05 8784 2687 1091 425 34.92 45.2 0.7 49.4 0.36 S16X03 a 2.99 10022 4363 883 636 44.52 43.7 0.7 60.6 0.73 53.02 10.3 b 5.01 11546 5756 615 531 31.86 51.4 0.8 41.3 0.53 c 1.19 6183 4651 1459 349 37.11 32.8 0.6 57.2 0.63 Site 3 S16X10 a 2.28 9454 6041 1136 652 46.41 40.0 0.7 65.5 0.40 66.88 1.993 b 2.92 13719 6315 1243 948 48.21 43.1 0.7 65.9 0.55 c 2.29 7146 2755 804 485 48.05 37.3 0.7 69.2 0.20 S16X11 a 2.84 8982 4658 846 565 43.36 42.5 0.7 59.7 0.50 63.01 4.738 b 5.50 11654 7525 583 891 51.35 52.5 0.8 66.4 0.56 c§ 1.92 4783 2995 681 393 55.43 37.9 0.7 79.9 0.73 S16X09B a 1.52 7982 3191 1371 466 41.27 34.3 0.7 61.6 0.37 58.73 6.21 b 1.54 7568 2689 1221 375 35.41 36.1 0.7 51.6 0.34 c 4.94 19074 10609 1036 1359 48.71 52.1 0.8 62.9 0.24 S16X12 b 7.47 31248 15556 1116 2338 51.77 56.2 0.8 65.5 0.28 64.57 1.327 c 3.57 13868 7281 1044 965 47.92 47.4 0.8 63.6 0.44 S16X09 a 2.54 8571 4304 900 529 42.71 40.6 0.7 59.7 1.02 60.06 1.963 b 3.91 8412 6075 601 567 44.64 41.9 0.7 62.2 0.52 c 4.38 21451 8494 1280 1354 44.65 49.7 0.8 58.3 0.19 S16X13 a 5.26 17097 5762 840 943 39.50 53.2 0.8 50.5 0.25 59.22 7.685 b 5.70 21370 9343 988 616 47.67 47.7 0.8 62.2 0.23 c 4.52 16774 9563 1005 1453 49.83 49.8 0.8 65.0 0.34 Site 4 S16X19 a 1.68 5311 4526 907 616 74.62 36.2 0.7 110.2 0.54 94.52 34.82 b 0.96 2244 1800 663 290 83.85 29.8 0.6 136.2 0.52 c 1.37 9526 4856 1858 577 41.86 33.5 0.7 63.5 0.23 d 1.07 4370 1636 1063 270 43.82 31.3 0.6 68.2 0.47
Note: Underlined ages are not consistent with granite crystallization age as inferred from U-Pb dating and are therefore not included in the mean calculation. FT—alpha-ejection correction factor.
*Equivalent sphere radius. †Standard deviation.
attempted to obtain four ages from four grains for each sample. In three cases, we were unable to find sufficient apatite of high quality (Table 1). A complete description of sample preparation and analytical technique is provided in Yang et al. (2016), and the error and reproducibility cal-culations are explained in the Data Repository. Zircon U-Th Zonation
Hourigan et al. (2005) demonstrated that intracrystalline zonation of U and Th in zir-con can lead to an inaccurate estimate of the alpha-ejection correction and ultimately to age inaccuracy. In order to evaluate the potential effects of U and Th zonation on intrasample ZHe age variations, we performed additional U and Th measurements on sample S16X10 by laser-ablation ICP-MS. We used 32 of the 50 grains that were used for U-Pb dating and performed an additional measurement on each crystal rim, and then we compared the U and Th concentra-tions in the rim with the concentraconcentra-tions already measured in the center of the grains during U-Pb dating. The analytical results are presented in the Data Repository (Table ST2; Fig. S2). We followed the same method as described earlier herein, except that the laser was operated with a spot diameter of 7 μm, thus allowing us to access the most external part of the crystal rim. We present the results in the “U-Pb Zircon Geo-chronology” subsection of the “Results” section. Modeling of Cooling and Erosion
We inferred the thermal history of the Cil-incuo massif using a one-dimensional (1-D) inverse modeling approach, in order to derive thermal history information from thermochro-nometric data. We used the published code, QTQt (Gallagher, 2012), which uses thermo-chronometric kinetic models to find an optimum temperature history for multiple chronometers. It also permits the simultaneous inversion of mul-tiple samples, provided they have a common exhumation history but differ in depth, and so have a constant temperature offset in time, as occurs with near-vertical sample profiles. The list of input and output data is provided in Table 2. For each sampling site, we modeled granite sam-ples together: samsam-ples S16X15, S16X16, and S16X17 for site 1, samples S16X01, S16X03, S16X04, S16X05, and S16X08 for site 2, and samples S16X09, S16X09B, S16X10, S16X11, S16X12, and S16X13 for site 3. Because several samples from the same site but with different ele-vations were modeled simultaneously, each run required input of the temperature offset corre-sponding to the temperature between the sample with the highest elevation and the sample with
the lowest elevation, i.e., depending on the geo-thermal gradient. For site 1, the elevation range between the topmost and lowermost sample was 163 m; for site 2, it was 268 m; for site 3, it was 552 m. For the final temperature offset (i.e., for a given site, the temperature difference between the topmost and lowermost sample once they are at the surface), we used the surface temperature difference calculated using a 5–6°/km adiabatic gradient (Table 2). Thus, for each simulation, the temperature offset varied from the value corre-sponding to the initial geothermal gradient to the surface temperature offset.
The program QTQt samples the temperature-time (T-t) space into numerous temperature-temperature-time
(Ti, ti) points, in order to discretize the
time-temperature space. Then, using a Markov chain Monte Carlo method, it tests multiple cooling models to find the best cooling history that (1) fits modeled ZHe and AHe ages and (2) lim-its the total number of T-t points in the history, thereby avoiding overly complex thermal histo-ries. For each T-t path, single ZHe and AHe ages are predicted using helium diffusion kinetics from Ketcham et al. (2011). The fit between the observed ages and predicted ages is calculated using the likelihood function (Gallagher, 2012):
L = 12
i=1 N age
iobs ageipred i
2 ,
with N being the number of iterations and s
being the observed age error. Then, a decision is made either to retain the simulation if the fit is high or discard it if it is low. This process is repeated until an adequate set of solutions is obtained or the best solution is regarded
as adequate. We tested different parameters, including the number of iterations and number of T-t points to reach a thermal history we con-sidered as acceptable, or until further iterations failed to provide a significantly improved model. We found that 20,000–40,000 iterations were sufficient to find convergent behavior. Second, we tested the influence of the geothermal gra-dient on the thermal histories. In the “Thermal Modeling” subsection of the “Interpretation and Discussion” section, we describe our preferred models, whereas in Data Repository Section 5, we present other models with different input parameters.
RESULTS
Field Observations
Lithology in the Cilincuo massif is variable. The main phase includes quartz, biotite, feld-spar, and amphibole. The granite texture is often porphyritic (Wang et al., 2008) with centime-ter-scale pink/white K-feldspar crystals (Data Repository Fig. S1). We observed the intrusive contact between the granite and Triassic units at site 1 (Data Repository Fig. S1). Sampled out-crops are fresh, but in other places, the granite is highly weathered and arenitic. In site 2, the granite is cut by an ~10-cm-wide aplitic dike that we sampled for both U/Pb and (U-Th)/He dating (sample S16X01). The granite intrudes folded Triassic sediments that consist of pelites from the Lamaya formation (BGMR, 1991). Lower in the sedimentary succession, sedi-ments consist of interbedded sandstones, marls,
TABLE 2. SUMMARY OF THE PARAMETERS USED IN QTQT SIMULATIONS Parameters used for all simulations
Initial time 75 ± 10 Ma
Initial geothermal gradient 110 ± 40°/km
Initial temperature 350 ± 100 °C
Present-day lapse rate 5.5 ± 0.5°/km
Present-day surface temperature 5 ± 10 °C
Helium diffusion geometry Spherical
Helium diffusion model Ketcham et al. (2011) Apatite radiative damage model Gautheron et al. (2009) Zircon radiative damage model Guenthner et al. (2013) For each single zircon and apatite grain:
Crystal size
U, Th, (+ Sm for apatite), He concentration Elevation
Observed age
Additional temperature-time (T-t) constraints
Time Temperature Site 1 and 2 35 ± 35 Ma 100 ± 100 °C Site 3 60 ± 20 Ma 150 ± 50 °C 25 ± 25 Ma 50 ± 50 °C
and pelites (BGMR, 1991). At site 4 (sample S16X19), the granite is weathered, and thin sections show chloritized feldspar and calcite recrystallization. The apatites from this sample, observed under the microscope after mineral separation, are weathered.
We mapped the Xiangcheng fault using the Cilincuo massif geometry and the deflection of the courses of the Shuoqu and Mayi Rivers (Fig. 2). In addition, 15-m-resolution LAND-SAT images revealed the fault trace along an ~2-km-long portion of the fault but did not indicate the slip sense. The offsets of the rivers provide minimum values for the total displace-ment along the fault (Gaudemer et al., 1989). These values are 9 km for the Shuoqu River and 14 km for the Mayi River. The fault also offsets
the Cilincuo massif by ~10 km. U-Pb Zircon Geochronology
Here, we report results of zircon U-Pb dating of the Cilincuo massif and for granitic sample S16X19, which was collected in another pluton further south at site 4.
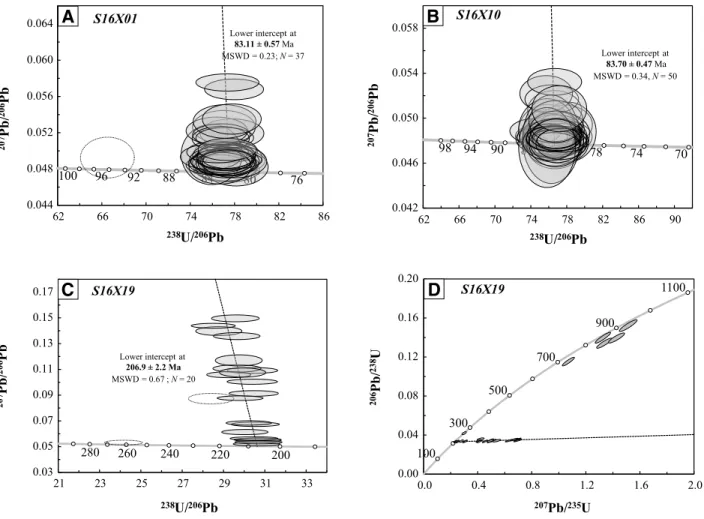
We analyzed 37 grains from aplite sample S16X01 (site 2, Cilincuo massif; see Data Repository Table ST2). On the Tera and Wass-erburg diagram (Fig. 5A), 36 of the 37 analytical points define a lower intercept at 83.11 ± 0.57 Ma, which corresponds to the crystallization age of the aplite dike and dates the end of plu-tonism. Fei et al. (2015) described a sliver of monzogranite intruding the granite we sampled for thermochronometry. They obtained a zircon U-Pb age of 79.33 ± 0.7 Ma, which is generally consistent with our data.
From granite sample S16X10 (site 3, south-ern part of the Cilincuo massif), the 50 analyzed grains exhibit a lower intercept at 83.70 ± 0.47 Ma on the Tera and Wasserburg diagram (Fig. 5B). This age is statistically indistin-guishable from that of the aplite dike (sample S16X01) that cuts the massif at site 2. Therefore, when interpreting the thermochronological data set, we used 83 Ma as the crystallization age for all samples.
For granite sample S16X19 (site 4), most of the zircon grains yielded Late Triassic ages, and a linear regression through 20 points gave
a lower intercept at 206.9 ± 2.2 Ma (Fig. 5C). This time is consistent with the abundant Late Triassic magmatism in the Yidun arc (Pan et al., 2004). The remaining six grains yielded Neo-proterozoic and Late Jurassic ages, which are older than the regional magmatism, and, thus, we interpret them as inherited zircons (concor-dia (concor-diagram in Fig. 5D).
(U-Th)/He Thermochronology of Zircon and Apatite
Mean ZHe ages of the Cilincuo massif are between 68.6 ± 6.0 Ma and 49.5 ± 2.2 Ma (Table 1). The AHe ages from site 2 can be divided into two groups (Fig. 6). The two sam-ples located above 3875 m yielded mean AHe ages of 30.6 ± 2.8 Ma and 40.6 ± 4.7 Ma, and the rest of the samples at lower elevations had ages between 14.6 ± 5.3 Ma and 9.8 ± 2.7 Ma. AHe ages of site 1 ranged from 14.6 ± 5.3 Ma
to 11.4 ± 1.1 Ma, and AHe ages of site 3 ranged from 10.3 ± 2.3 Ma to 7.9 ± 2.6 Ma (Table 1).
Triassic sandstone sample S16X14, col-lected near the valley bottom, yielded a mean
76 80 84 88 92 96 100 0.044 0.048 0.052 0.056 0.060 0.064 62 66 70 74 78 82 86 20 7Pb / 20 6Pb 238U/206Pb Lower intercept at 83.11 ± 0.57 Ma MSWD = 0.23; N = 37 S16X01 200 220 240 260 280 0.03 0.05 0.07 0.09 0.11 0.13 0.15 0.17 21 23 25 27 29 31 33 Lower intercept at 206.9 ± 2.2 Ma MSWD = 0.67 ; N = 20 S16X19 20 7Pb / 20 6Pb 238U/206Pb 100 300 500 700 900 1100 0.00 0.04 0.08 0.12 0.16 0.20 0.0 0.4 0.8 1.2 1.6 2.0 206Pb / 238U 207Pb/235U S16X19 70 74 78 82 86 90 94 98 0.042 0.046 0.050 0.054 0.058 62 66 70 74 78 82 86 90 Lower intercept at 83.70 ± 0.47 Ma MSWD = 0.34, N = 50 S16X10 238U/206Pb 20 7Pb / 20 6Pb
A
B
C
D
Late Jurassic ZHe age of 146.2 ± 8.3 Ma and a mean AHe age of 21.1 ± 6.9 Ma, which is younger than the depositional age of this sample, indicating that the sediments were buried deep enough to reset both apatite and zircon (U-Th)/ He thermochronometers.
For most zircon grains of sample S16X10, there was limited difference in Th concentrations between the center and the rim (Data Repository
Table ST3; Fig. S2); the ratio Thrim/Thcenter varied
from ~0.5 to ~3, except for one grain that had a 20-fold–enriched rim. U zonation was also
limited, with Urim/Ucenter ranging from 0.5 to 5
for 30 zircons out of 32. The two remaining grains showed a 10-fold U enrichment of the rim. INTERPRETATION AND DISCUSSION Cooling Age versus Crystallization Age
The two samples from the Cilincuo Mas-sif dated with the U-Pb method indicate that the crystallization age of the sampled granites is 83 Ma. Out of thirty-eight (38) ZHe ages obtained from these granites, two replicates from samples S16X05 yielded ZHe ages larger than the crystallization age, and we consider these two data points as outliers. The remaining ZHe grain ages from the same granitic rocks varied between 82 and 41 Ma, and such a wide range could reflect several factors affecting He diffusion in zircons, which we discuss in more detail in the next section. Overall, the overlap in the Cilincuo massif between some cooling ages and the crystallization age indicates that it is difficult to discriminate between postintrusion and exhumation-related cooling in the range of temperatures close to the closure temperature of the ZHe system. Exhumation-related cooling is, instead, recorded by the AHe grain ages of the Cilincuo granite, which are between 46 and 8 Ma and are therefore much younger than the crystallization age of the granite.
Sandstone sample S16X14 came from a location ~5 km distant from the contact with the Cilincuo intrusion, located near the valley floor (~10 m above the present-day riverbed) at lower elevations than the samples of the Cilincuo massif. The ZHe ages of this sample (176–140 Ma) are much older than the crystal-lization age and the ZHe cooling ages of the Cilincuo granite intrusion. These observations suggest that the pluton intrusion did not likely affect the sandstone sample and that the sand-stone and the Cilincuo granites had different cooling histories at temperatures close to the closure temperature of the ZHe system. It is difficult to say whether, at lower temperatures, the sandstone sample shares a common history with the samples of the Cilincuo massif: In fact,
we could only date two apatite grains from this sample, and they gave very different ages (16 and 38 Ma). However, the most important con-clusion that we can derive based on this sample is that the rocks near the valley floor have been experiencing temperatures below ~200 °C for more than 140 m.y. Thus, S16X14 provides an upper limit for the total Cenozoic exhumation along the valley of the Shuoqu River.
For sample S16X19 (site 4), all AHe and ZHe ages are much younger than the ca. 206 Ma crystallization age of this sample. Thus, we interpret the AHe and ZHe data of that sample as exhumation-related cooling. Both the AHe (38– 16 Ma) and ZHe (136–68 Ma) cooling ages of this sample are older than or overlap the cooling ages of the samples within the Cilincuo massif, although this sample is located at lower eleva-tions along the main trunk of the Shuoqu River. The very large dispersion of all the cooling ages from this sample does not allow much inference about its cooling history. However, the ZHe ages of this sample are Mesozoic, and its AHe ages are Cenozoic, and, therefore, like sample S16X4, it provides an upper limit for the total Cenozoic exhumation along the Shuoqu River valley. Data Dispersion
The standard deviations of the mean ages of the samples from the Cilincuo massif vary between 2 and 14 m.y. (23%) for the ZHe ages and between 0.8 and 5.3 m.y. (37%) for the AHe ages. Both the ZHe and AHe ages of the other two samples, S16X9 and S16X14, reproduced quite poorly, and S16X9 had the highest stan-dard deviation for both sets of ages: 34.8 m.y. for the ZHe ages and 15.8 m.y. for the AHe ages. Age dispersion can reflect differences in the properties of the grains that affect the He dif-fusion kinetics, such as the grain size, the U and Th concentrations, and the grain composition. The grain size controls the volume of the diffu-sion domain such that within the same sample, larger grains have older ages than smaller grains (e.g., Reiners and Brandon, 2006). Differences in the U and Th concentrations result in vari-able amounts of accumulated radiation damage, which can cause the He diffusivity to decrease at moderate damage levels and to increase at high damage levels (Guenthner et al., 2013). Another source of age dispersion is the
uncer-tainties in the alpha-ejection correction of the ages, which can be very large depending on the zonation of U and Th in the dated zircon (Hou-rigan et al., 2005). All these factors can affect independently and simultaneously the resulting ages, with amplified effects at low cooling rates, and it is often very difficult to discriminate the factor(s) that is(are) dominant.
Sample S16X14 is from a sandstone, and based on its Late Cretaceous ZHe ages, we speculate that the age dispersion of this sample was likely controlled by the combined effect of different grain composition and a long resi-dence at low temperatures where radiation damage accumulated. Sample S16X19 is from a strongly weathered Triassic granite (site 4 in the DongWang area) with very low apatite quality, which largely explains the poor reproducibility of its AHe ages but not of its ZHe ages. Other samples from the same region and rock type or other data are not available to gain some insights into the scarce reproducibility of this sample, and therefore we do not further consider it for our interpretation.
The large number of grains dated from the Cilincuo massif allows a more detailed analy-sis of the possible causes of the age dispersion, which is, however, moderate for most samples. If the age dispersion in our samples is related to variable grain size, then we should observe mostly positive correlations between age and grain size. The equivalent spherical radius (Rs; e.g., Reiners and Brandon, 2006) of a grain is proportional to its diffusion domain, and in the
dated grains, it varies between 30 and 80 mm,
with a positive correlation with age in only two samples (Data Repository Fig. S2A). If our samples were mostly affected by radiation damage, then we should observe correlations between the ages and the effective U concentra-tion (eU; Flowers et al., 2007), which is a proxy for radiative damage. These correlations should be positive at moderate eU values and negative at high eU values (Guenthner et al., 2013). All zircon grains had eU values between 130 and 1900 ppm, and they showed positive, negative, or no correlations with eU, independent from the magnitude of the eU content (Data Reposi-tory Fig. S2A). Thus, we cannot resolve whether either the effect of grain size or the radiation damage, or both, could explain the observed age dispersion (Data Repository Table ST3; Fig. S2). Some constraints on the possible extent of U and Th zonation of our samples can be derived from the comparison of the U and Th concentrations at the rim and at the center of the zircons from sample S16X10 from the Cilincuo massif that we dated with the U-Pb method. In this sample, the ratio between U or Th at the rim and U or Th at the center ranges from 0.5 to 5 for >90% of the measured zircons. For a fivefold increase of the U-Th concentrations at the rim, the alpha-ejection correction factor Ft calculated using the program of Gautheron and Tassan-Got (2010), and based on grain geometries similar to those of the zircons from sample S16X10 (in particular, S16X10-a, S16X10-b, and S16X10-c), would be 0.01–0.1 times smaller than the alpha-ejection
correction factor calculated assuming no zona-tion. Thus, although we did not test the zonation for the other samples of the Cilincuo granite, we infer that zoning is not likely the main cause for the age dispersion of the Cilincuo samples. A possible explanation is, instead, that the large spread from 82 to 41 Ma of the ZHe ages from the Cilincuo massif may represent a long resi-dence after intrusion of the Cilincuo granites at temperatures close to those of the ZHe PRZ. If the Cilincuo granites were intruded at shal-low crustal levels, only a few kilometers deep, and if after intrusion they were affected by very slow exhumation, then they could have cooled rapidly down to temperatures close to those of the country rocks into which they intruded. In this scenario, the most retentive zircons would give ZHe ages close to the age of crystalliza-tion, whereas the least retentive zircons would record the later phase of slow cooling. In order to test whether this scenario is plausible, we performed thermal modeling using QTQt and we included in our models all the ZHe values
that were not older than the crystallization age (thus, only two ages were discarded). Modeling results are discussed in the following section. Thermal Modeling
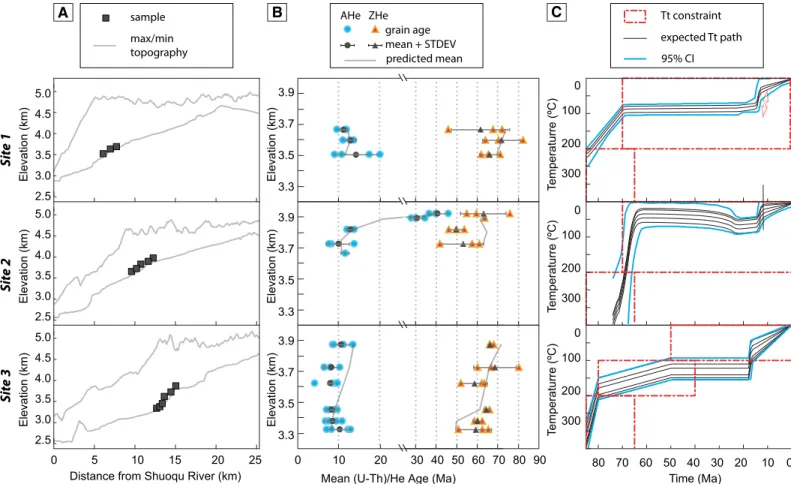
The distribution of cooling ages within a landscape is largely controlled by variable exhu-mation rate coupled with a geothermal gradient and by differential exhumation represented by samples distributed across elevation (Wagner et al., 1979). An age-elevation correlation can be used to calculate apparent exhumation rates based on simple linear regression, or ages can be modeled for specific cooling histories using kinetic models for daughter product retention. The code used in this paper, QTQt, assumes that samples located closely together in elevation can be related through a constant temperature gradi-ent and calculates ages using diffusion kinetics for the apatite and zircon systems. The dated samples from the Cilincuo pluton are located at elevations between 3300 and 3900 m (Figs. 7A
and 7B), and all the ZHe ages vary between 80 and 40 Ma. At site 3, the linear regression through the mean ZHe ages of six samples distributed over 600 m of elevation offset has a low
prob-ability (R2 = 0.4) and a slope of 43 m/m.y. Thus, if
we assume that, despite the low probability of the fit, the ages vary linearly with the elevation, then they would imply a very low exhumation rate. At site 1, the linear fit between the mean ZHe ages and the elevation has a negative slope. At site 2, the slope is positive with a moderate slope and with a poor probability. These observations sug-gest that if there is a correlation between cooling ages and elevation, it indicates a low exhumation rate. The AHe ages at elevations of ~3900 m range between 40 and 30 Ma and at lower eleva-tions center around 10 Ma. Unfortunately, like the ZHe samples, the AHe samples also show poor age-elevation correlations, even when only the ages around 10 Ma are considered. However, in contrast to the ZHe ages, the AHe ages below 3900 m elevation are distributed over a relatively narrow range that we interpret as indicating a
0 100 200 300 0 100 200 300 80 70 60 50 40 30 20 10 0 0 100 200 300 Time (Ma) 10 0 20
Mean (U-Th)/He Age (Ma) 3.3 3.5 3.7 3.9 3.3 3.5 3.7 3.9 3.3 3.5 3.7 3.9 E le va tio n (k m ) E le va tio n (k m ) E le va tio n (k m ) 40 30 50 60 70 80 90 Sit e 1 3.0 3.5 4.0 4.5 5.0 Elevation (km) 2.5 3.0 3.5 4.0 4.5 5.0 Elevation (km) 2.5 Sit e 2 Sit e 3 3.0 3.5 4.0 4.5 5.0 Elevation (km) 2.5 0 5 10 15 20 25
Distance from Shuoqu River (km)
Temperaturre (ºC) Temperaturre (ºC) Temperaturre (ºC) Tt constraint expected Tt path 95% CI sample max/min topography grain age ZHe AHe mean + STDEV predicted mean
A
B
C
Figure 7. (A) Elevation swath profiles for sites 1, 2, and 3 with locations of the samples. All transects start at the bed of the Shuoqu River and are per-pendicular to the river, as indicated on Figure 4. The width of the swath profiles is 6 km. (B) Observed thermochronometric ages of the Cilincuo massif compared to the predicted ages corresponding to the thermal models shown on panel C. All ages indicated are mean ages except for sample S16X01 (one single apatite replicate yielding a cooling age of 11.85 Ma) and for the zircon (U-Th)/He (ZHe) age of 64 Ma of sample S16X05 (one single zircon replicate). (C) Thermal history deduced from inverse modeling of zircon and apatite (U-Th)/He (ZHe and AHe) data from site 1, site 2, and site 3. Blue lines correspond to the 95% confidence interval (CI). Each black line corresponds to the temperature-time (T-t) path of one sample.


![[PDF] Créer des factures avec Excel pdf | Cours Bureautique](data:image/gif;base64,R0lGODlhAQABAIAAAP///wAAACH5BAEAAAAALAAAAAABAAEAAAICRAEAOw==)